Real-time Monitoring Technology of Voltage Sag Disturbance in Distribution Network Based on TCN-Attention Neural Network and Flink Flow Computing
Zexi Chen1, Li Yang1, Jiannan Tian1, Zeng Chen1, Xiaoye Xu1 and Ergang Zhao2,*
1State Grid Beijing Electric Power Company, Beijing 100031, China
2Wuxi Research Institute of Applied Technologies, Tsinghua University, Binhu District 214072, Jiangsu Province, China
E-mail: zhaoeg10@163.com
*Corresponding Author
Received 21 February 2023; Accepted 05 April 2023; Publication 10 July 2023
Abstract
In the face of the challenges brought by the complexity of power grid, diversification of disturbance factors, isolation of monitoring points and other issues to the cause identification of voltage sag disturbance, this paper proposes a real-time monitoring technology for voltage sag disturbance in distribution network based on TCN-Attention neural network and Flink flow calculation, which has important practical significance for controlling voltage sag and reducing economic losses. This method uses Temporal Convolutional Network (TCN) to extract the cross time nonlinear characteristics of voltage sag time series data, which effectively solves the problems of long-term dependence on time series and low training output efficiency of existing time series models. In order to further improve the recognition accuracy of the model, Attention mechanism is introduced to mine the duration relationship in voltage sag data. At the same time, the method also constructs a parallel real-time monitoring platform based on Flink streaming computing framework, embeds the TCN-Attention voltage sag cause identification model generated by training, so as to realize real-time identification and monitoring analysis of voltage sag disturbances at each monitoring point of the distribution network. In this paper, various voltage sags are simulated on IEEE 14 bus system using PSCAD software, and the proposed method is verified and tested. The deep learning fusion model has high recognition accuracy for the cause of voltage sag, and the flow computing platform has excellent performance in time delay and throughput indicators, and can realize the parallel real-time monitoring and analysis of voltage sag causes in distribution network.
Keywords: Voltage sag, TCN, attention, Flink, real-time monitoring.
1 Introduction
Under the background of rapid development of smart grid, the problem of power quality disturbance has attracted more and more public attention, which is very harmful and very easy to cause significant economic losses to industrial users and power systems [1]. Voltage sag is one of the most important and common power quality disturbances in the power system at present [2]. It is of great practical significance to capture voltage sag events in time and identify the causes of the disturbances accurately, which can provide important support for the governance of voltage sag.
At present, there are mainly two methods for identifying voltage sag causes. The first is the traditional mechanism analysis method. First, the characteristics of the disturbance signal are extracted through the manual signal processing method, including Fast Fourier Transform [3], S-transform [4], etc., and then the relevant features are input to the machine learning classifier for automatic identification of the cause of voltage sag, including neural networks [5], decision trees [6], etc. With the wide application of power electronics technology in power system [7], the complexity of power load is increasing, and the nonlinear disturbance sources are connected to the power grid in a large area, which makes it difficult for this identification model based on physical characteristics to fully and accurately characterize the disturbance characteristics of voltage sag [8].
The second is the more popular deep learning method in recent years [9–12]. The data driven deep neural network can automatically extract the abstract feature expression of voltage sag disturbance from massive data, so as to achieve accurate identification of voltage sag causes, and has strong generalization ability [13]. This method has achieved good results to a certain extent, but there are still two key problems: on the one hand, the more studied models for identifying voltage sag causes are all series models represented by RNN [14], etc. The sequence network structure of these models is directly applicable to time series data, and can effectively extract the time series change characteristics of voltage sags. However, due to the long-term dependence on historical data, this kind of model has some problems in training, such as long-term forgetting caused by gradient disappearance, and low efficiency caused by non parallel computing. With the increase of the time step, this kind of model is easy to lose the characteristics of local fluctuation, randomness and nonlinearity in the process of voltage sag feature extraction. On the other hand, the voltage sag cause identification model generated by existing research has obvious hysteresis in practical application, and each monitoring point in the distribution network is independently monitored and analyzed. For complex voltage sag disturbance events, the data collected by existing methods in actual landing applications are discrete and isolated, and it is impossible to conduct real-time identification of voltage sag causes and correlation analysis of multiple monitoring points for power grids in complex regions [15].
This paper proposes a real-time monitoring technology of voltage sag disturbance in distribution network based on TCN-Attention neural network and Flink flow calculation. The main contributions are as follows: (1) This method uses Temporal Convolutional Network (TCN) [16] to extract temporal characteristics of voltage sag data. TCN introduces extended convolution and residual structure on the basis of CNN [17]. The expanded convolution expands the perception of historical information of the original causal convolution network by means of cavity convolution, it can effectively extract the cross time nonlinear dependence in the time series data of long voltage sags. The residual structure accelerates the feedback and convergence of the original multi-layer neural network. Compared with the sequence model represented by RNN, TCN has the advantages of parallel computing, flexible change of receptive field size, stable gradient, low memory requirements, variable input length, etc. (2) This method introduces Attention [18] to allocate more weight to the temporal characteristics of important time nodes to capture the global and local connections, which is helpful to mining the duration relationship in voltage sag data and can effectively improve the recognition accuracy and generalization ability of the model. (3) This method constructs a parallel real-time monitoring platform based on Flink streaming computing framework, embeds TCN Attention voltage sag cause identification model generated by training, and can realize real-time identification, monitoring and analysis of transient voltage disturbances at each monitoring point of distribution network. Compared with the earlier streaming processing frameworks such as Spark [19] and Storm [20], Flink has low latency, high throughput and perfect fault tolerance mechanism [21], which is applicable to the business requirements of real-time online processing of complex regional power grids.
In this paper, an IEEE14 bus system is built through PSCAD software to simulate the occurrence of various voltage sags in regional power grids, so as to obtain experimental data, verify the deep learning fusion model and streaming computing platform. Compared with other existing methods, the TCN-Attention fusion model proposed in this paper is expected to have higher recognition accuracy in different scenarios, and the Flink streaming computing platform can have better performance in time delay and throughput indicators, so as to achieve parallel real-time monitoring and analysis of voltage sag causes in distribution networks.
2 Analysis of Voltage Sag Characteristics
Voltage sag refers to a transient disturbance phenomenon where the effective value of power supply voltage suddenly drops to 90%10% of the rated value in a very short time and lasts for 0.530 cycles [22]. As the system short circuit fault, large motor startup and transformer switching are the main causes of voltage sag in power system [23], among which, the short circuit fault is subdivided into single-phase, two-phase and three-phase short circuit faults, so this paper mainly studies the above voltage sag causes.
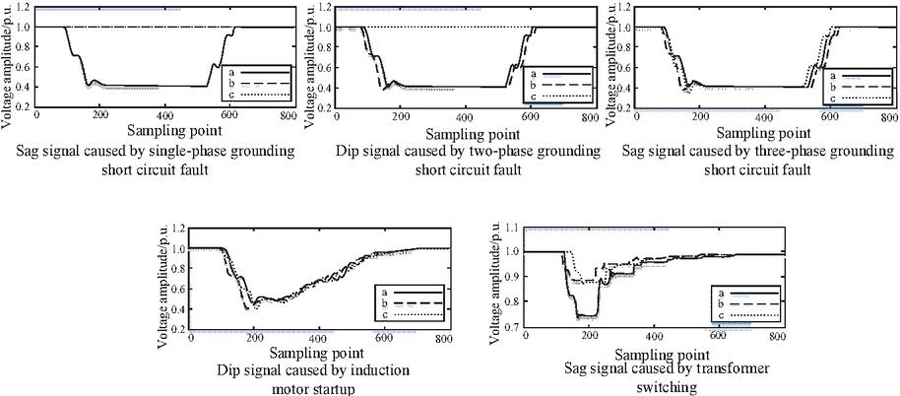
Figure 1 Comparison chart of voltage sag signals.
Different types of voltage sag causes have different characteristics, and often change significantly in the process of disturbance reduction and recovery [24]. As shown in Figure 1, the RMS signal of the voltage sag of the short-circuit fault is more rapid in the decline and recovery phases, and the waveform of the voltage amplitude change is similar to a rectangle. During the sag, the voltage amplitude is basically stable, and the three-phase voltage sag amplitude is generally different. For large induction motor startup and transformer switching, the RMS signal of voltage sag is relatively slow in the descending phase. Considering that voltage sags caused by different disturbance causes have obvious time series characteristics, this paper constructs a deep learning fusion model, which can automatically extract various local change laws mentioned above, and realize accurate identification of voltage sag disturbance causes.
3 Real-time Monitoring Technology of Voltage Sag Disturbance in Distribution Network Based on TCN-Attention and Flink
This paper proposes a real-time monitoring technology of voltage sag disturbance in distribution network based on TCN-Attention neural network and Flink flow calculation, which mainly includes two steps. Step 1: Build a voltage sag disturbance cause identification model integrating TCN and Attention, and use historical data to conduct iterative training on the deep learning fusion model, so as to achieve efficient and high-precision identification of voltage sag causes; Step 2: Build a parallel real-time pattern recognition platform for regional power grid monitoring points based on Flink streaming computing platform, embed the identification model of voltage sag causes into the streaming computing platform, so as to realize parallel real-time pattern recognition of voltage sag recording data at monitoring points.
3.1 Identification Model of Voltage Sag Disturbance Based on TCN and Attention
The TCN-Attention based voltage sag cause identification model is shown in Figure 2, which mainly includes three parts:
(1) Input layer: Preprocess the voltage sag recording data, such as normalization, to serve as the input of TCN-Attention deep learning fusion model.
(2) Backbone network: First, TCN neural network is used to extract the nonlinear characteristics of voltage sag recording data, then the Attention mechanism is used to obtain the importance of node feature vectors at different times for identifying voltage sag causes, and finally the weighted processing results are obtained.
(3) Output layer: Consists of the full connection layer and Softmax layer in the neural network, so as to output the identification results of the backbone network.
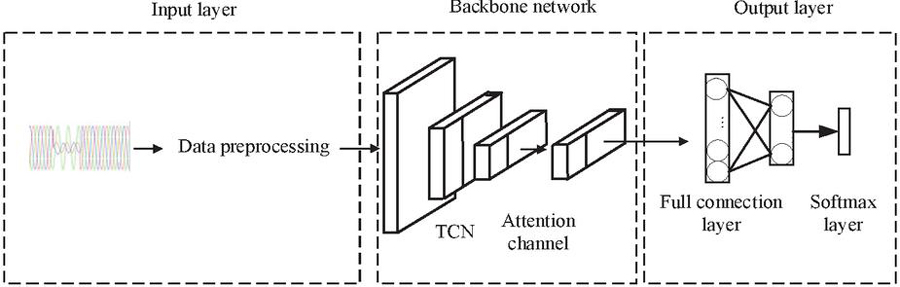
Figure 2 TCN-Attention based model diagram for identifying voltage sag cause.
3.1.1 Data preprocessing
Considering that the difference of the original data varies greatly and may ignore the data characteristics of small values, this paper normalizes the original data to [0, 1] interval. The specific formula is:
| (1) |
Where: is the numerical value obtained after normalization, is the minimum value, and is the maximum value.
Considering that in the iterative training process of the model, the cause of voltage sag disturbance needs to be used as a tag for the supervised learning of the neural network, so as to obtain more reasonable model parameters, this paper uses one-hot coding method to code the cause tag of voltage sag disturbance. In this coding method, the data of the corresponding category is 1, and the rest is 0.
3.1.2 TCN neural network construction
TCN is an algorithm that uses convolution structure to solve time series problems. It is composed of multi-layer one-dimensional extended causal convolution and residual elements. Compared with the traditional convolution structure, TCN occupies less memory, has a larger visual range, and has faster training speed.
Structure of extended convolution
The network structure of the extended convolution is shown in Figure 3. Because the linear size of the network depth limits the visual range of the causal convolution, this paper introduces the extended convolution, which can handle more complex dependencies of classified data under the same conditions, greatly improving the classification accuracy of the model.
The extended convolution samples the input data at different steps, and the sampling frequency varies at different levels. When the sampling frequency is 1, it means that all data in the lower layer will be sampled; when the sampling frequency is 2, it means that one sampling data is taken from every two points. In order to extract more abundant and accurate feature information, the input layer often samples all data. As the level increases, the sampling frequency will gradually increase. Therefore, after the introduction of extended convolution, the length of the effective window will also increase rapidly with the increase of the level, thus increasing the visibility without increasing the number of convolution layers.
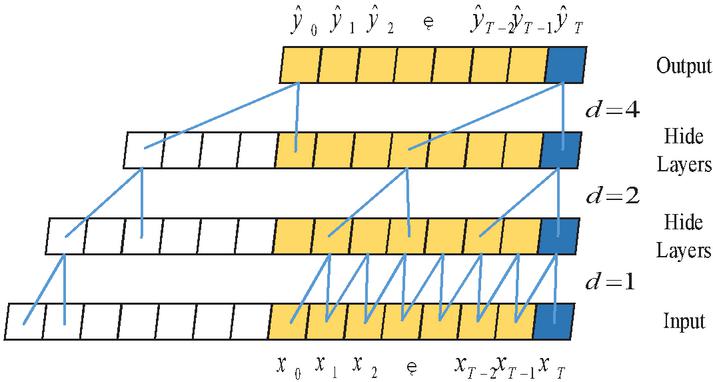
Figure 3 Structure diagram of expanded convolutional network.
Structure of residual units
The structure of TCN residual unit is shown in Figure 4. The output and input data of different levels of networks are added to form a residual block, which is output after activating the function. The residual block connection mechanism can improve the feedback and convergence of the network, and can avoid the ladder disappearance and gradient explosion problems existing in traditional neural networks.
Each residual element consists of two convolution elements and nonlinear mapping. First, the input data is subjected to one-dimensional extended causal convolution. Then the weight is normalized to solve the gradient explosion and improve the calculation speed. Then the ReLU activation function is used to make the network nonlinear. Then drop out the output data. In this process, randomly discard the neurons to solve the over fitting problem and improve the model training speed. The function of nonlinear mapping is that whenever the input and output dimensions of residual unit are different, convolution is used to reduce the dimensions of high dimensional data.
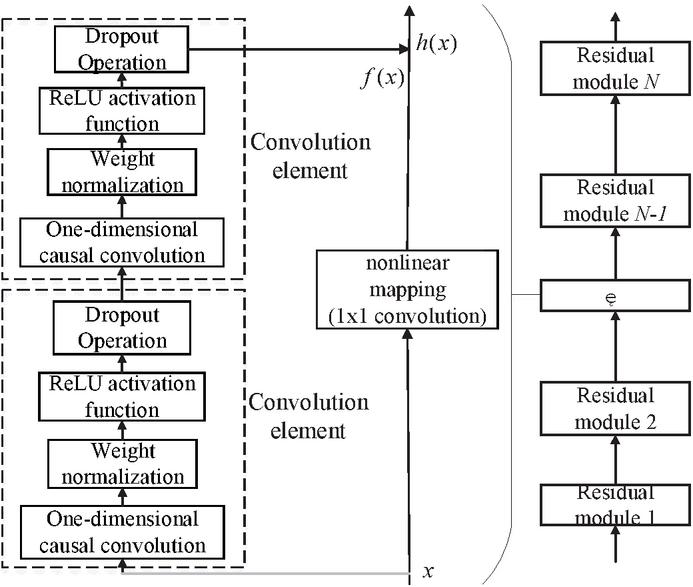
Figure 4 TCN residual unit structure diagram.
3.1.3 Attention neural network construction
The structure of Attention network is shown in Figure 5. The output vector of TCN network is . The feature vectors of different time nodes have different weights in the classification results. The function of Attention mechanism is to emphasize the time nodes with higher weights and highlight the importance of local feature changes. Attention takes the weighted sum of feature vectors of each time node as the network output.
The weight scoring function of Attention mechanism adopts the method of scaling point product, and its output vector is:
| (2) |
Where: K and V represent key value pairs (Key, Value), Q represents target data. Indicates the dimension of Q. to obtain the calculated value of Attention, Q K V.

Figure 5 Attention mechanism network structure diagram of TCN.
3.1.4 Output layer construction
The output layer is composed of full connection layer and Softmax layer. The activation function is Tanh. The Softmax layer maps the output of the hidden layer to the interval [0, 1] to obtain the distribution probability of labels of each category, and then identify the voltage sag. Suppose there are m sag types, representing the output of the ith neural unit, Si represents the probability of identification type i. The formula of Softmax layer is:
| (3) |
The loss function L of the voltage sag cause identification model in this paper adopts the cross entropy loss function, whose formula is:
| (4) |
Where: represents the real classification result, represents the predicted classification results, and N represents the number of training samples.
3.2 Parallel Real-time Pattern Recognition Platform for Regional Power Grid Based on Flink
3.2.1 Flink component structure and operation process
Flink supports highly flexible time window based operations. It is configured with a fault tolerance mechanism based on lightweight distributed snapshots. It has the advantages of low latency and high throughput. It has been widely used in large-scale real-time concurrent stream computing tasks. Its component structure and running process are shown in Figure 6.
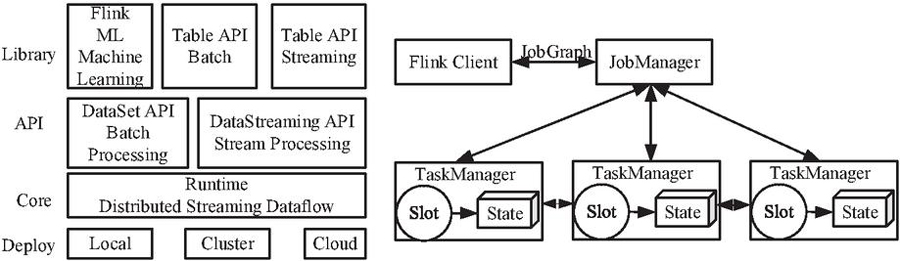
Figure 6 Flink component structure (left) and operation process (right).
The Flink component structure is divided into four layers. The Deploy layer indicates that Flink supports multiple deployment modes, including Local, Cluster and Cloud; Core layer represents the core compilation layer of Flink distributed stream data processing, such as the underlying design of the operation diagram; The API layer represents batch computing and stream computing APIs. Flink batch computing is based on stream computing design, so Flink has more advantages in stream computing scenarios; The Library layer represents the architecture design of Flink application layer, which is based on the API layer. Flink has the performance of high throughput and fault tolerance, and can stably and continuously process unbounded and concurrent data flow. It is very suitable for parallel real-time identification of the cause of voltage sag disturbance in regional power grids.
3.2.2 Construction of Flink parallel real-time pattern recognition platform
In this paper, a parallel real-time pattern recognition platform for regional power grid monitoring points based on Flink streaming computing is built, and TCN-Attention voltage sag cause identification model generated by training is embedded. The overall design is shown in Figure 7.
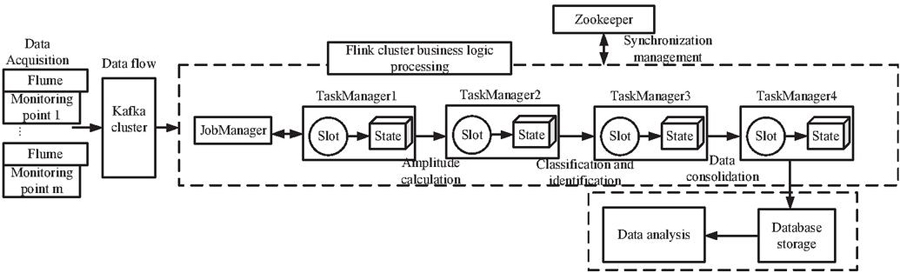
Figure 7 Parallel real-time pattern recognition platform for monitoring points of regional power grid.
This paper constructs a computing cluster based on Flink streaming computing framework. The main node is JobManager, which is used to manage computing resources, receive upstream voltage sag data flows and distribute them to corresponding work nodes for processing. The work node is the TaskManager, which is used to accept the task scheduling of the JobManager and execute the corresponding calculation processing tasks. The calculation processing task first calculates the voltage RMS and voltage amplitude of the received voltage sag recording data at each monitoring point. The calculation formula of the voltage RMS is shown in formula (5). Then, the trained TCN-Attention fusion model is used to identify the cause of the disturbance of voltage sag events whose voltage RMS does not exceed 90% of the rated value.
| (5) |
Where: U is the effective value of voltage, M is the number of sampling points in a cycle, and uj is the voltage value of sampling point j.
After the platform is built, data sliding windows with appropriate size can be designed according to the needs of power grids in different regions in the future. When the regional power grid is affected by the voltage sag disturbance event, the voltage sag recording data of each monitoring point will enter the sliding window for logical analysis, so as to realize the real-time identification and monitoring analysis of voltage sag causes at each monitoring point of the distribution network.
4 Experimental Simulation and Example Analysis
4.1 Experimental Simulation and Data Acquisition
In this paper, the experimental data is obtained through the simulation platform. As shown in Figure 8, an IEEE14 bus system is established in the PSCAD platform [25]. The fundamental frequency is set to 50 Hz. The system includes 14 bus, of which nodes 1, 2, 3, and 8 are connected to generators; 17 lines (100 km in length).
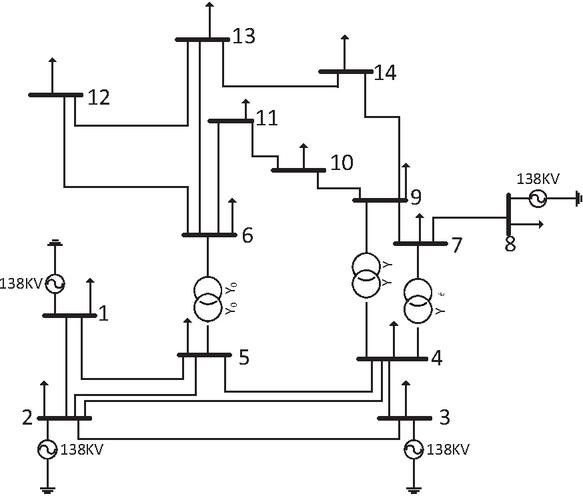
Figure 8 IEEE 14 bus system structure.
The experiment is simulated by adjusting parameters, the duration is 0.3 s. By changing the line load, the location of the fault and the voltage sag phase of the short-circuit fault in the system, The short circuit fault of different voltage sags (recorded as C1-C7, including A phase voltage sag C1, B phase voltage sag C2, C phase voltage sag C3, AB phase voltage sag C4, AC phase voltage sag C5, BC phase voltage sag C6, ABC phase voltage sag C7), induction motor startup (recorded as C8) and transformer switching (recorded as C9) are obtained. Each signal has 500 groups, and the characteristic data length is 900 sampling points.
4.2 Training Process and Result Analysis of Fusion Model
There are 4500 voltage sag data sets in this experiment. 75% of the data in each voltage sag signal is used for model training, and 25% of the data is used for model verification. The average accuracy rate of the verification set is used as the final result output. Considering that the actual regional power grid will be interfered by noise, this paper adds white Gaussian noise to the collected voltage sag recording signal, and the signal-to-noise ratio is 50 dB, 40 dB, 30 dB and 20 dB respectively, so as to verify the anti noise performance of the model.
4.2.1 Network parameter setting and training process
TCN-Attention voltage sag cause identification model has two layers of residual units, each of which contains two convolution units and one nonlinear mapping. ReLU is selected as the activation function in the experiment. Since the input vector and the output classification label of the residual unit have different dimensions, the direct sum operation is limited, so a convolution layer is added to the residual mapping to reduce the dimension. The convolution layer size is . Adam optimizer and random gradient descent algorithm are used in training. Table 1 shows the parameters of TCN-Attention short-term load forecasting network model.
Table 1 Parameter table of TCN-Attention voltage sag cause identification model
| Parameter | Numerical Value |
| Momentum parameter | 0.99 |
| Expansion coefficient | (1,2,4,8) |
| Filter | 128 |
| Convolution kernel size | 2 |
| Initial learning rate | 0.0002 |
| Training rounds | 600 |
| Training batch | 64 |
The training process of TCN-Attention voltage sag cause identification model is shown in Figure 9. With the iterative training, the loss of the network continues to decrease and remain stable, while the identification accuracy of the fusion model continues to improve until it is close to 100%.
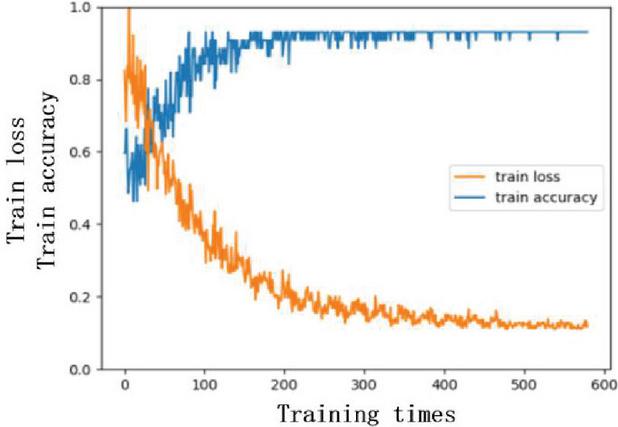
Figure 9 Training process of TCN-Attention fusion model.
4.2.2 Model validation and result analysis
In order to verify the classification accuracy of the fusion model, this paper introduces the evaluation index for the classification of voltage sag causes in traditional methods, and its calculation method is as follows.
| (6) |
Where, T is the test sample set of a certain voltage sag category, and C is the number of samples in the set where the voltage sag is correctly identified.
In addition to the simulation environment, this paper also checks the fusion model in the real environment. The real data comes from the short circuit fault recording database of a power grid that occurred from February to October 2021. The measured short-circuit fault data of the power grid totals 53, including 4 phase B short-circuit faults, 10 phase BC short-circuit faults and 39 phase ABC short-circuit faults. The experimental results are shown in Table 2. The average recognition rate of the model in the noiseless environment is 100.0%. When the noise level increases, the model also maintains a high self-learning ability in the presence of noise, which proves that the model has good noise resistance.
Table 2 Classification results of voltage sag causes
| Recognition Accuracy (%) | ||||||
| Type | 0 dB | 20 dB | 30 dB | 40 dB | 50 dB | Measured Data |
| C1 | 100.0 | 99.31 | 99.56 | 100.0 | 100.0 | — |
| C2 | 100.0 | 98.89 | 100.0 | 100.0 | 100.0 | 100.0 |
| C3 | 100.0 | 98.55 | 98.88 | 99.0 | 99.70 | — |
| C4 | 100.0 | 98.21 | 98.50 | 100.0 | 100.0 | — |
| C5 | 100.0 | 99.40 | 99.80 | 99.80 | 100.0 | — |
| C6 | 100.0 | 97.31 | 98.22 | 98.73 | 99.50 | 99.70 |
| C7 | 100.0 | 98.33 | 98.50 | 99.51 | 99.88 | 99.90 |
| C8 | 100.0 | 98.84 | 98.88 | 99.0 | 99.70 | — |
| C9 | 100.0 | 98.0 | 98.50 | 99.40 | 99.53 | — |
4.3 Comparison with Other Deep Learning Models
As shown in Figure 10, compared with RNN, LSTM, TCN, and LSTM-Attention, the TCN-Attention fusion model in this paper has significantly higher recognition accuracy for measured voltage sag data. The main reason is that the Attention layer can make the model focus more on some key features of the voltage sag signal and weaken other unimportant parts. Therefore, after adding the Attention mechanism, the recognition accuracy of LSTM model and TCN model has been greatly improved.
At the same time, compared with RNN, LSTM, TCN and LSTM-Attention, TCN-Attention fusion model learns more abundant and comprehensive voltage sag features, which makes the accuracy rate significantly higher. To sum up, the introduction of Attention mechanism in TCN not only extracts comprehensive sag signal features, but also considers the impact of key features in sag signal on classification results, so the recognition accuracy is the highest.
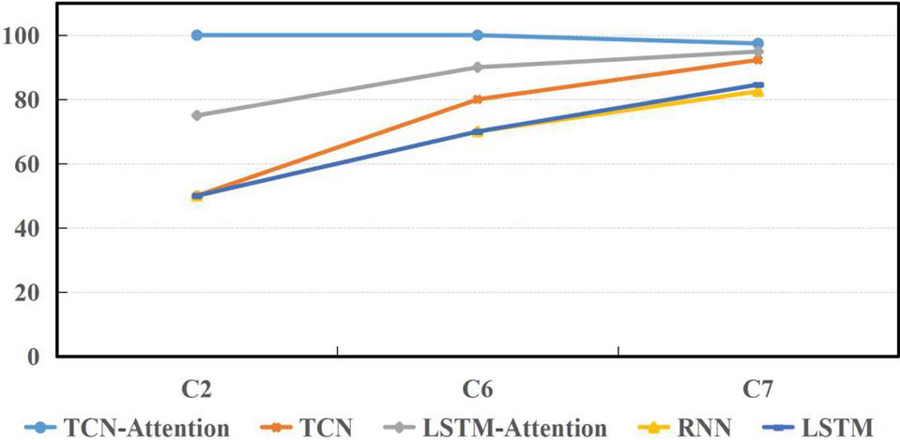
Figure 10 Accuracy comparison of measured short circuit data in a power grid.
4.4 Performance Analysis of Flink Streaming Computing Platform
The big data stream generated by the regional power grid is real-time, continuous and dynamically increasing, which requires the streaming computing platform to have excellent low latency computing capability, high throughput capability and reliable operation capability. This paper sets up two sets of environments, Flink stand-alone environment and Flink framework based cluster environment consisting of one master node and two working nodes, and compares them from the perspective of throughput and time delay. The experiment was conducted three times, and the average value was taken as the result, as shown in Figures 11 and 12.
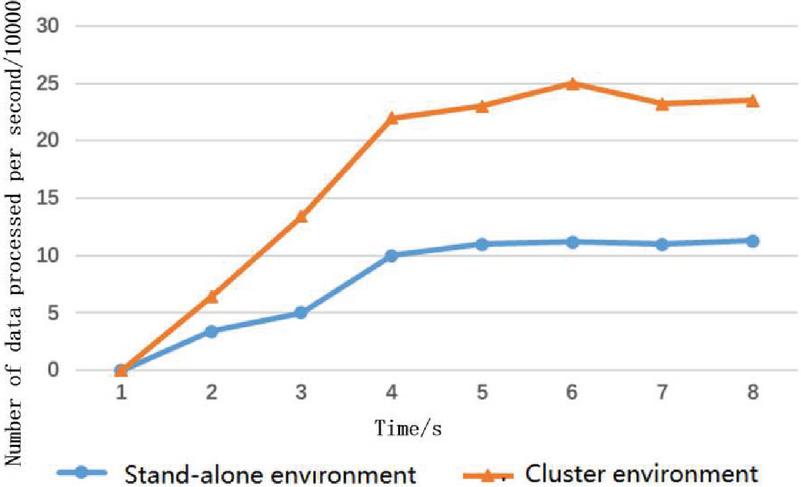
Figure 11 Throughput comparison.
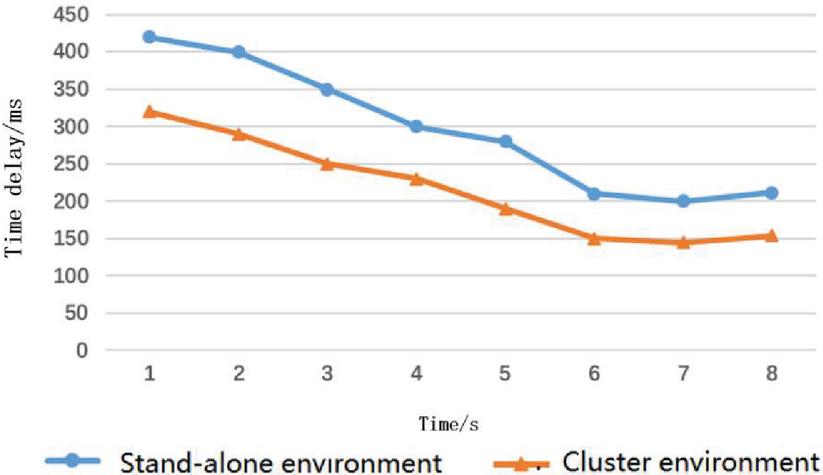
Figure 12 Time delay comparison.
As a mainstream big data computing platform, Flink streaming computing framework has shown excellent performance in throughput and time delay in both stand-alone and cluster environments with the system startup. The throughput of the cluster environment gradually stabilized after 5 seconds of operation, with nearly 240000 data streams that can be processed per second, nearly twice the performance of the stand-alone environment. The time delay of the cluster environment gradually stabilized after 6 seconds of operation, and the time delay of message processing stabilized at about 150 milliseconds, which decreased by 27.5% compared with the stand-alone environment.
From the perspective of operation mechanism, the cluster environment can flexibly schedule resources in a timely manner, balance the computing load, overcome the performance bottleneck of traditional stand-alone computers, and meet the requirements of low latency, high throughput, and continuous and stable operation. At the same time, the cluster has certain scalability. By adding corresponding computing nodes, the processing capacity of the overall cluster can be further improved, so that the larger scale data traffic of the regional power grid can be processed in parallel in real time.
5 Conclusion
This paper proposes a method based on TCN Attention neural network and Flink flow calculation to realize real-time monitoring and analysis of voltage sag in distribution network. This method first builds a deep learning fusion model based on TCN and Attention, uses TCN to extract the temporal characteristics of voltage sag data, and introduces Attention mechanism to further improve the model discrimination ability. The method then embeds the trained fusion model into the parallel real-time pattern recognition platform based on Flink streaming computing framework to achieve real-time monitoring of voltage sag in distribution network. The experimental results show that the deep learning fusion model proposed in this paper has a high recognition accuracy for voltage sag causes. The flow computing platform proposed in this paper has excellent performance in time delay and throughput indicators. In the future, on the basis of the real-time monitoring and analysis platform of voltage sag in distribution network built in this paper, we can continue to study the propagation trajectory of voltage sag in the complex network structure of distribution network and its related nonlinear mapping characteristics, which can reduce the human and financial consumption on the grid deployment monitoring devices to a certain extent, and also have a certain reference significance for the voltage sag governance of power system.
Acknowledgements
This research was Supported by the science and Technology Project of State Grid Beijing Electric Power Company (contract no.: 520202220002).
References
[1] Qu Hezuo, Liu Heng, Li Xiaoming, et al. A feature combination optimization method in power quality multi disturbance classification [J]. Electric Power Automation Equipment |Electr Power Autom Eq, 2017, 37(03): 146–152.
[2] Zhicong Zheng, Linhai Qi, Hong Wang, et al. Recognition Method of Voltage Sag Causes Based on Bi-LSTM[J]. IEEJ Transactions on Electrical and Electronic Engineering, 2020, 15(3): 415–428.
[3] Ahmadi Hamid Reza, Mahdavi Navideh, Bayat Mahmoud. A novel damage identification method based on short time Fourier transform and a new efficient index[J]. Structures, 2021, 33.
[4] Li Jinsong, Liu Hao, Wang Dengke, et al. Classification of Power Quality Disturbance Based on S-Transform and Convolution Neural Network[J]. Frontiers in Energy Research, 2021.
[5] Jürgen Schmidhuber. Deep learning in neural networks: An overview[J]. Neural Networks, 2015, 61: 85–117.
[6] Sagi Omer, Rokach Lior. Approximating XGBoost with an interpretable decision tree[J]. Information Sciences, 2021. 572.
[7] Shuai Zhikang, Special Editor’s Message [J]. Automation of Electric Power Systems, 2017, 41(8): 1–1.
[8] Shang Yuwei, Guo Jianbo, Wu Wenchuan, et al. A Preliminary Study of Electric Brain: A Multimodal Adaptive Learning System [J]. Proceedings of the CSEE, 2018, 38(11): 3133–3143.
[9] Liu Jiahan, Chen Kexu, Ma Jian, et al. Classification of three-phase voltage sags based on convolutional neural network and random forest [J]. Power System Protection and Control, 2019, 47(20): 112–118.
[10] Wang Wei, Li Kaicheng, Xu Liwu, et al. Power quality disturbance identification method based on one-dimensional convolutional neural network multi task learning [J]. Electrical Measurement and Instrumentation, 2022, 59(03): 18–25.
[11] Qu Xiangshuai, Duan Bin, Yin Qiaoxuan, et al. Power quality disturbance classification method based on sparse automatic encoder depth neural network [J]. Electric Power Automation Equipment | Electr Power Autom Eq, 2019, 39(05): 157–162.
[12] Shanmugapriya S, Maharajan D. Most Valuable Player Algorithm Based State Estimation for Energy Systems[J]. Distributed Generation and Alternative Energy Journal, 2021.
[13] M. D. Zeiler, M. Ranzato, R. Monga, et al. On rectified linear units for speech processing[C] //2013 IEEE International Conference on Acoustics, Speech and Signal Processing. Vancouver, BC, Canada: IEEE, 2013: 3517–3521.
[14] Zheng Zhicong, Wang Hong, Qi Linhai. Voltage sag source identification method based on deep learning model fusion [J]. Proceedings of the CSEE, 2019, 39(01): 97–104324.
[15] Kang Rui, Qi Linhai, Wang Hong, et al. Parallel real-time monitoring technology for transient voltage disturbances based on flow computing [J]. Power System Protection and Control, 2020, 48(02): 129–136.
[16] Lea Colin, Flynn M D, Vidal R, et al. Temporal convolutional networks for action segmentation and detection[C]//30th IEEE Conference on Computer Vision and Pattern Recognition. Honolulu, USA, 2017: 1003–1012.
[17] Krizhevsky A, Sutskever I, Hinton G. ImageNet classification with deep convolutional neural networks[C]// NIPS’12 Proceedings of the 25th International Conference on Neural Information Processing Systems, December 3–6, 2012, Nevada, USA: 1097–1105.
[18] Vaswani A, Shazeer N, Parmar N, et al. Attention Is All You Need[J]. arXiv, 2017.
[19] Alnafessah A, Casale G. A Neural-Network Driven Methodology for Anomaly Detection in Apache Spark[C]// 11th International Conference on the Quality of Information and Communications Technology. 2018.
[20] Karunaratne P, Karunasekera S, Harwood A. Distributed stream clustering using micro-clusters on Apache Storm[J]. Journal of Parallel & Distributed Computing, 2017, 108(Oct.):74–84.
[21] Carbone Paris, Ewen Stephan, Fóra Gyula, et al. State management in Apache Flink: consistent stateful distributed stream processing[J]. Proceedings of the VLDB Endowment, 2017, 10(12): 1718–1729.
[22] Electrical I O. IEEE Guide for Voltage Sag Indices[C]// IEEE Std. IEEE, 2014:1–59.
[23] Li Xialin, Liu Yajuan, Zhu Wu A new method for classification and identification of composite voltage sag sources based on distribution network [J] Power System Protection and Control, 2017, 45(2): 131–139.
[24] Dou J, Liu Z, Xiong W, et al. Research on Multi-level Cooperative Detection of Power Grid Dispatching Fault Based on Artificial Intelligence Technology[J]. Distributed Generation and Alternative Energy Journal, 2021.
[25] Zheng Y, Xue X. Simulation of Wind-solar Complementary Distribution Power Generation System Based on PSCAD[J]. Distributed Generation and Alternative Energy Journal, 2021.
Biographies

Zexi Chen received the bachelor’s degree in electrical engineering and automation from Huazhong University of Science and Technology in 2013, the master’s degree in Electrical Engineering from University of Southern California in 2015, and the philosophy of doctorate degree in renewable energy from North China Electric Power University in 2022, respectively. He is currently working as a senior engineer in State Grid Beijing Electric Power Company. His research areas include smart grid, integrated energy technologies, power system risk assessment, renewable energy and energy storage. He is a standing director of IEEE Power&Energy Society Satellite Technical Council – China.

Li Yang, received bachelor’s degree in Electrical Engineering and Automation from Qinghai University in and master’s degree in electrical engineering from Tianjin University of Technology. He is currently working as a senior engineer in State Grid Beijing Electric Power Company. His research interests include smart grid and operation and maintenance of power grid.

Jiannan Tian, received the bachelor’s degree in Electrical Engineering and automation from Northeast Electric Power University in 2016, and the master’s degree in electrical engineering from North China Electric Power University. He is currently working as a senior engineer in State Grid Beijing Electric Power Company. His research interests include smart grid and digital grid.

Zeng Chen received the bachelor’s degree of electrical engineering and automation from Northeast Electric Power University in 2013, the master’s degree of high voltage and insulation technology from North China Electric Power University in 2016. He currently work in the State Grid Beijing Electric Power Company as a senior engineer and has accumulated plenty of experience in the operation and maintenance management of distribution network. His research fields include fault diagnosis of high-voltage equipment in power system and other related research.
Xiaoye Xu, received the bachelor’s degree in electric engineering from North China Electric Power University in 2011, the master’s degree in electric engineering from North China Electric Power University in 2020, respectively. He is currently working as a senior engineer in State Grid Beijing Electric Power Company. His research areas include power distribution automation and electricity marketing. He has been involving many important power engineering project.

Erang Zhao received the bachelor’s degree in electrical engineering from Hebei of University Technology in 2014 and the master’s degree in electrical engineering from Tsinghua University in 2021, respectively. He is currently working as a researcher at Wuxi Research Institute of Applied Technologies, Tsinghua University. His research areas include power system operation and planning, microgrid operation.
Distributed Generation & Alternative Energy Journal, Vol. 38_5, 1637–1658.
doi: 10.13052/dgaej2156-3306.38512
© 2023 River Publishers