Multi-objective Collaborative Planning Method for Micro-energy Systems Considering Thermoelectric Coupling Clusters
Han Jinglin1, 2,*, Hu Ping2, Zhao Hui2, He Chunguang1, Hou Ruosong1 and Li Bo3
1State Grid Hebei Economic Research Institute, Shijiazhuang 050000, China
2State Grid Hebei Electric Power Co., LTD., Shijiazhuang 050000, China
3State Grid Hebei Service Center, Shijiazhuang 050000, China
E-mail: jinglinoliver@163.com
*Corresponding Author
Received 25 February 2023; Accepted 04 April 2023; Publication 10 July 2023
Abstract
As the continuous development of integrated energy system and distributed power supply, operation economy and regional energy Internet reliability, especially micro-energy system, are increasing. Therefore, it is necessary to build multi-energy complementary micro-energy system, innovate energy supply mode, realize collaborative and efficient utilization among multi-energy systems, improve energy utilization efficiency and absorb renewable energy. In this paper, the decision model of distribution network planning scheme including distributed generator supply is established from four aspects: investment and operation cost, extra reserve capacity, energy conservation, reliability cost. The decision model involves a lot of parameter calculation and selection judgment, so after the decision goal is determined, an decision framework based on DS-MAS is established, that is, parameters are automatically calculated and selected based on different scenarios. Model validity is proved via a practical decision project.
Keywords: Multi-objective collaborative planning, electric heating load, power grid interaction, thermoelectric coupling, integrated energy.
1 Introduction
With the continuous promotion of “coal to electricity” project, power demand surges, the power peak-valley difference increases. The power grid operation stability and economy are faced with severe challenges. Especially for the distribution network in rural areas, at the end of the distribution network, the grid structure is weak, and problems such as low power supply reliability, poor power quality and insufficient power supply capacity are often caused by fluctuating seasonal loads [1]. Therefore, in view of the diversified energy demand in rural areas under the scenario of user-side thermoelectric coupling, the construction of multi-energy complementary rural micro system, supply innovation mode, and realization of collaborative and efficient utilization between electric and multi-energy systems are effective means and important guarantees to improve the operation economy and reliability of rural low voltage network in case of coal power transformation. It is conducive to improving energy utilization efficiency and absorbing renewable energy [2].
Since most renewable energy sources are intermittent, the future energy system needs to be more flexible to balance supply and Demand. Demand Response(DR) through flexible adjustment of heat pump load has been paid more and more attention as a measure to economically and effectively integrate intermittent renewable energy [3]. Heat pumps, for example, are expected to have large peak loads in winter when deployed on a large scale for space heating. Reference [4] refers to DR as a technology or program that focuses on adjusting power consumption to balance demand and supply, which can decrease the peak load caused by heat pump operation. While renewable energy sources produce large amounts of electricity, the heat, which is generated from the thermal pump, can be stored in heated building or thermal tanks. In the process of power demand response, the heat from pump could be reduced while the stored thermal is released. In this way, as long as the system is well controlled, the peak load in the grid can be reduced while maintaining the thermal comfort of building residents [5]. The system flexibility is increased via applying water tanks as a heat shock absorber to increase the stored energy.
Integrated Energy System (IES) is one of the most promising operational modes with commercial value in energy Internet, as well as an critical mainbody for the realization of “Internet Plus” IES. Reference [6] proposes a two-stage regional IES planning method, which is divided into the first stage aiming at economy and environmental protection and the second stage aiming at optimization of operation. However, the objectives set by this method are not comprehensive enough for the integrated energy system, and only economic objectives are considered in the operation optimization of the second stage. Reference [7] uses mixed integer programming method to solve the established park integrated energy system model containing energy storage, and solves the system planning problem in three stages. However, the objective function of capacity allocation step is still mainly economic. In Reference [8], a comprehensive energy system capacity allocation model with natural gas storage as the core was constructed, and the objectives including economy, operation, power balance and carbon emission are considered. The cuckoo search algorithm was selected for system optimization, but this method did not take into account the influence of output fluctuation of distributed power generation equipment. In Reference [9], k-means clustering algorithm was adopted to limit the amount of wind power scenarios, in which a multi-regional IES capacity allocation model was built considering investment, operating cost and wind abandonment penalty. However, this model only considered the delay effect and heat loss of heat network, not the delay effect and loss of gas network. In order to avoid equipment redundancy and investment advance at the initial stage of comprehensive energy system planning in the park, Reference [10] proposed a multi-stage planning method considering construction time sequence. With the power balance and equipment operation at each stage as constraints, the planning model was constructed with the minimum life-cycle cost as target, which adopted the mixed integer linear programming algorithm for carrying out capacity configuration for the equipment put into operation at each planning stage. But the model does not take into account fluctuations in electricity, natural gas and other prices. Considering the inertia characteristics of gas, heat and electricity of different orders of magnitude, Reference [11] puts forward the standby capacity configuration scheme of IES taking into account heat/gas inertia. Inertia characteristics of heat/gas equipment are used as the flexible standby of the system, which is complementary to the direct standby of the power generation side. However, the current configuration results of this model are relatively conservative, and the network constraints of the system should be combined. At the same time, considering the economy of the system, the model is further refined and revised to be closer to the operation requirements of the actual system. With the continuous mature application and broad development space of P2G technology as the background, Reference [12] puts forward a capacity planning model for P2G equipment in a comprehensive energy system with combined power-gas operation. The model aims to minimize the total cost, which takes initial investment and operation cost into account. Meanwhile, the differences of equipment cost and energy conversion in the two-step reaction of water electrolysis and methanation in P2G technology are considered, as well as the impact of direct injection of hydrogen into the natural gas pipeline on the system model and system operation.
Due to the current research on capacity allocation of regional IES, the model objective function is generally minimum total cost, while considering environmental protection and other indicators. In order to make the model more accurate and more universal, a two-layer model of equipment capacity allocation is constructed considering energy cascade utilization and multi-energy coupling complemency. By analyzing system operation demand, the objective function is determined to be the economy, environmental protection and energy utilization efficiency, and the equation constraint based on power demand-supply balance and the inequality constraint considering the system operation constraint and equipment characteristic constraint. However, a large number of current researches aim at a single application scenario, without considering the differences in natural resource endowment, load characteristics and user demands in actual application areas. Therefore, the proposed method in this paper has a wide application scenarios and supports the healthy and sustainable development of regional IES.
2 Regional IES Infrastructure and Load Equipment
2.1 Basic Framework of Regional IES
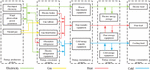
Regional comprehensive energy system is a complex system covering whole sections, which including energy production, transmission, conversion, storage and consumption. It can organically combine multiple energy subsystems such as cold, heat, electricity and gas to realize energy efficient and conservation utilization in a specific region [13]. Comparing with the traditional, the regional IES abandons planning and designing energy subsystems separately, but takes them as a whole, which fully takes into account the coupling and complementarity among multiple sources [14]. The coupling and complementarity of power, gas, cold, heat and other systems in the production, conversion, transmission, storage and consumption is an critical feature of regional IES, as well as the key to realizing efficient energy utilization. The basic physical architecture of a regional IES is shown in Figure 1.
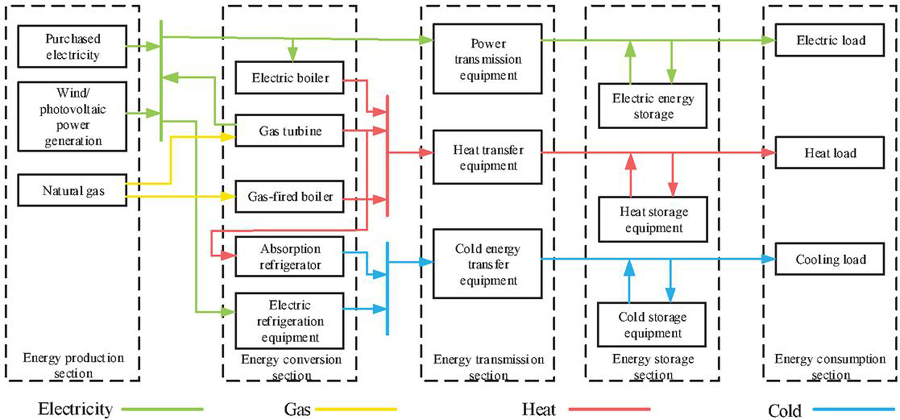
Figure 1 Basic physical architecture of a regional IES.
Figure 1 indicates in detail the whole process of four kinds energy in the regional IES through production, conversion, transmission, storage, consumption and other links. It shows how renewable and traditional energy are converted into electricity, heat and cold, which meets the side load demands of users. It shows that the regional IES could realize the coupling, complementation and good interaction among multiple energy sources.
2.2 Main Equipment Characteristic Analysis
Regional IES is a complex system considering all sections of production, transmission, conversion, storage and consumption. It involves various kinds of energy supply, energy storage and other equipment with different characteristics. Establish the basic model system of each equipment in the system, and analyze the characteristics of the equipment.
2.2.1 Power supply equipment
(1) Distributed photovoltaic
Photovoltaic (PV) is a significant form of solar energy utilization at present, as well as one of the important ways of renewable energy utilization with huge scale and mature technology. The photovoltaic power is mainly affected by temperature and light intensity, and the conversion efficiency of solar cells will also affect the photovoltaic power output. The mathematical model is as follows:
| (1) |
where indicates the PV module output power (kW); indicates the maximum output power (kW) under standard test condition (STC); and are respectively illumination intensity (W/m) under actual conditions and standard test conditions, where ISTC 1000 W/m; k is the photovoltaic cell power temperature coefficient (%/C); and are respectively the actual operating temperature of photovoltaic cells and the reference temperature under standard test conditions, where C.
At present, the frequent access of distributed photovoltaic makes the low voltage network transform from the traditional passive network to the active network, and has different degrees of effect on reliability of the distribution network, power quality, relay protection and so on. It is necessary to analyze and predict the photovoltaic output characteristics scientifically. The results of relevant studies at present show that the photovoltaic output characteristics are consistent with Weibull Distribution, Gumble extreme value Distribution, normal distribution, Beta Distribution and other distribution models, among which the beta distribution is considered to be more consistent with the distribution law of standardized light intensity.
In summary, the PV output probability density function characteristics is:
| (2) |
where and indicate two parameters of beta distribution; indicate standardized light intensity:
| (3) |
where , are actual illumination intensity and maximum illumination intensity respectively.
The cumulative distribution function of photovoltaic output is:
| (4) |
(2) Distributed wind power
Wind power is another important, mature and widely used form of renewable energy generation, which uses the blades of a wind turbine to turn a generator that converts wind energy into electricity. Since the 1990s, wind power technology has been developing vigorously and improving day by day, with good environmental and economic benefits. According to the different development scale and access voltage level, wind power generation can be roughly divided into centralized wind power and distributed wind power.
Permanent magnet synchronous motor is mostly applied in small to medium size fans for distributed wind power. The principle of aerodynamics indicates the wind energy (mechanical energy) captured by the blades of wind turbine (WT):
| (5) |
where, is air density, which is 1.29 kg/m under standard conditions; R is the radius of the blade; v is wind speed; is the wind energy capture coefficient, which is related to blade tip ratio and wind wheel pitch angle. represents the ability of the fan to convert wind energy into usable mechanical energy.
The equation above indicates wind speed v the most significant factor affecting the fan output power, and the randomness of wind speed directly leads to the randomness of the fan output power. In the study of the fan output power, the main wind speed indicators include input-wind speed, the cut-out wind speed and the rated wind speed. The wind turbine will not output if the actual wind speed is too large or too small to ensure operation safety. The wind turbine output power can be expressed by the following empirical function:
| (6) |
where indicates rated wind speed; indicates cut in wind speed; indicates cut out wind speed, is rated power of wind turbine.
2.2.2 Heating equipment
(1) Gas boiler
Gas boiler mainly comsumes natural gas into combustion raw material. Compared with traditional coal-fired boilers, gas boiler can improve efficiency while reduce pollution. In regional comprehensive energy system, gas boiler can operate in coordination with cold, hot and electricity triple supply system for heating, which is a commonly used heating equipment at present.
Gas-fired boiler is a nonlinear correlated system with multi-input and multi-output. The main input-output relationship includes two parts: fuel control system and feed risk control system. In the working process of gas-fired boiler, the heat released by natural gas combustion includes load absorption heat and heat loss, which is mainly caused by insufficient gas combustion, smoke exhaust and heat dissipation.
The amount of natural gas consumed per unit time in the gas-fired boiler is:
| (7) |
where indicates gas-fired boiler heat power; indicates gas-fired boiler heat coefficient of, indicates natural gas low heat value, set as 9.7 kW h/m, generally.
(2) Electric boiler
Using electricity as energy source, electric boiler is a kind of thermal energy mechanical equipment that outputs rated working medium (such as water vapor) when the heat medium (such as organic heat carrier as water or heat conduction oil) is heated to a certain state (meeting the requirements of temperature and pressure) through the heat exchange part of the boiler by using the principle of electromagnetic induction heating or resistance heating. The heat generated is mainly used for hot water supply or heating. The electric boiler model is:
| (8) |
Where, indicates electric boiler heat power of the, indicates the electric boiler heat conversion efficiency, indicates electric boiler power.
(3) Heat pump
Heat pump can transfer heat stored in air, water and soil, so as to realize low-temperature waste heat utilization and improve energy utilization efficiency. In this process, a small part of electric energy is consumed. Heating medium source of heat pump can be divided into ground, water and air. The interaction between heat pump and electricity triple system could realize flexible adjustment of thermoelectric output characteristics of the triple system and absorption utilization of waste heat, which is green and environmental protection distributed energy system construction mode.
For example, ground source heat pump can realize temperature condition and hot water supplement. Compared with central air conditioning, it saves electricity when producing the same heating and cooling effect, and does not produce carbon dioxide and other greenhouse gases in the working process. The heat transferred by ground source heat pump could reach 45 times of the electric energy consumption. Compared with conventional energy systems such as liquefied petroleum gas, electric heating, the ground source heat pump system average energy efficiency coefficient could reach 3.2, and the economy is better than the above traditional energy system. The input-output relationship of ground source heat pump model is:
| (9) |
where a, b, and c are all quadratic function coefficients.
2.2.3 Energy storage
The storage of electricity, heat, gas, hydrogen and other energy in a broad sense can be called energy storage. which increases the energy utilization efficiency and economy of regional IES. This paper mainly considers electric and heat (cold) storage. The energy storage mathematical model is:
where indicates the electric energy storage capacity during period t; indicates the self-discharge rate of electric energy storage; and are the storage charging and discharging power during period t; and are the storage charging and discharge efficiency.
Meanwhile, energy storage can only be in one kind of state (charging or discharging). The charged state at the initial time and the final time should be the same within a scheduling cycle T. Therefore, the following balance constraints should be met during the operation of the energy storage:
| (11) |
where and indicate the upper limit and lower limit of the allowable storage capacity; and are the logical variables representing energy storage charging and discharging; means in charging state, otherwise in discharging state; and indicate the upper and lower limits, respectively; and indicate the upper and lower limitsr, respectively.
3 Multi-objective Collaborative Planning of Micro-energy System Considering Thermoelectric Coupling Cluster
Capacity planning is a basic problem in regional IES research. The allocations of renewable energy power generation equipment, as well as energy conversion equipment capacity, should be reasonable, which concerns not only the initial investment cost of regional comprehensive energy system construction, but also long-term operation [10]. Capacity planning and optimization research of regional IES including renewable energy usually refers to a multi-objective optimization problem with complicated solving process, which requires decision-makers to comprehensively control economic and environmental objectives from a global perspective in the planning stage. Compared with traditional power systems, capacity planning of regional integrated energy systems needs to consider a wider variety of energy sources, and the corresponding constraints and objective functions are more complex. However, its basic solution ideas are similar to those used in power systems to solve unit combination problems, economic dispatching problems and optimal power flow problems [12].
The economic benefit and environmental friendliness are usually set to overall planning objectives, firstly, the objective functions which should be considered in the capacity optimization model as a multi-objective optimization problem are analyzed, and the mathematical expressions of the three objective functions of economy, environmental protection and energy utilization efficiency, operation safety stability are given. Secondly, by sorting out the system, equipment and other constraints that need to be met in the actual planning, the constraints that need to be considered by the model are analyzed, including equality constraints and inequality constraints, and the mathematical expressions are listed respectively. Finally, the selection principle of the system equipment is determined, and the optimization variables of the model are determined according to the equipment.
3.1 Objective Function
In system planning stage, economy is the primary objective to be concerned about. Economy directly determines whether the system has reasonable returns. Only when the returns are guaranteed can the project be feasible. Therefore, minimum investment is the first objective function of the system. In the context of the “two-carbon” goal, the environment-friendly characteristics of the system should be considered as the second goal. Moreover, the current national policy has strict control measures on pollutant emissions, and excessive emissions will pay high environmental costs and cause damage to the project economy. One of the advantages of regional IES over the traditional is that regional IES can carry out the energy cascade utilization, so the utilization efficiency is set to third objective function.
In order to take system economic benefits and environmental protection into account, the three objectives should be considered in the planning stage, in order to get the most in line with the expectations of investors. The following three objective functions are analyzed separately.
3.1.1 Economic objective function
Economic objectives are the primary concern in the planning stage. Only reasonable income level can ensure the feasibility of the project. When considering the economic objective, the main research object is the system cost, that is, the smaller the objective function, the better the system economy.
This paper uses the whole life cycle cost as index to measure the system economy. The whole life cycle cost consists initial investment cost , operation cost , maintenance cost and equipment abandonment cost :
| (12) |
Where is:
| (13) |
where t refers to service life of equipment (year); r refers to base discount rate; indicates one-time investment cost of equipment acquisition in the initial construction stage of system, which is converted into annual cost, including the equipment purchase cost and installation cost. The purchase cost of equipment is related to the capacity, while installation cost mainly refers to site construction, pipeline laying, labor and other auxiliary, which have nothing to do with the capacity of equipment; is the set including all system devices; Pin indicates rated installed capacity of class i equipment (kW); represents unit capacity cost of class i equipment (RMB/kW); indicates installation cost of class i equipment (RMB); represents capital recovery factor.
Operation cost is:
| (14) |
The operation cost above refers to the cost of obtaining all kinds of energy required by the system for operation, mainly including the cost of electricity, natural gas and heat (corresponding to , and respectively in the above equation). Considering the daily maintenance, operation cost and loss cost of all kinds of power supply equipment in the system, this paper uses differentiable quadratic function to describe the output power relationship between the power supply unit and power cost. There are three energy costs of electricity, gas and heat:
| (15) |
where , , and are power supply equipment set, gas equipment set, heating equipment set, respectively; , , and are the output of power supply equipment, gas equipment, and heating equipment, respectively; , , and are cost factor of power supply equipment; is the operation efficiency of power supply equipment; and are the cost coefficient of gas equipment set and heating equipment set, respectively.
Maintenance cost is:
| (16) |
where indicates unit output power maintenance cost for the class i equipment during t period, indicates the output power of the class i equipment during period t, and refers to set as 1 h in this paper.
Abandonment cost is:
| (17) |
where is the unit capacity decommissioning disposal cost of class i equipment, indicates class i equipment unit capacity residual value; indicates class i equipment installed capacity.
3.1.2 Environmental protection objective function
In regional IES planning, pollutant gas emission level is another important issue to be considered. This paper mainly considers the carbon dioxide emissions, as well as the sulfur dioxide and nitrogen oxides emissions. The energy consumed by the whole system mainly includes purchased electric power, natural gas, wind, solar and other renewable energy. It is assumed that the purchased electric power is coal power, and the pollution gas emissions generated by the purchased electric power and natural gas are analyzed separately. Maximum DG power is set as environmental protection target, which could be accessed. Objective function can be described as:
| (18) |
where refers to DG capacity accessed by node i; indicates node set which DG could access.
3.1.3 Operation safety stability function
The research shows that DG connection plays an important role in improving the static voltage stability margin of distribution system. This paper uses the following voltage stability indicators to quantify its function:
| (19) |
where represents the voltage stability index of the branch b (the first node is a and the last node is b); X and R are reactance and resistance of branch b respectively; and are reactive and active power of branch b respectively; is the voltage amplitude of the head node.
The voltage stability index L of the whole system is the maximum voltage stability index of all branches:
| (20) |
where N is the total number of system nodes. The branch corresponding to L is called the weakest branch of the system.
When voltage collapse occurs in the system, it must start from the weakest branch with the largest L, so the maximum objective function is equivalent to:
| (21) |
3.2 Constraint Condition
In order to ensure that the calculation results can meet various constraints in actual operation, the range of values of each optimization variable and the correlation relationship between optimization variables should be considered. The constraints considered in the capacity optimization model, which takes equality constraints and inequality constraints into account. Among them, equality constraints refers to supply-demand balance relationship, and inequality constraints are mainly used to limit the boundary conditions, including system operation constraints and equipment characteristics constraints. The specific analysis is as follows.
3.2.1 Equality constraint
The equality constraints refer to system supply and demand balance constraints, including:
(1) Electric power balance
where indicates PV output during t period, refers to the wind turbine power generation at t period; indicates gas turbine power output at t period; refers to power purchased from the grid during t period; indicates stored energy net discharge power during t period; indicates system comsumption power during t; is the power sold by the system to the grid at t period.
(2) Heat power balance
| (23) |
where is the collection of all heat-generating equipment in the system; refers to heat capacity of class i equipment during t period; indicates net heat release of thermal energy storage at t period; refers to system heat load demand during t period.
(3) Cold power balance
| (24) |
where is the collection of all refrigeration equipment in the system; refers to cooling capacity of the class i equipment during t time; refers to net cooling capacity of thermal storage during t period; indicates cold condition demand duringt t period.
3.2.2 Inequality constraint
Equation constraints are power flow equations, while inequality constraints include: node voltage constraints, branch power constraints, generator output constraints, DG output constraints, reverse power flow constraints, etc:
| (25) |
where and are the lower and upper of ; is the distribution network node set; is the node active power vector; is the upper limit of ; is the input DG active power; refers to maximum input DG active power value; refers to the collection of DG input nodes; indicates node load; indicates downstream active power; refers to capacity of the upper branch connected to node i; refers to DG inverse power factor, which is recommended as 0.3.
In addition, DG power shall be mainly absorbed nearby, and in principle, it is not allowed to send back power to the superior:
| (26) |
3.3 Model Solution
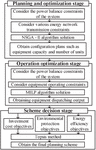
A two-level optimization algorithm is applied for dealing with regional IES capacity allocation. Based on model planning above, its goal is to optimize the installation capacity of multiple energy supply storage equipments in regional IES and obtain the optimal configuration combination of various equipment according to analysis of the regional power, heat, cooling, as well as other load demand and the distributed renewable energy output characteristics; The lower-level model based on operation needs to optimize the scheduling output of the equipment capacity solved by the upper level. The results of the upper algorithm will be transmitted to the lower level as initial parameters, and the results of the lower algorithm could be transmitted to the upper level to verify the result accuracy, so as to achieve the goal of continuously optimizing the solution results, and the process will be continuously iterated to find the optimal planning scheme. The whole problem solving process can be divided into the following three stages:
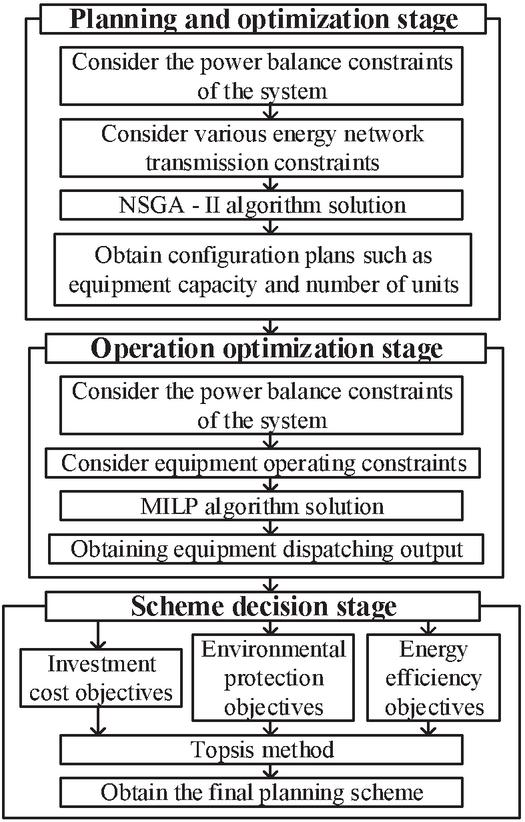
Figure 2 Model solution process.
(1) Planning and optimization stage of regional IES
Planning optimization stage corresponds to the upper layer of the two-level optimization algorithm, which can accept optimal configuration combination scheme of various equipment required by the system, including the capacity and number of equipment. The constraints considered at this stage are mainly the power balance constraints and those related to the transmission of various subsystems (that is, the system operation constraints in Section 3.2). The NSGA – II algorithm is applied to model solution. Then the final result comes to a Pareto set including all non-inferior solutions. Each solution corresponds to a device capacity configuration scheme.
(2) Operation optimization stage of regional IES
Operation optimization stage corresponds to the lower level of the two-level optimization algorithm, which aims to solve the equipment scheduling output under the optimal capacity allocation scheme, including equipment power, pollutant emissions and energy utilization efficiency. The constraints considered in this stage are mainly the power balance constraints of the system and the equipment operation constraints, which are solved by using the MILP algorithm. The final result is the system operation results corresponding to each capacity configuration scheme.
(3) Scheme decision-making stage of regional IES
According to solution results of two-level optimization algorithm, the investment cost, pollution gas emission level and energy utilization efficiency of each planning scheme are comprehensively considered, and combined with the actual needs of the project, Topsis method is used to make decisions on the scheme and determine the final planning scheme.
4 Case study
To prove the effectiveness and engineering applicability of the proposed method, an industrial zone (which located in Hebei Province, China) is choosed for the verification, which covers an area of 3 square kilometers. Analyze the load characteristics of electricity, heat and cooling of users in the park, select a typical day, combine the climate characteristics and resource conditions of the area where the park is located, determine the types and technical parameters of alternative energy supply equipment, and give other relevant boundary conditions. The program and application is carried out in Python 3.2. The computer configuration is Intel(R) Core(TM) i7-8750H CPU @ 2.20GHz, with 16GB RAM, 64 bit operating system.
4.1 Scenario Analysis
4.1.1 Typical day selection and load characteristic analysis
The load curve of typical days can represent the user energy consumption characteristics, and can be used to predict the development trend of regional load. At present, there are two main ways to obtain the typical daily load curve: first, based on historical curve, analyze key curve characteristics such as maximum load and average load, and select a day as a typical day through simple correction such as weighted average; The second is to optimize the selection of typical daily load curve by using cluster algorithm, artificial intelligence technology and other statistical analysis methods for massive data.
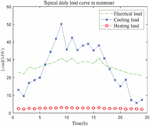
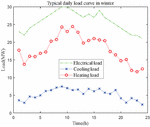
To make the economic and reasonable equipment capacity allocation and operation scheduling, according to the weather characteristics of Hebei Province, the year is separated into summer, winter and interim season, and the corresponding typical representative days are selected respectively. The typical electric, heat and cooling load curves are shown in the figure below.
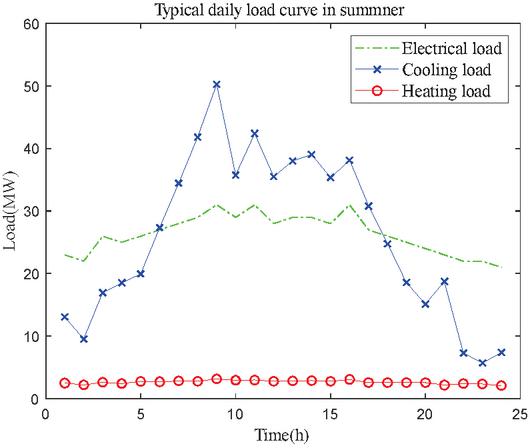
Figure 3 Typical daily load curve in summer.
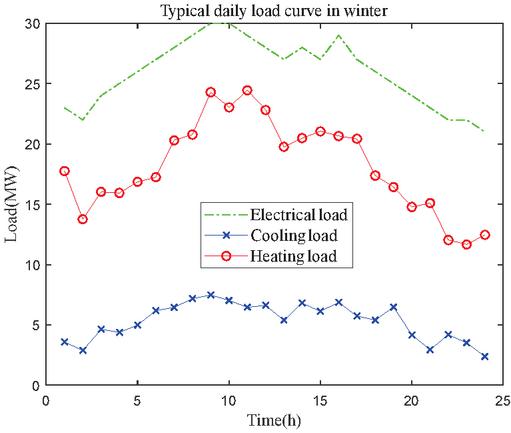
Figure 4 Typical daily load curve in winter.
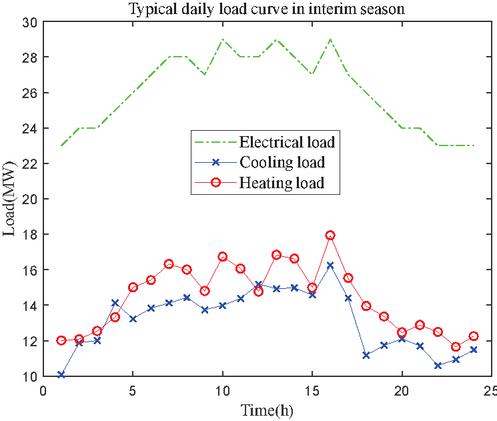
Figure 5 Typical daily load curve in interim season.
According to the analysis of user load types in the industrial zone, the load of the whole zone could be separated into four categories: continuous production, administrative office, living, and commercial operation. The solution of the equipment capacity allocation scheme for the typical representative days of the three seasons divided can take into account the characteristics of the changes in the time scales of the three types of namely, power, heat and cold, and realize multi-energy coupling and complementation of the regional IES in operation to avoid equipment capacity allocation redundant waste.
4.1.2 Technical parameters analysis of energy supply equipment
Considering climate characteristics, as well as resource conditions of the region, the main energy supply equipment primary selection is carried out, including photovoltaic, wind power, combined cooling heating and power (CCHP, specific equipment includes gas turbine, gas boiler, lithium bromide absorption air conditioning unit), electric colding, electric boiler, and energy storage equipment for power storage, thermal/cold storage.
After the preliminary selection of equipment, it is necessary to determine the upper limit and lower limit of equipment configuration capacity (for wind power and photovoltaic, it is necessary to specify the developable capacity accordingly) in combination with the actual installation environment and operating conditions, so as to serve as the constraint conditions for subsequent planning. Here, the calculation of the developable capacity of photovoltaic is taken as an example for illustration.
(1) Calculation of exploitable capacity of PV
According to the amount of solar radiation and sunshine hours received by the region throughout the year, and considering the actual situation, the PV in the zone is installed on building roof, and the roof is horizontal. At present, the types of photovoltaic modules mainly consist of monocrystalline silicon, polycrystalline silicon, amorphous silicon thin film, etc., while distributed photovoltaic modules are mainly monocrystalline silicon modules. The unit area power of PV modules in this paper is 220 Wp/m. One of the significant factors influencing the efficiency of PV output is the installation angle of the PV module array. For the photovoltaic array installed in a fixed form on the horizontal roof, the best inclination angle should be the inclination angle when the photovoltaic system has the maximum annual power generation. The determination of the best inclination angle is mainly based on the longitude and latitude of the installation area and the maximum horizontal solar radiation. The relevant data can be queried through the meteorological data software.
(2) Technical parameters of energy supply and storage equipment
The basic parameters of various energy supply and storage equipment that may be selected in the zone are as following:
Table 1 Equipment technical parameters
| Initial | Operation | |||
| Installation | and Maintenance | |||
| Utilization | Cost | Cost | Service | |
| Equipment | Efficiency | (RMB/kW or | (RMB/kW or | Life |
| Name | Parameters | RMB/kWh) | RMB/kWh) | (Year) |
| Photovoltaic power generation system | Utilization hours: 1500 | 3600 | 50 | 25 |
| Wind turbine | Utilization hours: 1800 | 7500 | 150 | 20 |
| gas turbine | 0.9 | 6000 | 180 | 30 |
| Waste heat boiler | 0.8 | 340 | 10 | 15 |
| Gas boiler | 0.9 | 400 | 12 | 20 |
| CHP | Electric efficiency: 0.33 Thermal efficiency: 0.5 | 4500 | 25 | 15 |
| Absorption refrigerator | Cop 1.8 | 1100 | 33 | 20 |
4.1.3 Power load forecasting
According to the typical load curve data, as well as local principle and development planning, the maximum load growth rate is predicted to range from 15% to 16%. Meanwhile, considering economic development uncertainty, the predicted interval, the prediction of the total social electricity consumption and the maximum load are given in Tables 2 and 3, respectively. Among them, the final scheme of the whole society’s electricity consumption prediction combines the analysis results of the electricity consumption method, the large user method and the annual growth rate method; The maximum load forecast is based on the maximum load utilization hours method and the annual growth rate method.
Table 2 The society electricity consumption forecast results (GWh)
| Year | 2013 | 2016 | 2018 |
| High scheme | 17 | 26 | 34 |
| Medium scheme | 17 | 24 | 30 |
| Low scheme | 17 | 19 | 25 |
Table 3 Maximum load forecast results (MW)
| Year | 2013 | 2016 | 2018 |
| High scheme | 287 | 440 | 586 |
| Medium scheme | 287 | 415 | 531 |
| Low scheme | 287 | 350 | 425 |
According to the elastic coefficient test, the annual high scheme elastic coefficient is around 0.9. In addition, high scheme in the maximum load forecast takes multiple factors such as GDP, unit power utilization and system composition. Hence, the recommendation is the high planning.
The annual maximum load curve and monthly distributed power output of the applicatiob zone could be seen in Table 4. The proportion of distributed power output in each state, corresponding additional reserve capacity cost coefficient corresponding to different scenarios are shown in Table 4.
Table 4 System maximum load and distributed power output
| Month | 1 | 2 | 3 | 4 | 5 | 6 | 7 | 8 | 9 | 10 | 11 | 12 |
| DG output | 17.1 | 18.6 | 21.6 | 25.8 | 18 | 16.2 | 16.5 | 16.8 | 18.3 | 20.1 | 20.1 | 22.5 |
| Maximum load | 201 | 195 | 212 | 228 | 230 | 256 | 287 | 263 | 246 | 250 | 243 | 232 |
4.2 Final Calculation Result
The calculated value of inserve capacity in the recommended plan is 14% of the maximum generating output, which is developed from the typical load curve; Due to multiple factors, a part of units cannot output power at rated capacity, and the capacity that is less generated will be regarded to blocked capacity and deducted from the balance; Because of the production time, operation stability and large load occurrence time of the newly put into operation in the current year, the new unit cannot completely realize its function at present, half the capacity of the unit put into operation at present is included in the balance. The power balance results could be seen in Table 5. The three scenes correspond to typical daily load curves for summer, winter, and interim seasons. The three state indicate different configuration of Proportion of distributed energy, probability, and additional spare capacity cost factor.
Table 5 Equipment technical parameters
| Proportion of | Additional | |||
| Distributed | Spare Capacity | |||
| Scene | State | Energy | Probability | Cost Factor |
| Scene 1: summer | 1 | 0 | 0.16 | 0 |
| 2 | 5–10 | 0.76 | 42 | |
| 3 | 10 | 0.08 | 58 | |
| Scene 2: winter | 1 | 0 | 0.19 | 0 |
| 2 | 5–10 | 0.73 | 42 | |
| 3 | 10 | 0.08 | 58 | |
| Scene 3: interim season | 1 | 0 | 0.22 | 0 |
| 2 | 5–10 | 0.7 | 42 | |
| 3 | 10 | 0.08 | 58 |
Table 6 Investment and operation costs of DG
| Total | Unit | Operation | ||
| Unit | Investment | Operation | and Maintenance Cost | |
| Capacity | Investment | (10 Thousand | and Maintenance | (10 Thousand |
| (kW) | (RMB/kW) | RMB/kW) | Cost (RMB/kWh) | RMB) |
| 20 000 | 8 000 | 16 000 | 0.3 | 1314 |
Table 7 The Saving investment cost of thermal power
| Unit | Replaced | Replaced | Save | |
| Investment | Utilization | Electricity | Capacity | Investment |
| (RMB/kW) | Hours | (MWh) | (MW) | (10 Thousand RMB) |
| 3 900 | 4 000 | 43 800 | 10.95 | 42 710.5 |
For specific explanation, according to the non dominated Pareto frontier solution set obtained by the NSGA – II algorithm, the two solutions with the lowest cost and the greatest environmental benefit are set as Scheme A and Scheme B. Since the calculation process of Scheme A and Scheme B is similar, Scheme B calculation process table is presented below. The DG investment and operation and maintenance costs of Scheme B could be seen in Table 6. From the data in Table 6, it can be found that the unit DG investment and operating costs have decreased. Investment cost of saved thermal power capacity is shown in Table 7. The environmental protection and power conservation benefits after connecting to DG are shown in Tables 8 and 9, and the additional standby costs could be found in Table 10. Final computing results could be seen in Table 11.
Table 8 Energy efficiency for access to DG
| Fuel | ||||||
| Rated | Capacity | Green | Typical | Standard | Coal | Saving |
| Capacity | Factor | Power | Standard Coal | Coal Price | Saving | (10 Thousand |
| (MW) | (%) | (MWh) | Rate (g/kWh) | (RMB/ton) | (Ton) | RMB) |
| 20 | 25 | 43800 | 320 | 400 | 14016 | 5606.4 |
Table 9 Environmental benefits for access to DG
| Item | SO2 | NOX | CO2 |
| Pollutant gas emission (g/kWh) | 6.31 | 2.88 | 623 |
| Environmental value standard (RMB/kg) | 6.2 | 8 | 0.23 |
| Environmental benefit | 178.4.7 | 100.9 | 627.6 |
| Total environmental benefits (10 thousand RMB) | 910.2 | ||
Table 10 Additional spare cost for access to DG
| Proportion | Additional | |||||
| of Power | Input-grid | Standby Costs | ||||
| Generation in the | Power | (10 Thousand | ||||
| Scene | Whole Year (%) | (MW) | State 3 | State 2 | State 1 | RMB) |
| 1 | 13.9 | 6088.2 | 579.8 | 5508.4 | 0 | 26.5 |
| 2 | 39.7 | 17388.6 | 1717.4 | 15671.2 | 0 | 75.8 |
| 3 | 46.3 | 20279.4 | 2079.9 | 18199.5 | 0 | 88.5 |
Table 11 Calculation results of each decision objective (10 thousand RMB)
| Distribution | Energy | |||||
| Network | DG | Conservation | ||||
| Investment | Investment | and | ||||
| and | and | Additional | Environmental | Comprehensive | ||
| Operation | Operation | Standby | Protection | Cost | ||
| Plan | Scene | Cost | Cost | Costs | Benefits | Target |
| A | 1 | 230.4 | 17182.6 | 23.8 | 9708 | 7876 |
| 2 | 68.2 | |||||
| 3 | 79.7 | |||||
| B | 1 | 383.4 | 17314 | 26.5 | 10787 | 7101 |
| 2 | 75.8 | |||||
| 3 | 88.5 |
According to Table 11, although the investment and operation cost of the distribution network in Scheme A is much lower than that in Scheme B, because of the large amount of wind power on the grid in Scheme B, the lower comprehensive cost of Scheme B is more conducive to the maximization of social benefits. Total cost from Scheme A is 78.76 million RMB, of which Scheme B is 71.01 million RMB.
5 Conclusion
In this paper, the decision-making model of low voltage network planning taking into account distributed generation is established from four aspects: investment and operation cost, additional reserve capacity, power saving and environmental protection benefits, as well as the reliability cost. Among them, the investment and operation costs of low voltage power grid and distributed power generation are considered in the investment and operation costs, and economic benefits saving fossil energy costs and reducing pollution are considered in the environmental protection as well as power saving. The reliability costs are mainly calculated according to the importance of different users. The decision model involves a lot of parameter calculation and selection judgment, so a automatic decision framework based on DS-MAS is established with limited goals, which means that the selection parameters are automatically calculated to facing various scenarios. In the end, the decision-making model effectiveness is proved via a regional actual network decision-making project.
Acknowledgments
This work is supported by Economic and Technological Research Institute of State Grid Hebei Electric Power Co., LTD., Shijiazhuang 050000, China.
References
[1] Xiangyu Kong, Zhengtao Wang, Chao Liu, et al. Refined peak shaving potential assessment and differentiated decision-making method for user load in virtual power plants[J]. Applied Energy, Volume 334, 15 March 2023, 120609.
[2] Xiangyu Kong, Xu Zhao, Chengshan Wang, et al. Promote the international development of Energy Internet technology standards based on key competition mode [J]. Sustainable Cities and Society, Vol. 86, November 2022, 104151.
[3] Lv Jiawei, Zhang Shenxi, Cheng Haozhong, et al. Overview of regional comprehensive energy system planning considering interconnection and interaction [J]. China Journal of Electrical Engineering, 2021, 41(12): 4001–4020.
[4] Cheng Haozhong, Hu Xiao, Wang Li, et al. Overview of regional comprehensive energy system planning [J]. Power System Automation, 2019, 43(7): 2–13.
Hao H, Corbin C D, Kalsi K, et al. Transactive control of commercial buildings for demand response[J]. IEEE Transactions on Power Systems, 2017, 32(1): 774–783.
[5] Xiangyu Kong, Xiaopeng Zhang, Xuanyong Zhang, et al. Adaptive Dynamic State Estimation of Distribution Network Based on Interacting Multiple Model [J]. IEEE Transactions on Sustainable Energy, 2022, 13(2): 643–652.
[6] Yao Zhili, Wang Zhixin. Two-level collaborative optimization configuration method of integrated energy system taking into account the uncertainty of wind and wind [J]. Grid Technology, 2020, 44(12): 4521–4529.
[7] Zheng Haiyan, Zou Lei, Yang Bin, et al. Three-level collaborative planning and design method of integrated energy system in the park with energy storage device [J]. Science and Technology and Engineering, 2021, 21(7): 2705–2712.
[8] Chen Xi, Cao Jie, Sheng Yong, et al. Research on optimal allocation of capacity of integrated energy system of natural gas storage based on cuckoo search algorithm [J]. Journal of Chongqing University of Technology (Natural Science), 2021, 35(06): 2009–219.
[9] Zhang Hong, Cao Yang, Shan Fuzhou, et al. Multi-regional integrated energy system capacity allocation considering wind power scenario reduction [J]. Renewable Energy, 2020, 38(1): 128–135.
[10] Cao Yan, Mu Yunfei, Jia Hongjie, et al. Multi-stage planning of comprehensive energy system in the park considering construction timing [J]. Journal of China Electrical Engineering, 2020, 40(21): 6815–6827.
[11] Sun Weijia, Wang Qi, Tang Yi, et al. Alternative configuration scheme of integrated energy system considering gas thermal inertia [J]. Power System Automation, 2021, 45(15): 11–20.
[12] Gao Pengfei, Zhou Xiaoxin, Yang Xiaoyu, et al. Capacity planning of electricity-gas equipment in the electricity-gas integrated energy system considering hydrogen injection [J]. Grid Technology, 2021, 45(10): 3781–3791.
[13] Hou Jianmin, Lu Xinmei, Zhou Ying, et al. Optimal allocation of integrated energy system capacity considering flexible electrical load and thermal load [J]. Modern Power, 2021, 38(04): 412–426.
[14] Zhang Ziyang, Zhang Niepeng, Wang Manshang, et al. Research on the comprehensive energy system optimization planning model for the high proportion of renewable energy consumption [J]. Renewable Energy, 2020, 38(8): 1085–1091.
Biographies
Han Jinglin was born in Hebei, China, in 1989. He studied in Huazhong University of Science and Technology from 2008 to 2015, and received his bachelor’s degree and master’s degree in 2012 and 2015 respectively. From 2015 to present, he works in State Grid Hebei Economic Research Institute. His research interests are included Distribution network planning, Micro-grid dispatching operation etc.
Hu Ping was born in Hebei, China, in 1968. From 1985 to 1987, he studied in Chongqing University and received his bachelor’s degree in 1987. From 1988 to present, he works in State Grid Hebei Electric Power Company. In 2006, he received his master’s degree from North China Electric Power University. His research interests are included power grid planning, power grid stability analysis and typical power supply mode of distribution network. He has obtained one innovation achievement in power industry management, two achievements in state grid corporation management, and one third prize in scientific and technological progress of state grid corporation.
Zhao Hui was born in Hebei, China, in 1983. He graduated from School of Electrical and Electronic Engineering, North China Electric Power University, majoring in power system and automation, and obtained his master’s degree in 2019. His main research interests are power system, load forecasting, power market, etc. Currently, he works in State Grid Hebei Electric Power Company, engaged in distribution network planning.
He Chunguang was born in Hebei, China, in 1979. From 1997 to 2001, he studied in Xi’an University of Technology and received his bachelor’s degree in 2001. From 2002 to 2005, he studied in Xi’an Jiaotong University and received his master’s degree in 2005. From 2005 to 2012, he worked for State Grid Hebei Electric Power Research Institute, engaged in power grid planning and power grid analysis. Currently, he works in State Grid Hebei Economic Research Institute, engages in power grid planning. In the past three years, he has published five journal papers, applied for seven patents (six invention patents), and won a lot of awards such as scientific and technological innovation of network and provincial companies.

Hou Ruosong was born in Hebei, China, in 1995. He studied in Tianjin University from 2014 to 2021, and received his bachelor’s degree and master’s degree in 2018 and 2021 respectively. Currently, he works in State Grid Hebei Economic Research Institute, his research interests are included Micro-grid optimization planning, Energy management and Distribution network planning, etc.

Li Bo works for State Grid Hebei Electric Power Company. He graduated from Northeast Electric Power University majoring in Electrical Engineering and Automation. Graduate degree. Bachelor of Engineering, Assistant Engineer. He has been engaged in the management of electric power enterprises for a long time. His research interests include new energy development, power grid planning and enterprise management.
Distributed Generation & Alternative Energy Journal, Vol. 38_5, 1677–1706.
doi: 10.13052/dgaej2156-3306.38514
© 2023 River Publishers