Optimization Method of Charging Station Layout Based on Internet of Things Under the Background of Sustainable Development
Yingjun He*, Shenzhang Li, Hexiong Chen, Xiu Liu, Lin Wang and Shaolong Li
Information Center of Yunnan Power Grid Co., Ltd. Kuming 650000, Yunan, China
E-mail: yingjun_vip@163.com
*Corresponding Author
Received 21 May 2022; Accepted 15 July 2022; Publication 16 May 2023
Abstract
In the context of sustainable development, the research on the optimization method of charging station layout based on the Internet of things can effectively shorten the distance between the charging demand point and the charging station candidate point. Based on the perception of the charging status of the electric station and the transmission layer of the RFID, the charging system is designed to collect and store the relevant information from the charging system of the electric station in real time according to the charging status of the electric station and the transmission layer of the RFID. Based on the above information, taking the minimum distance from the user to the charging station, the expected waiting time and the construction cost as the objective function, all demand points are allocated to the corresponding charging station, charging can be provided to users only by building a charging station at the candidate point, and users at all demand points can only enjoy charging services at a specific charging station as the constraint. The optimization model of charging station layout is constructed and solved by genetic algorithm to obtain the best charging station layout. The experimental results show that the layout scale of electric vehicle charging stations based on this method has the advantages of global optimization, strongest adaptability and good economic benefits, and the increase in the number of charging stations can effectively improve user satisfaction.
Keywords: Sustainable development, internet of things, charging station, layout optimization, RFID system, genetic algorithm.
1 Introduction
Sustainable development is one of the basic requirements of the scientific outlook on development. It is a theory and strategy on the coordinated development of nature, science and technology, economy and society. The main idea is: development that can meet the needs of contemporary people without endangering the ability of future generations to meet their needs [1, 2].
With the increasing depletion of oil resources and the aggravation of environmental pollution, all countries are facing a more serious energy and environmental crisis. Energy consumption is among the most crucial characteristics of any desalination system. Studying various input characteristics and figuring out how they affect energy use would be crucial to improving this. In this study, the impacts of various operational and geometrical characteristics are examined using a one-dimensional model [3–6]. Actively developing electric vehicles can accelerate fuel substitution and reduce exhaust emissions, which is of great significance to ensure energy security, promote energy conservation and emission reduction, and prevent and control air pollution [7]. However, electric vehicles face many obstacles in the development process, especially the lack of charging facilities, which seriously restricts the promotion of electric vehicles. One of the most important concerns for those considering electric vehicles is poor infrastructure. Poor infrastructure includes not just a lack of supercharger stations but also an improper setup for charging in the house. The main advantage of electric vehicles is the improvement in air quality they may bring to urban areas. Pure electric vehicles emit no carbon dioxide when driving since they have no exhaust. As a result, air quality is greatly decreased. Chen Zhen et al. designed the optimization scheme of charging pile layout based on the multi-factor constrained P median model [8], and Hu Jigui et al. proposed the optimization scheme of charging station layout based on the energy storage tram [9], but they are not perfect in information collection. Considering the high construction cost of the charging station, how to improve its layout efficiency under the constraints of limited financial budget is particularly important. Taking this as the starting point, this paper studies the layout optimization method of electric vehicle charging station. Even though certain of its fundamental ideas were developed about a century ago, layout or topological improvement is among the biggest and fastest growing topics of architectural engineering. It focuses with choosing the ideal arrangement for building structures. A molecular dynamics model was used to study the hydrodynamic and thermal properties of liquid medium in the form of covalent bond materials (graphene nanoparticles and carbon nanotubes). The findings showed that the thermal conductance as well as phase transition duration increased from 0.68 W/m.K. and 1.29 N with increased preliminary t [10].
The Internet of things (IOT) is a network that connects any object with the Internet through information sensing equipment such as radio frequency identification (RFID), infrared sensor, global positioning system, laser scanner and gas sensor according to the agreed protocol for information exchange and communication, so as to realize intelligent identification, positioning, tracking, monitoring and management. The technical advantages of the IOT in the scheduling, monitoring, metering, billing and asset management of charging facilities provide a new idea for the information construction of electric vehicle charging facilities [11]. So as to design and build electric vehicle charging facilities with higher specifications and higher technology level from a higher starting point, and finally, realize the reasonable layout of charging stations and the orderly scheduling of charging facilities and resources, to meet the orderly charging of electric vehicles, and build a harmonious and civilized intelligent transportation. Charging stations or piles can transform grid power into forms of electricity that can be used to recharge electric cars. There are typically two charging options offered by charging piles: slow charging and quick charging. Electric vehicle charging piles are anchored to the surface and use a unique connecting protocol and conductivity method to supply AC electricity to electric cars with on-board converters. They provide appropriate recharging, transmission, and security duties. As a kind of charging facilities, electric vehicle charging station is usually equipped with a certain number of AC charging piles and DC chargers, which can provide emergency charging services for various types of electric vehicles at the same time. Through the charging station, all kinds of data and information are fully collected to realize the monitoring, dispatching, metering and billing, asset management, etc. of charging facilities. The IOT applies the new generation of IT technology to the electric vehicle charging facilities. Through the RFID system, the operation status of the electric vehicle, the use status of the power battery, the working status of the charging equipment and the operation of the auxiliary equipment of the charging facilities can be sensed in real time [12]. It is easy to realize the comprehensive coverage of the collection points. Moreover, the investment of the IOT is relatively low and the topology of the communication network is clear, so the collected data is relatively complete.
The distance betwixt the recharging supply point as well as the rechargeable battery applicant station may be successfully reduced according to study on the optimization technique of switching power architecture connected via the Internet of Things. The recharging structure is implemented to gather and retain the pertinent tracking data depending on how the electrical terminal perceives its charging state as well as the RFID transmission layer. The study demonstrates the advantage of global optimization and strong financial benefits in the design size of electric car charging stations depending on this technology.
2 Optimization of Charging Station Layout Based on IOT
2.1 Information Collection Design of Charging Station
The IOT architecture of charging station is designed based on multi angles, the charging station information system is improved, and the condition monitoring process of charging station is standardized. The charging station IOT architecture mainly includes three levels: perception, network and application. The perception level mainly includes multiple devices with identification and collection functions, which can realize the collection of various information of the charging station; The network layer is the core content of the IOT. Its main function is to transmit, manage [13], integrate and store the signal information from the perception level. The impact of temperature creep on gas heat transfer characteristics in a nanofluid during gaseous operating temperatures is numerically analyzed in this study. According to the findings, thermally creep increases when the wall temperature drops compared towards the incoming temperature difference [14]. The tube has been further penetrated by thermally creep impacts as Knudsen number has increased. The main function of the application layer is to realize the application requirements with the help of the IOT and the intelligence of professional technology. The IOT architecture of charging station is shown in Figure 1.
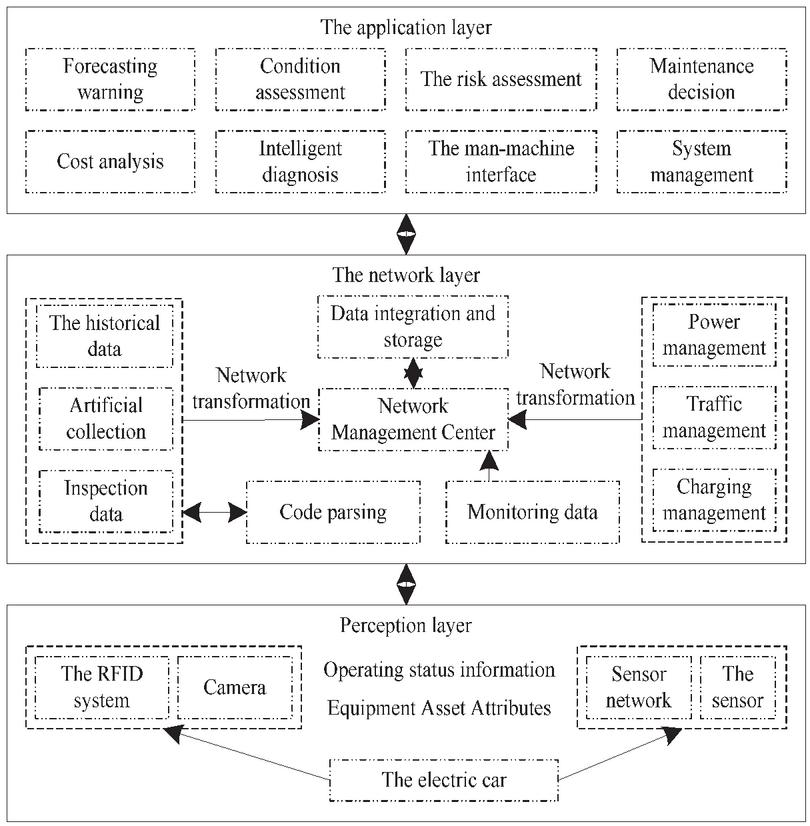
Figure 1 IOT architecture of charging station.
Through the RFID system of the sensing layer, the operation of electric vehicles in the charging station, the remaining battery power, the operation of the charging station and the operation status of auxiliary facilities can be sensed in real time [15]. RFID system is mainly divided into three parts: electronic tag, reader and antenna. RFID electronic tag is composed of chip and combined coupling components, and there is only one tag; RFID reader can carry out data exchange such as electronic tag information reading and input; The antenna is responsible for transmitting RF information between the electronic tag and the reader.
A radio frequency identification tagging, sometimes known as an RFID tag, is a type of identifying device used for surveillance and identifier purposes. The tag has digital storage for data. The development of other generations of electric-powered cars will involve the use of RFID tags. Some OEM providers are expected to include RFID-compatible labeling on the parts they deliver, particularly when building prototypes. This is certainly relevant for RFID labelling on original equipment parts for automobiles. RFID system uses the reader to encode the charging station information to be transmitted, and then loads it into the carrier signal of a certain frequency band. When the electronic tag is surrounded by the magnetic field of the reader, it obtains the RF transmission information from the reader. At the same time, it transmits the electronic tag information to the reader through the energy obtained by electromagnetic induction. The encrypted electronic tag decodes and decrypts RF transmission information, determines whether the reading of request [16], password and other information is illegal, and sends information if not.
An electronic label is pasted on the upper right corner of the front glass of the electric vehicle. Retailers utilize an electronically shelf label (ESL) technology to show consumer prices on shelves. Every time a price is altered under the management of a central server, the actual product is regularly generated. Interactive smart components are frequently fastened to the leading edge of store shelves. When the vehicle passes the charging station, the reader can actively judge the type of electric vehicle, upload the monitoring and analysis results of all electric vehicles through the sensor network in the charging station, so as to complete the relevant measurement of vehicle flow and speed [17], and lay the foundation for the layout, type selection and road optimization of the charging station. When an electronic tag is installed in the car battery, the remaining battery of the car can be perceived by the reader when the car enters the charging station. The charging station uploads the vehicles to be charged and the remaining charging positions, feeds them back to the dispatching center through the IOT, and provides users with the route to the nearest charging station through the coordination of the dispatching center.
The application of the RFID system can effectively filter the common problems such as repeated entry, missing inspection and missing recording, so as to make the management of charging station more intelligent and reliable. When the charging station is arranged, the staff can judge the specific layout by reading the RFID tag information of the charging station [18]. In the process of electric vehicle flow management, the remaining battery power can be predicted by condition monitoring.
When the electric vehicle runs to a certain time t, the remaining battery power of the vehicle that needs to be charged at present can be predicted according to the monitored vehicle operation status and historical situation [19]. The historical situation can be the status data, replacement time data and the combination of the two obtained from the monitoring of the driving charging process of similar vehicles. The remaining power of electric vehicle is expressed as:
| (1) |
Where, describes the random variable of charging time, describes the current time, and vector represents the current state data.
Formula (1) can be extended to obtain:
| (2) |
Where,
vector – state data monitored by the charging station at time ,
vector – charging time data of the charging station,
, , – the time when the battery is damaged.
The prediction of remaining electric quantity of electric vehicle battery in charging station refers to the distribution and expectation of prediction variable , namely:
| (3) |
2.2 Layout Optimization Model of Multi-objective Charging Station
2.2.1 Basic assumptions
Electric automobiles, neighborhood alternative fuels, and plug-in hybrids may all be recharged at a charging stations terminal, which is a piece of technology. Based on the reality simplified model, the following assumptions are put forward:
(1) The charging station is located in a small area centered on residents, and the demand is all electric vehicles that need to be charged in the area;
(2) The arrival rate of all charging station users meets the specified distribution, and the residual electric energy from electric vehicles to charging stations also meets the normal distribution [20];
(3) All charging stations are of the same construction level;
(4) The types of vehicles and batteries are the same;
(5) Regardless of road conditions, electric vehicles maintain a constant speed, and the remaining battery power has a linear relationship with the driving distance, which refers to the urban distance [21];
(6) Ignoring customer preferences, the principle of selecting charging stations is the principle of proximity.
2.2.2 Objective function
Let and represent the set and quantity of demand points respectively, and represent the set and quantity of candidate points of charging station respectively, and the demand points and candidate points are and respectively, and and . and are decision variables. If is charged at , is 1, otherwise it is 0. If a charging station is built at , is 1, otherwise it is 0.
The expense of controlling the power, as well as V2G technologies, are included in the multi-objective optimization process in these terminals. The expenses associated with charging and discharging, temperature, as well as networking inefficiencies were the situation’s target variables. The objective function of the layout optimization model of multi-objective charging station is as follows:
(1) The distance from the user to the charging station is the minimum.
| (4) |
Where and respectively represent the number of users who need to be charged at position and the distance from .
(2) Minimum expected waiting time It can make the time interval for all vehicles to arrive at the charging station meet , and the number of charging stations to arrive at a certain time is:
| (5) |
The remaining power for the car to reach the charging station is , and the charging time of the electric car is:
| (6) |
Where and respectively represent the maximum driving distance and charging rate when the battery is fully charged.
Generally, a charging station has more than three charging piles. There are generally two queuing modes for this charging station: single queue and multi queue. Due to the large volume of electric vehicles and difficult to move in the charging station, the charging queuing mode of electric vehicles is similar to the queuing mode of automobile gas stations, that is, multi queue queuing mode. Auto LPG is healthier and completely free of Lead and Benzene. It also produces no deposit. The motor has far less carbon build-up, and lubricating oil lasts longer without deteriorating. In order to decrease client, wait times and improve the amount of clients that can be serviced, a firm can employ queuing model to create more effective methods, procedures, cost structure, administrative support, and arriving methods of management.
Assuming that charging piles are established in each charging station, when the number of electric vehicles waiting for charging in a charging station is less than or equal to , the waiting time is 0; When the number of electric vehicles arriving at the charging station is greater than , the queuing waiting time is equal to the total charging time of all vehicles in the queue selected after their arrival [18].
Suppose that the charging time of the -th vehicle in the queue is represented by , and the waiting time of the -th vehicle is represented by . Then, the charging time of the first vehicle is and the waiting time is ; The charging time of the second vehicle is and the waiting time is ; The charging time of the third vehicle is and the waiting time is ; By analogy, the charging time of the -th vehicle is and the waiting time is .
For all candidate charging stations, the minimum expected waiting time is expressed as:
| (7) |
Where is the sum of the waiting time of users in .
(3) Minimum construction cost. The smaller the value of the objective function is, the higher the user satisfaction is. In order to realize the layout of charging stations under the background of sustainable development [22], the construction of charging stations needs to be limited. The average construction cost of the charging station is:
| (8) |
Where, , , and respectively represent the number of charging piles at position , the cost of constructing charging piles, the depreciation life and the discount rate.
2.2.3 Constraints
(1) The built charging station can realize the charging service of all demand points, that is, all demand points are allocated to the corresponding charging station:
| (9) |
(2) Charging can be provided to users only by building a charging station at location :
| (10) |
(3) Users at all demand points can only enjoy charging services at specific charging stations [17]:
| (11) |
(4) decision variables are expressed as:
| (12) |
2.3 Genetic Algorithm Used to Solve the Layout Optimization Model of Charging Station
A collection of classification algorithms utilized in numerous criterion decision-making, the optimal control issue (sometimes referred as multi-objective programming problem), concerns with performance prediction where two or more objective functions must be optimized continuously. According to the above objective functions and constraints, the layout optimization model of charging station is constructed. Because the layout optimization model is a multi-objective nonlinear combinatorial optimization problem, the solution algorithm is required to be efficient and have certain fault tolerance and global optimization ability, so the genetic algorithm is selected for solution. Genetic algorithm is not only an optimization method developed by imitating the biological evolution process in nature, but also a computational model [23]. The genetic algorithm, which is derived from natural selecting, the mechanism that propels organic development, is a technique for resolving both limited and uncontrolled scalability issue. A community of customized services is continuously modified by the optimizer. They are frequently employed to produce excellent answers to optimizing and search-related issues. Natural selection is simulated by evolutionary algorithms, which implies that only those organisms that can respond to changes in environmental conditions will be capable of living, procreate, and pass onto another era. It searches for the optimal solution by simulating the biological evolution process of Darwin’s genetic selection and natural elimination. Favorable features are passed down across generations as a result of natural processes. Natural selection may result in differentiation, the process by which one creature offers ascent to another that is utterly separate. It is one of the mechanisms that accelerates development and contributes to the understanding of the variety of life on Land. Therefore, evolutionary biology enables us to understand not only how and why species have evolved into the forms they have, as well as the mechanisms that are constantly modifying or changing them. A characteristic of development that is becoming more and more crucial in terms of the academic contribution to societal challenges is the ability to adapt to changing. The Genetic algorithm transforms the possible solution of the coding problem into chromosomes, calculates its fitness value according to the fitness function, selects the chromosomes with high fitness value according to the principle of “survival of the fittest”, generates new species through selection, crossover and mutation, continues to calculate the fitness value repeatedly, and decodes it after obtaining the optimal chromosome. It implied that creatures with the highest environmental adaptation have the greatest chance of surviving and procreating. This is an example of “survival of the fittest” or the adaption of creatures that are in some other manner more adapted towards the context. There are red beetles and green beetles in an ecosystem. Because red bugs taste better to birds, there will eventually be more green than red bugs. The steps of genetic algorithm to solve the layout optimization problem of charging station are as follows:
(1) The encoding method is real number encoding, which is encoded through the path node;
(2) Global variable definition. Global variables are those that have been created beyond the specified function. These are not restricted to a specific feature; therefore, any available component can be used to acquire and alter default values. Let the population size be 80, the number of iterations be 100, the mutation probability be 0.2, the crossover probability be 0.9, and the number of nodes be 134;
(3) The coding may be solved into chromosomes and the initial population is randomly generated;
(4) The individual fitness value is calculated according to the fitness function. The fitness function is: the number of nodes is set to n, the two adjacent nodes are represented as demand point i and candidate point j, the distance between them is described as , the driving speed of the vehicle on the charging station path ij is expressed as , and the decision variables and respectively represent driving from path ij and not from path ij. And it can get:
| (13) |
(5) A player has the option to wager on a single data point, a sequence of integers, or neighboring numbers. Including other things, a player can also select colors or odd or even integers. The 0 and 00 are included in the 35 to 1 payout for a single number wager. wagers that pay 1 to 1 or maybe even payment on red or black, odd or even, or both. Operate according to roulette rules:
| (14) |
(6) Cross;
(7) Variation;
(8) Change the population, deal with the individual feasibility, and record the current optimal fitness value;
(9) Change the worst individual according to 10% probability to prevent the population from moving to the worst;
(10) Judge whether the traversal is over and get the optimal layout of charging station;
(11) Input each node vehicle, maximum vehicle capacity, vehicle density, etc., calculate the charging speed and output the charging time.
The flow chart of the genetic algorithm for solving the optimal layout of charging station is shown in Figure 2.
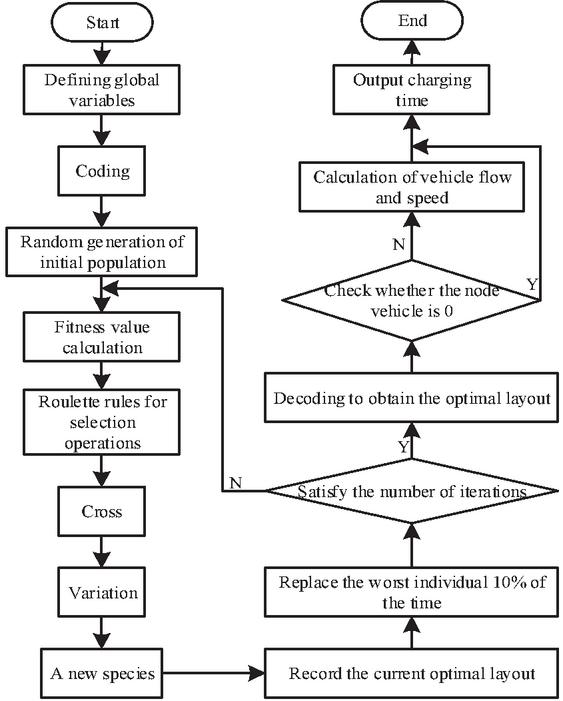
Figure 2 Flow chart of genetic algorithm.
3 Experimental Analysis
In order to verify the effectiveness of the method in this paper, experiments with multiple demand points and candidate points are designed in an interval. All demand points are generated arbitrarily in the plane of [0,30] [0,30], there are 30 demand points and 9 candidate points for charging station construction. The time interval between electric vehicles arriving at the charging station is made to meet the uniform distribution of [10,30] minutes, and the remaining power of electric vehicles arriving at the charging station meet the normal distribution.
The performance parameters of the electric vehicle selected for application are: the endurance mileage is 500 km, the charging pile is fully charged in 25 minutes, the 100 km consumption is 21.5 kW h, the charging cost is 1 yuan/kW, the time consumption cost is 10 yuan/h, the depreciation life of the charging station is , the discount rate is , the crossover rate and mutation rate in the genetic algorithm are 0.85 and 0.45 respectively, and the breeding number of generation is 300.
To sum up, all arbitrarily formed data have corresponding satisfactory solutions. The larger the number and mode of charging stations are, the higher the corresponding user satisfaction and the corresponding construction cost are. The user satisfaction cost is compared with the construction cost to obtain the corresponding satisfactory solution of the minimum total cost. The number of electric vehicle charging stations is 4. The construction location and service scope of charging stations are shown in Table 1 and Figure 3.
Table 1 Charging station construction location and service scope
| Location of Charging Station Construction | Demand Point Allocation |
| 3 | 3,4,5,9,13,15,19,21,22,23,24 |
| 5 | 1,5,10,12,27,31 |
| 7 | 6,7,8,11,17,18,21,26,29 |
| 9 | 4,20,21,22 |
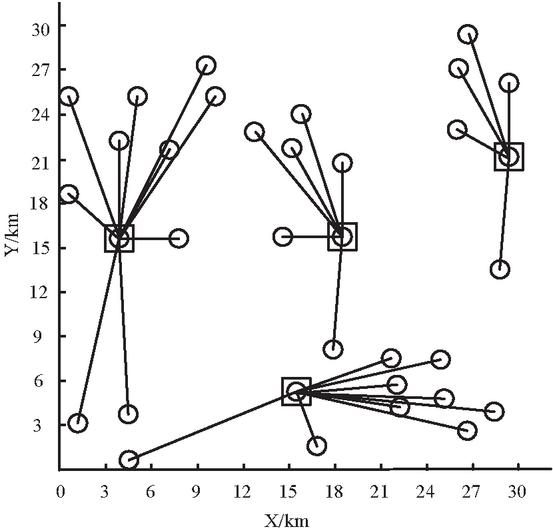
Figure 3 Charging station construction location and service scope.
The total cost under the influence of the number of charging stations is analyzed, so that all charging stations have the same construction scale, the charging pile is fully charged after 25 minutes, and the given number of differential charging stations is used to obtain the four differential cost values of distance, waiting time, station construction and overall. The results are shown in Figure 4.
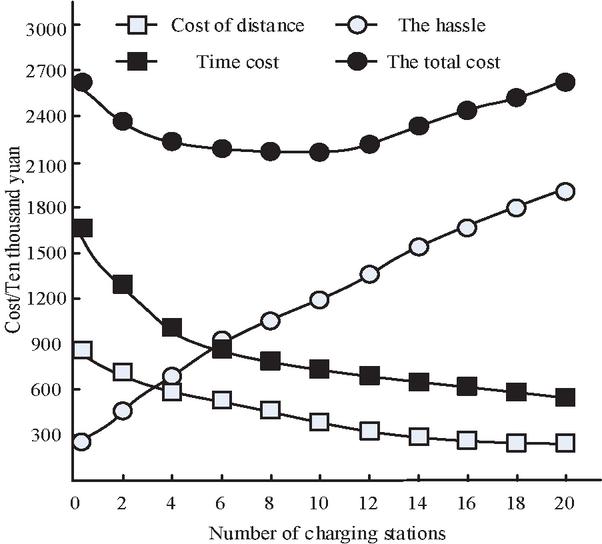
Figure 4 Influence of number of charging stations on cost.
It can be seen from Figure 4 that with the increase in the number of charging stations, users can choose charging stations close to themselves for charging, the number of service users of a single charging station is reduced, the distance and time cost are in a downward trend, and the user satisfaction is improved; However, the increase in the number of charging stations will lead to the continuous growth of station construction cost; The total cost decreases firstly and then increases. To sum up, the increase in the number of charging stations improves user satisfaction. Comparing the user satisfaction cost with the station construction cost can obtain the lowest point of the total cost, that is, to obtain the satisfactory solution of the number of charging stations.
A total of 50 fast charging posts are set in the charging station to provide charging services for users. The method in this paper is used to plan the path for users and provide the remaining charging positions. The results are shown in Table 2.
Table 2 Results of method planning in this paper
| Moment | Remaining Charging Position/Unit | Travel Time/s |
| 2:00 | 49 | 28 |
| 4:00 | 50 | 17 |
| 5:00 | 35 | 52 |
| 8:00 | 12 | 72 |
| 10:00 | 19 | 165 |
| 12:00 | 8 | 87 |
| 14:00 | 10 | 79 |
| 16:00 | 22 | 63 |
| 18:00 | 6 | 92 |
| 20:00 | 43 | 41 |
It can be seen from Table 2 that the charging station after the application of the method in this paper can provide users with the planned optimal charging path, reasonably allocate the remaining charging bits to each user, prevent users from waiting too long, and the maximum time for users to drive to the charging bits is no more than 100s, indicating that this method has good planning results.
To make real time monitoring of the remaining electricity quantity of electric vehicles in the charging station, the comparison between the measured value of the remaining electricity quantity and the actual value is shown in Figure 5.

Figure 5 Comparison between actual monitoring results and those in this paper.
It can be seen from Figure 5 that the real-time residual power monitoring results of electric vehicles in the method of this paper are highly in line with the current situation. Comparing the monitoring values of different electric vehicles with the actual values, it is found that the residual power measurement error of electric vehicles is always maintained within 0.5 mm. It proves the accuracy of this method in the real-time monitoring of electric vehicle residual power, ensures the accuracy of electric vehicle residual power monitoring, and has high accuracy.
Referring to the two methods of reference [7] (layout optimization of multi-factor constrained charging pile) and [8] (layout optimization of energy storage charging station), the experiment in this paper compares the layout time under the influence of the number of routes of charging station layout in the process of charging station layout optimization by the three methods. The results are described in Figure 6. As can be seen from the figure, with the continuous increase of the number of charging station layout routes, the layout time of the three methods has increased to varying degrees, but the layout time of the method in this paper is always the lowest and is less affected by the increase of the number of layout routes.
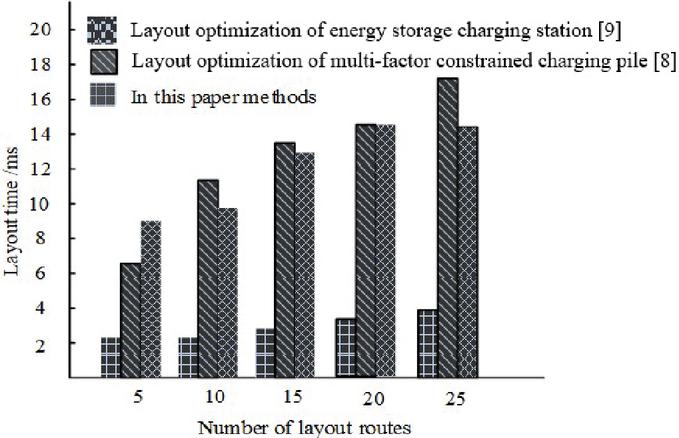
Figure 6 Influence of route number on layout time.
To analyze the data in the above experimental process and compare the layout optimization performance of the three methods, the results are shown in Table 3.
Table 3 Layout optimization performance comparison of different methods
| Predictive Performance | In this Paper Methods | Layout Optimization of Multi-factor Constrained Charging Pile [8] | Layout Optimization of Energy Storage Charging Station [9] |
| MSE means square error | 0.000915 | 0.0010256 | 0.0012643 |
| Absolute mean error of MAE | 0.020103 | 0.021561 | 0.022513 |
Comparing the layout optimization performance of the three methods, it is found that the MSE and MAE of the method in this paper are less than those of the other two methods, which proves that the layout optimization performance of this method is better.
The three methods are used to test the convergence performance in solving the layout optimization problem of charging station, and the objective function convergence curves of the three methods are described in Figure 7.
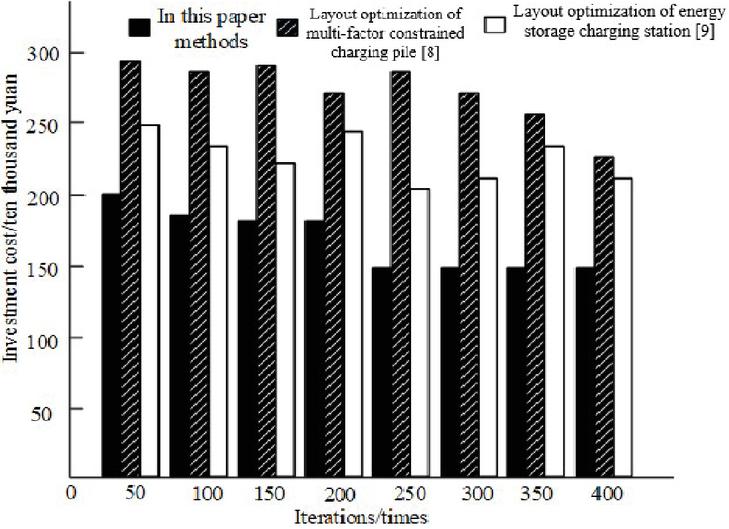
Figure 7 The convergence.
It can be seen from Figure 7 that the method in this paper has significantly higher global convergence performance and faster convergence speed than the other two methods. The average investment cost of the construction of charging station layout optimization by the method in this paper is 1.7 million yuan, which is 2.3 million yuan and 550000 yuan less than the average investment cost of the construction of charging station by the methods in reference [7] and reference [8], respectively. It can effectively solve the objective function of charging station layout optimization. The construction cost of charging station is low and meets the construction investment standard of charging station of the project.
In order to verify the effectiveness of the method in this paper and compare the power satisfaction and time satisfaction of the charging station layout optimization path after the application of the method in this paper, 10 random paths are selected for calculation in the experiment, and the calculation results are shown in Figure 8.
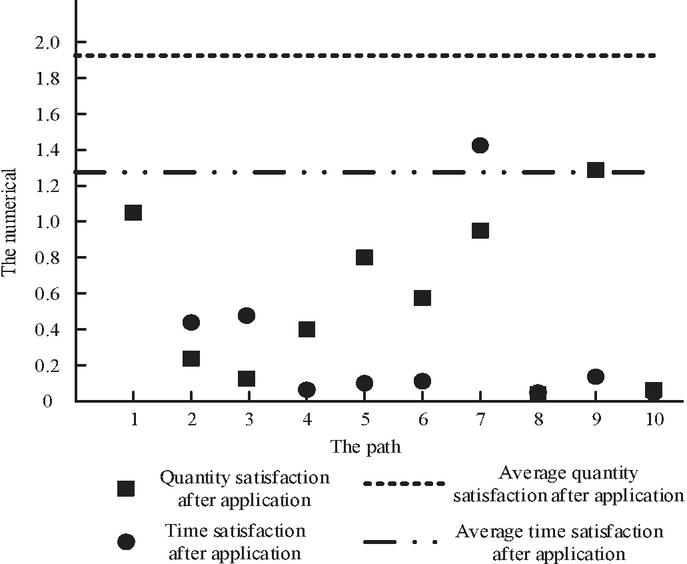
Figure 8 Electric quantity and time satisfaction of charging station layout optimization path.
According to the electric quantity and time satisfaction of the layout optimization path of each charging station after the application of the method shown in Figure 8, the average value of electric quantity and time satisfaction after the application of the method in this paper is relatively large. Therefore, this method can achieve the optimal satisfaction of emergency points in power and time, which verifies the scientificity and effectiveness of this method.
When the distribution of ROC is optimized, the distribution of ROC is always stable. Points (0,1), (1,0), (0,0) and (1,1) respectively indicate that the model correctly classifies all cloud security access user samples, incorrectly classifies all cloud security access user samples, predicts that all user samples are normal users, and predicts that all user samples are risk users. The ROC curve tends to point (0,1) indicates that the model performance is good. The ROC curve of the charging station layout optimization model is shown in Figure 9.
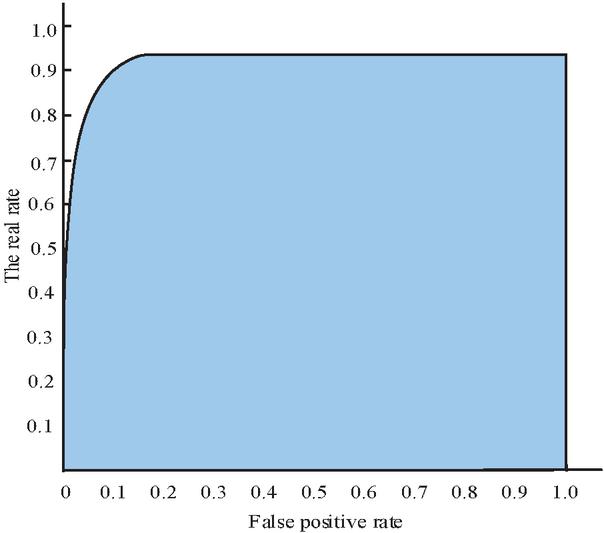
Figure 9 AUC area of the model.
According to the analysis of Figure 9, the real rate value of ROC curve of the charging station layout optimization model reaches more than 0.95 and close to 1.0, while the false positive rate value is initially 0 and then increases to 0.5. Although it increases, the increase range is small. The AUC area accounts for about 90% of the total area, which accounts for a large area. Therefore, the charging station layout optimization model constructed in this paper has strong generalization performance.
The analysis of confidence level can effectively reflect the risk aversion of decision-makers in the process of charging station layout optimization. In order to deeply explore the impact of the change of confidence level on the cost of charging station layout optimization and the overall risk level, two charging station paths after layout optimization are randomly selected for analysis, and the total cost change is calculated when the confidence level gradually increases. The results are shown in Figure 10 (the confidence level is negatively correlated with the degree of risk).
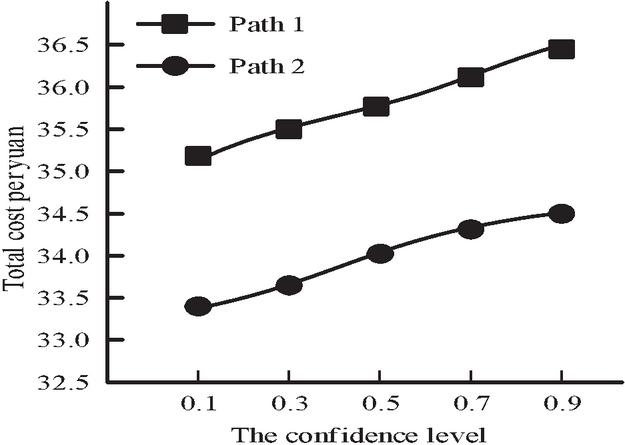
Figure 10 Relationship curve between confidence level and scheduling cost.
It can be seen from Figure 10 that under the two random charging station paths, with the increase of confidence level, the risk level of charging station layout optimization decreases and the reliability of layout optimization scheme increases, but the relative cost also increases and the economy of layout optimization scheme decreases. Therefore, when designing layout optimization scheme, decision makers need to reasonably measure the economy and risk.
4 Discussion
Based on the background of sustainable development, according to the current development status of electric vehicle charging stations in China, and based on the detection function of the IOT, this paper constructs a charging station layout optimization model considering user satisfaction and construction cost. Generally speaking, this paper mainly completes the following work:
(1) Aiming at the location selection of electric vehicle charging stations in the region, considering the problems from the perspective of user convenience, this paper studies the construction of multi-level charging stations, and introduces the concept of electric vehicle’s user satisfaction and evaluation function to build a model. The model selects the appropriate charging station service according to the different needs of users, which not only reduces the variable cost and operation cost of charging station establishment in the overall network, but also improves users’ satisfaction with the location of charging station, making the location of charging station more in line with the actual situation. Using genetic algorithm to solve the model can not only preserve the dominant individuals in the solution group and quickly converge to the optimal solution, but also produce new individuals with large differences, maintain the population diversity in the solution group and prevent premature phenomenon.
(2) Considering the two contradictory objects of users and builders, this paper studies the layout optimization problem of multi-objective charging station, and finally obtains the optimal solution satisfactory to both users and builders. The model selects the charging station according to the different needs of users. It not only considers the distance cost and waiting time cost from the perspective of users, but also considers the construction cost of the charging station from the perspective of builders, so that the location of the charging station is more in line with the reality. The model is solved by genetic algorithm, and the chromosomes in the genetic algorithm are repaired to maintain the diversity of solutions and prevent local optimization.
(3) The influence of the number of charging stations on each cost, the influence of charging rate on time cost, the influence of charging rate on the number of charging piles and the influence of customer group growth on charging rate decision-making are studied. The following conclusions are drawn: with the increase of the number of charging stations or charging piles, the satisfaction of users will improve and the construction cost of charging stations will increase. It is an important task of this paper to reasonably weigh the interests of users and builders; When the demand is certain, there is a critical rate to meet the charging demand of users. Exceeding this critical rate requires huge construction cost, and it is difficult to greatly improve user satisfaction.
Because there are many parameters involved in the layout optimization model of electric vehicle charging station, the values of some parameters in the example test in this paper are determined according to relevant reference and personal experience, which is lack of strict scientific basis. Therefore, the suggestions put forward in the practical engineering application in this paper are still broad opinions, but their significance lies in: the layout optimization of electric vehicle charging station is a complex problem. With the deepening of research, it is very necessary to introduce user behavior and charging satisfaction.
5 Conclusion
In the context of sustainable development, a charging station layout optimization method based on IOT is proposed. This paper shows that the charging piles in the electric vehicle charging stations are fast charging piles. In fact, the electric vehicle charging facilities have a variety of operation modes, such as fast charging, slow charging and power station replacement. There are different location models for each charging mode. This paper considers that the operation status of the charging station is relatively independent and has similar functions. More and more factors such as user experience and user behavior are added in the existing research. That is, with the change of the diversity of user needs, the construction and operation mode of the hybrid charging station can be further studied.
The electric vehicle charging demand studied in this paper arises at a certain point, but the current situation is that the electric vehicle charging demand may arise at the demand point or on the demand path. Therefore, there are limitations to studying only one case in the region. It is necessary to consider the demand at the demand point and the demand generated by the path at the same time, and build charging stations of different levels in the region. Another case is the location of electric vehicle charging stations in the high-speed road network. The charging needs of users are generated on a certain path on the highway network. The closure location model can be used to study the location of electric vehicle charging stations in the high-speed road network.
References
[1] Zheng, X. Q. Yao, Y. P. Multi-objective capacity allocation optimization method of photovoltaic EV charging station considering V2G[J]. Journal of Central South University, 2021, 28(2):481–493.
[2] Zhang, Y., Zhang, Q., Farnoosh, A., Chen, S. Li Y. GIS-Based Multi-Objective Particle Swarm Optimization of charging stations for electric vehicles[J]. Energy, 2019, 169(FEB.15):844–853.
[3] Gao, Q. F., Tao, Y. Z., Wei, Y. F., Wu, C. Dong, L. Y. Simulation-based optimization of inner layout of a theater considering the effect of pedestrians[J]. Chinese Physics B, 2020, 29(03):336–342.
[4] Zeng, B., Dong, H., Sioshansi, R., Xu, F. Zeng, M. Bilevel Robust Optimization of Electric Vehicle Charging Stations With Distributed Energy Resources[J]. IEEE Transactions on Industry Applications, 2020, PP(99):1–1.
[5] Wu, X., Feng, Q., Bai, C., Lai, S. C. Lai, L. L. A novel fast-charging stations locational planning model for electric bus transit system[J]. Energy, 2021, 224(1):120106.
[6] Tlili, I., Sajadi, S.M., Baleanu, D. and Ghaemi, F. Flat sheet direct contact membrane distillation study to decrease the energy demand for solar desalination purposes[J]. Sustainable Energy Technologies and Assessments, 2022, 52:102100.
[7] Deb, S., Tammi, K., Kalita, K. Mahanta, P. Charging Station Placement for Electric Vehicles: a Case Study of Guwahati city, India[J]. IEEE Access, 2019, 7(99):100270–100282.
[8] Chen, Z., Wang, W. X., Li, Z. Q., Zhang, Y. G., Sun, Z. Sun, X. K. Optimization of charging pile layout based on multi-factor constrained P-median model. Beijing Jiaotong University, 2021, 45(3):93–99.
[9] Hu, J. G. Qi, F. Research on layout optimization of energy storage tram charging stations [J]. Urban rail transit research, 2020, 23(5):15–18, 22.
[10] Gao, J., Liu, J., Yue, H., Zhao, Y., Tlili, I. and Karimipour, A. Effects of various temperature and pressure initial conditions to predict the thermal conductivity and phase alteration duration of water-based carbon hybrid nanofluids via MD approach[J]. Journal of Molecular Liquids, 2022, 351:118654.
[11] Luo, Y., Feng, G., Wan, S., Zhang, S., Li, V. Kong, W. Charging scheduling strategy for different electric vehicles with optimization for convenience of drivers, performance of transport system and distribution network[J]. Energy, 2020, 194(Mar.1):116807.1–116807.13.
[12] Deb, S., Tammi, K., Kalita, K. Mahanta, P. Charging Station Placement for Electric Vehicles: a Case Study of Guwahati city, India[J]. IEEE Access, 2019, 7(99):100270–100282.
[13] He, Y. W., Dong, P. W. Chen, X. Research on layout decision of electric vehicle quick charging station based on road network [J]. Operations research and management research, 2020, 29(5):125–134.
[14] Ramadan, K.M., Qisieh, O. and Tlili, I. Thermal creep effects on fluid flow and heat transfer in a microchannel gas cooling[C]. Proceedings of the Institution of Mechanical Engineers, Part C: Journal of Mechanical Engineering Science, 2022, 236(9):5033–5047.
[15] Yuan, T. j., Yang, N., Zhang, Y., Che, Y. LI, A. K. Optimization of Pre-installed Energy storage Power Station Layout based on Surrogate [J]. High Voltage Technology, 201, 47(4):1314–1322.
[16] Chen, M. Q. Li, J. L. Charging Coordination Method of Distributed Charging Piles Based on Local Voltage Amplitude and Cloud Edge Coordination [J]. Electric power construction, 2020, 41(6):60–68.
[17] Qian, K. J., Qin, M., Song, Y. J., Zhou, Z. K., Liu, Y., Xie, Y. Chen, L. J. Multi-objective optimal scheduling of charging station based on fuzzy membership degree [J]. Electric power construction, 2020, 41(2): 118–124.
[18] Cao, J. J., Wang, C., Huo, C. H., Luo, C. Y., Tao, D. C. Wu, X. X. Optimization planning of charging station considering load fluctuation and voltage Offset in distribution network [J]. Journal of Electric Power Science and Technology, 2021, 36(4):12–19.
[19] Cheng, S., Yang, K., Wang, Y. Q., Yan, X. Wei, Z. B. Interval optimization scheduling of electric vehicle charging stations including wind power generation [J]. Electric Machines and Control, 2021, 25(6): 101–109.
[20] Feng, C. Ye, L. Simulation of location model of electric vehicle charging station based on two-level programming. Computer Simulation, 2019, 36(8):6.
[21] Yang, N., Yuan, T. J., Zhang, Y. Zhang, L. Structural Layout Optimization of Pre-installed Hydrogen storage Power Station Based on Surrogate Optimization Modeling method [J]. Transactions of China Electrotechnical Society, 2021, 36(3):473–485.
[22] Liu, Q. H., Zhang, Y. B., Wei, J. F., Hong, C. W., Pang, F. Zhou, Q. Electric power automation equipment, 2019, 39(6):122–129, 152.
[23] Sun, Y., Jiang, C., Wang, Z. H. Tang, C. S. Optimization layout of dynamic wireless power supply system for electric vehicles based on PSGA [J]. Automation of electric power systems, 2019, 43(9):125–131.
Biographies

Yingjun He was born in Dali, Yunnan Province in China in 1987. He holds a bachelor’s degree from Yunnan Agricultural University. He is currently working in the information center of Yunnan Power Grid Co., Ltd., engaged in information construction and management, mainly researching digital power grid monitoring and operation.

Shenzhang Li was born in Baoshan of Yunnan Province in China in 1985. Now he is working in the information center of Yunnan Power Grid Co., Ltd., mainly engaged in the digital application of cloud computing and big data technology in power grid, proficient in power grid GIS business and technology. And he has a clear understanding of the future construction direction of GIS And grasp, being good at software analysis and design.

Hexiong Chen was born in Qujing of Yunnan Province in China in 1984. He has hold the Master degree from Kunming University of Science and Technology. He works in Information Center of Yunnan Power Grid Co., Ltd. Mainly engaged in network and network security research.

Xiu Liu was born in Neijiang of Sichuan Province in China in 1987. She got the bachelor degree from Yunnan University. Now, she is working in the Information Center of Yunnan Power Grid Co., Ltd. Mainly engaged in IT operation and maintenance and service related content.

Lin Wang was born in 1985 in Chuxiong of Yunnan Province in China. He holds a bachelor’s degree from Yunnan Normal University and is now working in the Information Center of Yunnan Power Grid Co., Ltd. He Mainly engaged in IT operation and maintenance and service related content.

Shaolong Li was born in Fengqing of Lincang, Yunnan in China in 1983. He holds a bachelor’s degree from Yunnan University of Finance and Economics. He works in the information center of Yunnan Power Grid Co., Ltd., mainly engaged in IT operation and maintenance now.
Distributed Generation & Alternative Energy Journal, Vol. 38_4, 1279–1306.
doi: 10.13052/dgaej2156-3306.3849
© 2023 River Publishers