Optimizing Energy Consumption in Smart Grids Using Demand Response Techniques
SwornaKokila M L1, Venkatarathinam R2,*, Rose Bindu Joseph P3, M. A. Manivasagam4 and Kakarla Hari Kishore5
1Department of Computing Technologies, School of Computing, College of Engineering and Technology, Faculty of Engineering and Technology, SRM Institute of Science and Technology, SRM Nagar, Kattankulathur, Chennai, TN, India
2Department of Information Technology, Sri BalajiChockalingam Engineering College, A.C.S. Nagar, Irumbedu, Arni, Thiruvannamalai District, Tamil Nadu, India
3Department of Mathematics, Dayananda Sagar College of Engineering, Bangalore, India
4Computer Science and Engineering, Siddartha Institute of Science and Technology, Andhra Pradesh, India
5Department of Electronics and Communication Engineering, KoneruLakshmaiah Education Foundation, Vaddeswaram, Guntur, Andhra Pradesh, India
E-mail: kokilaolive@gmail.com; hodinfotechsbce@gmail.com; rosalindleena@gmail.com; mvsistk@gmail.com; kakarla.harikishore@kluniversity.in
*Corresponding Author
Received 09 June 2023; Accepted 09 August 2023; Publication 02 November 2023
Abstract
Smart grids have developed as a potentially game-changing strategy for controlling the demand and supply of energy. Unfortunately, peak demand is a significant source of grid instability and rising energy prices, making it one of the most critical difficulties in smart grids. During times of high energy demand on the grid, demand response (DR) strategies incentivize consumers to change how they use energy. This study’s overarching goal is to learn how DR methods may be used to help smart grids make better use of their energy resources. The primary research is to develop a smart DR system that can predict times of high energy demand and proactively alter usage to reduce such periods. Machine learning strategies are utilized in the proposed system to estimate peak demand via past data, weather predictions, and other variables. The system will then alter energy use based on real-time data from smart meters along with other sensing devices to meet the projected demand. The simulation model will include several scenarios for testing the DR system’s flexibility, including a range of weather conditions, load profiles, and grid topologies. Several indicators, including peak demand reduction (80.04%), energy savings (38.09%), environmental consequences, and reaction time (0.4 seconds), are used to evaluate the model’s performance. The output of the method excelled all of the other current methods that were taken into account. The system’s rapid response time and its positive environmental impact further highlight its potential in managing smart grid resources effectively.
Keywords: Demand shift, peak demand, response time, autonomous computation, energy optimization, policy optimization.
1 Introduction
Revolutionary developments in the energy industry have resulted from the widespread use of smart grids. These grids provide adequate control of energy demand and supply via the integration of cutting-edge technology and communication networks. Still, peak demand is a massive hurdle to grid stability and contributes to growing energy costs, making it a severe problem for smart grids [1].
Electricity usage peaks during certain times of day, known as “peak demand.” A spike in energy use at these times may put a strain on the grid, resulting in erratic voltage, power outages, and other problems. Less effective and more expensive power sources are typically used to accommodate the growing demand, driving up customer energy costs [20].
Demand response (DR) solutions have acquired widespread attention and acceptance as a way to optimize energy usage patterns in accordance with the problems posed by demand spikes. Consumers are incentivized to alter their energy consumption habits at peak demand times as part of DR strategies. Demand curves may be efficiently managed and flattened by smart grids, which incentivize users to decrease or transfer energy use to off-peak times [2].
The core target of this research is to investigate the viability of demand response strategies for improving energy efficiency in smart grids. In addition, the initiative intends to enhance stability in the grid and economical energy administration by encouraging customers to adjust their energy usage practices during peak demand times through DR methods.
Many advantages can be gained when integrating DR strategies with smart grids. Primarily, it improves dependability and lessens the likelihood of blackouts by easing pressure on the system during peak demand. Second, DR techniques may help improve energy administration by promoting load shifting and moving energy-intensive operations to off-peak times. This helps to lessen the demand for extra generating capacity during peak times [15].
Additionally, DR could assist in optimizing energy usage by decreasing the utilization of exorbitant and inefficient power sources during times of high demand. Ultimately, this could make the energy market more reasonable and sustainable for customers.
This project intends to contribute to worldwide efforts towards optimal energy resource utilization, grid stability, and alleviating the issues associated with peak demand by researching and evaluating the possibilities of DR approaches inside smart grids. Furthermore, this study’s results and insights may help policymakers, electricity providers, and stakeholders optimize the administration of energy in smart grids on a worldwide scale by influencing their decision-making and the implementation of efficient demand response mechanisms.
1.1 Significance of Peak Demand in Smart Grids
The term “peak demand” describes times of high electrical usage, often at regular intervals throughout the day [29]. High energy costs and grid instability are only two of the problems that peak demand causes in smart networks. There may be voltage fluctuations, potential blackouts, and additional strain on the power grid if it is unable to keep up with the elevated demand for electricity at these times. As a result of the increasing demand, energy suppliers may turn to more costly and inefficient sources of power, driving up the price of electricity. Therefore, it is essential to deal with peak demand to maintain grid stability and implement efficient energy management in smart grids.
1.2 Demand Response (DR) Strategies
Demand response solutions aim to reduce grid stress by encouraging customers to adjust their energy use during peak demand times [14]. Time-based pricing, payment incentives, and sophisticated control systems are just a few examples of the methods used to encourage customers to modify their energy use patterns. Flattening the demand curve, minimizing the need for extra generating capacity, and improving grid stability are all benefits of DR, which works by incentivizing users to decrease or shift their energy usage during peak hours. Also, via promoting energy conservation and decreasing dependency on renewable fuel-based generators, DR deployment aids the environment and helps to make the grid more sustainable.
1.3 Development of a Smart DR System
Using machine learning algorithms, the suggested smart demand response (SDR) system can foresee periods of high energy demand and regulate energy consumption proactively in smart grids [5]. We use machine learning (ML) methods to analyze past data, future weather forecasts, and other factors to provide reliable peak demand estimates [12].
The SDR system can determine the relationships between energy use and variables, including time_of_day, day_of_the_week, and conditions, by analyzing past consumption trends. ML algorithms can evaluate these trends, which then use that information to forecast energy use in the future under similar circumstances. The system can then anticipate when those times of highest demand will be.
The ML algorithms take into account both past data and forecasts. The degree of humidity, the temperature, and the time of year are just a few of the meteorological variables that have a noticeable effect on energy consumption. Therefore, the SDR system may improve the precision of its demand projections by considering weather forecasts.
Once it has predicted when peak demand will occur, the system uses actual data from the standard datasets comprising smart meters and other sensed values. With the data provided by datasets, energy use can be tracked and analyzed instantaneously at a granular level. Additional information on individual sources of energy use can be gleaned from other sensing devices, like appliance sensors or automated construction system data.
The constantly updated data allows the SDR system to take preventative measures to control energy consumption and reduce peak demand. Some of these measures include “load shifting,” in which non-critical energy-using activities are moved to “off-peak” durations, and “load shedding,” in which systems or devices are temporarily shut down during “peak” times (Kakran&Chanana, 2018). In addition, the system might prioritize energy use in response to important demands or user preferences.
The ML algorithms adapt and learn accordingly as the smart grid mechanism receives more data and input. As a result, extremely effective and economical demand response solutions might be used as the computations improve at anticipating peak demand and optimizing energy consumption.
Incorporating ML approaches, the suggested SDR system can automatically manage energy resources and make choices based on trained data. For instance, the system may dynamically change the energy usage patterns to match the expected demand using historical data, weather forecasts, and actual-time data from various grid components. In smart grids, this boosts efficiency and profitability by decreasing peak demand and increasing grid stability [30].
1.4 Scope and Motivation
The study presented in the abstract aims to design an SDR system that uses ML algorithms to maximize smart grids’ effectiveness in using their energy resources. In addition, this study seeks to find ways to mitigate the effects of peak demand, which threatens the reliability of the power system and drives up the cost of electricity. The remit includes DR strategies that encourage customers to alter their energy usage patterns at peak demand times. The study also includes developing a simulation model to evaluate the adaptability and efficiency of the proposed DR system over a range of variables. These have distinct weather patterns, load profiles, and grid configurations. Demand spike reduction, reductions in environmental impacts, and response times are only a few of the performance assessment indicators used to gauge the system’s efficacy.
The potential for smart grids to transform the energy industry via improved oversight of energy supplies is driving this study. The peak demand issue, however, prevents smart grids from providing their full advantages [7, 32]. High energy demand causes grid instability, cost spikes, and inefficient power use. The DR solutions that have arisen, forcing customers to alter their energy usage routines during peak demand times, are one reaction to this problem. This study aims to examine how DR strategies and ML in particular, can be used to improve smart grid energy efficiency. The project aspires to aid in grid stability, economically viable energy oversight, and ecological responsibility via developing an SDR system that can precisely forecast demand spikes and proactively control energy use. The study’s secondary goal is to help policymakers, energy suppliers, and other stakeholders develop and execute efficient demand response techniques worldwide. Finally, the study is motivated by a desire to improve smart grid energy management’s effectiveness, dependability, and long-term viability.
1.5 Objectives and Contributions
• Develop a Smart Demand Response (DR) System: Design and implement a machine learning-based smart DR system that accurately predicts peak energy demand and adjusts energy usage in real-time using data from smart meters and other sensors.
• Test and Evaluate System Flexibility: Create a simulation model that replicates real-world conditions, including different weather patterns, load profiles, and grid topologies, to assess the adaptability and performance of the smart DR system in optimizing energy usage and reducing peak demand.
• Compare and Validate System Performance: Conduct a comparative analysis to demonstrate the superiority of the developed smart DR system over existing methods by evaluating metrics such as peak demand reduction, energy savings, environmental impact, and response time. Validate the effectiveness and potential of the system in optimizing energy resource utilization in smart grids.
The contributions of this research towards the stated objectives are as follows:
• A Smart Demand Response (DR) System was developed using a hybrid of Reinforcement Learning and Generative Adversarial Networks. The system accurately predicts peak energy demand and dynamically adjusts energy usage using real-time data from smart meters and sensors.
• The research created a realistic simulation model replicating various real-world conditions. This model facilitated the testing of the smart DR system’s adaptability under different weather patterns, load profiles, and grid topologies, confirming its robustness and versatility in optimizing energy usage and reducing peak demand.
• A comprehensive comparative analysis was conducted, demonstrating that the developed smart DR system outperforms existing methods. The system showed significant improvement in key metrics such as peak demand reduction, energy savings, environmental impact, and response time. This validates the potential of the proposed system in optimizing energy resource utilization in smart grids.
The study outline is delineated in the following manner. Section 2 includes the discussions and overview of highly relevant research work. Section 3 traces the incorporation of applicable datasets and the working mechanism of the proposed work with the essential computation part. Section 4 provides insight into the utilization of the methodology and elaborates on the details of the observed outcomes. Section 5 briefs the research with precise conclusive key points and future work.
2 Related Work
This section presents a short overview of the literature, focusing on the contributions extracted from a select number of prior investigations.
Game theory is proposed in and as a decentralized method for controlling energy usage and conservation and coordinating the recharging of Pluggable Hybridized E-Vehicles (PHEVs) at end-user locations. Their results show that through Nash equilibriums, they’ve reached guaranteed optimum performance concerning the cost reduction in generating power for the grid and maintaining a steady frequency [26, 31].
When numerous users are using a single energy source, Amir-HamedMohsenian-Rad et al. and Mohsenian-Rad et al. offer utilization management techniques that make use of two-way communications to cut down on expenditures. Both the demand and consumption sectors can be specific that their information will remain confidential thanks to game-theoretic techniques to solve the issue [3, 22].
Ibars et al. provide Congestion-based Distributive DR (CDDR) Systems. These strategies are designed to lower consumer power costs while maintaining optimal system performance. Common network congestion issues inspired the method for digital infrastructure. Because of their equivalence with prospective, congestion games guarantee the possibility of Nash equilibrium [13].
O’Neill et al. present a model in which home electricity use and the cost are seen as Markov decision operations (MDOs). However, the authors use RL approaches to continually acquire and adjust to this unpredictable knowledge over the course of time because the conditional likelihood of transitions in the core Markov chains is often unpredictable. This method guarantees the model’s efficacy regardless of alterations in the fundamental Markov chain’s composition [23].
Meanwhile, Liang et al. made zero emphasis on the dynamic patterns demonstrated through PHEVs. Instead, they claim that the probability of transitioning between states, governed by the Markov chain, changes with time for PHEVs. The authors deeply analyzethis unpredictable Markov decision mechanism to determine the best Markov strategy for PHEVs’ recharging and draining options [19].
Predicting future energy consumption is difficult, and Clement et al. take on this task. Stochastic computing simulates unpredictable requests, and likelihood density distributions are used. This ambiguity results from incorrect predictions of residential energy use patterns [6].
Pedrasa et al. used a Particle Swarm Optimization (PSO) method to figure out how to schedule DERs cooperatively. They went with PSO since it could be implemented quickly and efficiently. Still, one of the limitations of PSO is that it’s possible to gravitate towards alternatives that are very close to being optimal. Because of this, much iteration are required to investigate the possibility of finding more ideal solutions [25].
PSO variations are used by Ahmed Yousuf Saber & Venayaga moorthy,to dynamically execute the operation of energy generation condominiums and, to find the optimum number of grid-capable automobiles. Binary-PSO and numerical PSO minimize the computing time and intricacy required to find poor solutions [28].
The researchers use approximation dynamic code to handle multi-stage optimization. In addition, they use a statistical learning technique to break down the overarching issue into manageable, shorter-term challenges. However, one of the most difficult tasks in this setting is coming up with a state-aware estimation of the significance unit for unpredictable issues [4, 17].
Therefore, the research gap lies in developing a comprehensive demand response system that combines advanced machine learning techniques, ensures confidentiality, efficiently handles unpredictable transitions and complex multi-stage optimizations, and takes into account the time-varying nature of system behaviours.
3 Methodology
In this research, we incorporated the hybridized working mechanism of Reinforcement Learning with Generative Adversarial Networks (RL-GAN) for SDR in Smart Grids. RL-GAN combines the power of reinforcement learning (RL) and generative adversarial networks (GANs) to optimize energy consumption in smart grids using demand response techniques. Figure 1 presents the architecture of the proposed model [8, 33].
The training procedure between the RL agent and the generator network () is adversarial. The RL agent’s goal is to maximize the incentive signal, which motivates actions that are good for the environment and save energy. At the same time, the generator network works to create synthetic accounts convincing enough for the discriminator (d) to mistake them for the actual phenomenon.
The provides feedback to the RL agent. The RL agent’s learning is supplemented by the d’s results, which indicate whether the energy consumption patterns are actual or crafted. This information is helpful for the RL agent in assessing the credibility of the predicted energy consumption patterns. During demand responses, the RL agent learns to make more sustainable decisions, and the generator network evolves to provide synthetic energy consumption patterns that are more probable and realistic.
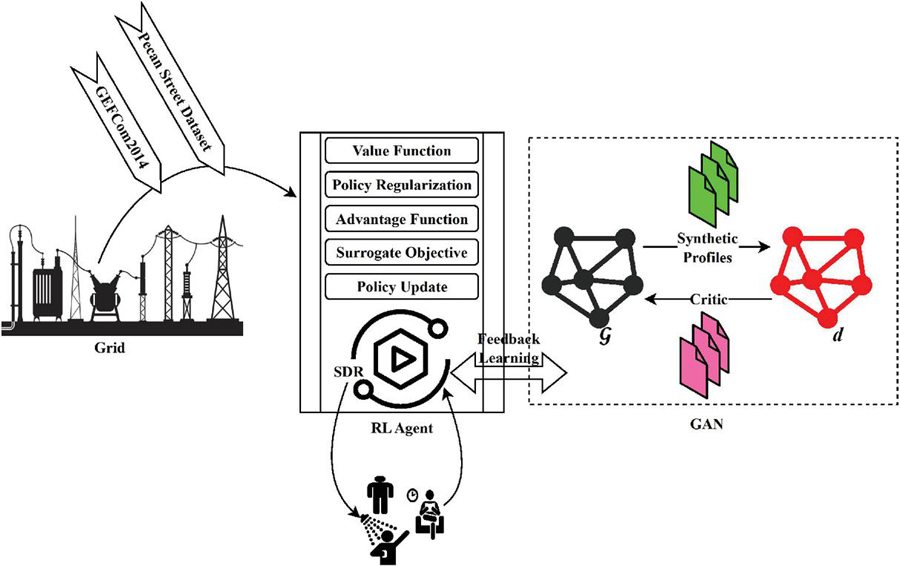
Figure 1 Architecture of proposed DR strategy.
3.1 Datasets
The datasets Global Energy Forecasting Competition (GEFCom2014) (GEFCom2014.Zip, n.d.) and Pecan Street Dataset (Pecan-Street-DB, 2022) are mined for actual energy consumption information collected from smart meters, weather-related information, as well as other pertinent information. In other words, the RL-GAN model will use this information as its training dataset [11].
Global Energy Forecasting Competition (GEFCom): It is a well-known programme that offers datasets for predicting energy from sustainable sources and electricity load. It is ideal for smart grid analytics since it contains both past data and related meteorological statistics. Furthermore, GEFCom data is structured in a way that allows researchers to explore different facets of energy forecasting, such as hourly, daily, and monthly forecasting. It also allows for the exploration of different forecasting horizons, from very short-term (intra-day) to long-term (up to a year ahead).
Table 1 Essential premises for the training phases
| Premises | Description |
| Discrete State Space | Let’s assume that the state space, denoted as , is discrete with N states: |
| Discrete Action Space | Let’s assume that the action space, denoted as , is discrete with m actions: |
| Markov Decision Process (MDP) | Let’s assume that the smart grid system can be modeled as an MDP, where the current state captures all relevant information to make decisions. |
The Pecan Street Dataset: It is a comprehensive database of building-level energy usage records, including both business and residential structures. Electricity use, renewable power output, weather records, and appliance-specific energy use are all included. In addition to energy consumption and generation data, the Pecan Street Dataset also includes local weather data. This enables researchers to understand the impact of weather conditions on energy consumption and renewable energy generation. This information is invaluable for studying the interplay between electricity generation, storage, and consumption at the building level.
3.2 Computations of RL-GAN
RL Component: To learn optimum control strategies, including the model’s RL sub-component during operation is essential. Therefore, the study uses RL algorithms, specifically Iterative Proximal Policy Optimization (IPPO), to formulate control strategies through the consumption of electricity record. Table 1 represents the essential premises for the training phases.
Beside the generalized components, RL includes specialized functionaries like value function, policy regularization, advantage function for action quantification, and surrogate objectives to update the policy iteratively.
Value Function: When beginning from state and executing a policy , the value operations, represented as , estimate the predicted overall reward. The value functioncan be defined as an N-by-N table, with one row for each possible state. Bellman’s equation is employed to solve the value function, and it is expressed as:
| (1) |
where, represents the prediction of every possible consequence. Taking action in state at time t and arriving at state is rewarded immediately with . It is the instantaneous indication of reinforcement. (discount factor) is a number ranging from zero to one is used to weigh prospective rewards significantly over present ones. Future benefits are given greater weight if the discount component is nearer to 1. Besides the computation facts, the policy is required to determine the decision-making procedures in mapping several ’s with appropriate ’s. Given a state , the policy, indicated as (), specifies the distribution of possible ’s.
Policy Regularization: The policy can be modelled as a table with x rows () and y columns (), where each cell represents the likelihood of performing the action in state and reads (). Following significant notations are considered for further computations.
• : Expectancy of doing step a while in condition s.
• : The range of the probabilities is from 0 to 1.
• : A legitimate probability distribution requires that the aggregate of the likelihood for all actions in a given state remain equal to 1.
For an instance, let’s consider a simplified scenario with three states and two actions . The policy table is represented as follows in Table 2:
Table 2 Policy table
The table’s values show the percentages of each state’s population likely to do each activity. Measured values of state-action pairings can influence policy revisions. Values for each state and action pair are estimated in the policy assessment stage, and then those estimates are used in the policy enhancement step to make adjustments to the policy. By iteratively refining the policy, the smart grid system can eventually converge on a strategy that maximizes the predicted cumulative return. Table 3 represents the policy computation of RL algorithm which includes various steps like policy initialization, evaluation, enhancements, and iterations. The algorithm states that the policy table is prepared by populating it with initialized probabilities. Policy assessment involves making estimates of the policy’s impact in each . Iterative computations, including value iteration and policy iteration, can be implemented to accomplish the purpose. For example, determining the values of (,) pairings is often done using value iteration. The values are revised recurrently in light of the predicted payoffs.
Reviewing the policy table with the predicted values concerning the previous step constitutes the policy enhancement phase. The most valuable action is selected with probability , and a randomized response is chosen with probability to promote exploration. After the first step 1, policy iteration repeats steps 2 and 3 as long as convergence is reached and no further modifications become apparent in the policy. The method for iteratively refining a policy performs cycles of assessment and refinement until it reaches a local maximum.
Table 3 Policy computation of RL algorithm
| 1: // Initialization |
| 2: //policy evaluation |
| where, denotes the state transition probability, indicates the received rewards during transition for performing the specific action, represents the discount factor. |
| 3: //policy enhancement |
| 4: Repeat 2 and 3 //policy iteration |
Advantage Function: The advantage function, denoted as , quantifies the advantage of taking action a in state s compared to the average value of actions in that state. It is estimated using Temporal Difference Learning (TDL) method. TDL estimates the advantage function based on the observed rewards and estimated values of (,) pairs. It uses a combination of and estimated future rewards to compute the advantage. Let’s consider a TDL(Y) method, which is a family of TDL algorithms parameterized by the eligibility trace decay parameter Y.
The advantage function at time t can be computed using the TDL(Y) update as follows:
| (2) |
where, is the immediate reward received after taking action a in state s, is the discount factor, is the estimated value of the next state , is the estimated value of the current state , and is the TDL error. , represents the discrepancy between the estimated value of the current state-action pair and the estimated value of the next state. It quantifies the advantage of taking in state . The can then be updated using the eligibility trace as follows:
| (3) |
where is the total number of time steps, is the TDL error at time t, and is the eligibility trace, which captures the history of the advantage function updates. can be defined as:
| (4) |
where, Y is the eligibility trace decay parameter. By updating the based on and , the advantage values for each () pair can be estimated.
Surrogate Objective: IPPO utilizes a surrogate objective function to update the policy iteratively. The surrogate objective aims to maximize the likelihood ratio (ß) between the updated policy and the older while constraining the policy update to be within a certain cutoff. Let’s consider a policy parameterized by Y, denoted as (), which represents the probability of taking in given the policy parameters Y. The surrogate objective function in IPPO can be defined as follows:
| (5) |
where is the surrogate objective, is the ratio of the updated policy to the old policy, is the advantage function at time step t, and is a function that clips the ratio between and . The clipping term in the surrogate objective ensures that the policy update is within a certain threshold determined by . This helps in stabilizing the training and preventing large policy updates.
Policy Update: To optimize the policy, IPPO uses gradient-based optimization methods. The policy update is performed by minimizing the clipped surrogate objective using ADAM optimization algorithms. The policy update step in IPPO involves taking gradient steps to minimize the with respect to the Y. This can be done using ADAM optimizer. The update equation for the Y is given by:
| (6) |
where, is the updated , is the , is the learning rate, and is the gradient of the surrogate objective function with respect to Y. By iteratively updating the policy parameters using the gradient descent step, IPPO optimizes the policy to improve its performance in the smart grid system. The learning rate () determines the step size in the parameter update and needs to be carefully chosen to balance between convergence speed and stability.
GAN Component: Incorporate the GAN component into the model to generate realistic synthetic data samples. The GAN will learn the underlying distribution of the energy consumption data and generate synthetic samples that closely resemble the real data. This generated data can augment the original dataset and improve the model’s performance.
We assume that the continuous latent space, denoted as , which is representing a randomized noise vector of size V:
The and d are parameterized by weights and , respectively. The takes a latent variable v from the latent space V as input and generates a synthetic energy consumption sample, . Mathematically, this can be represented as:
| (7) |
where, represents the generator network with weights .
The discriminator network d takes an (either actual or synthetic) as input and produces a probability indicating the likelihood of the sample being real. Mathematically, this can be represented as:
| (8) |
where represents the discriminator network with weights .
Training Objective: The GAN training objective focus to find equilibrium between the and d networks. The generator’s goal is to provide convincing samples that will deceive the discriminator, while the discriminator’s goal is to identify the actual and fake ones correctly (Lars Mescheder et al., 2017). This situation may be envisioned as a mini-max game. One such definition of the objective function is:
| (9) |
where, represents the probability distribution of real energy consumption samples, represents the probability distribution of latent variables, and denotes the natural logarithmic notation.
Training: During training, the and d networks are updated alternately to improve their performances. The updates involve backpropagation and gradient descent techniques to optimize the parameters and .
Demand Response Optimization: The model can learn to predict energy consumption patterns, identify peak demand periods, and generate optimal control policies to reduce energy consumption during the required peak periods.
Training and Evaluation: Using the combined dataset of real and generated samples, the model RL-GAN is trained. The ability of the model’s performance is continuously evaluated to optimize energy consumption, reduce peak loads, and improve overall grid efficiency.
The RL-GAN model offers several advantages, including the ability to capture complex energy consumption patterns, adapt to changing conditions, and generate synthetic data for training purposes. It can provide valuable insights and decision-making support to energy management systems in smart grids.
4 Performance Analysis
In this research, we utilized GridLAB-D (GridLAB-D Simulation Software, n.d.) simulation software. It is a freeware and open-source package for modeling and simulating smart grid behavior. Distribution connections, alternative power sources, loads, and adaptable sophisticated control algorithm choices may all be simulated in this environment. Furthermore, in order to build a more accurate simulation of the real-world, GridLAB-D may be used to add actual weather conditions, load accounts, and network (grid) topologies. The overall simulation hour is 168 hours (7 weeks). Table 4 provides the overview of GridLAB-D’s characteristics.
To evaluate the performance and flexibility of the SDR system, a simulation model is developed. The proposed model allows for the testing of various scenarios that replicate real-world conditions. It includes diverse weather conditions, representing different seasons or climate variations, as well as different load profiles that mimic variations in energy consumption patterns. Additionally, the simulation model incorporates different grid topologies to account for variations in infrastructure and distribution networks. By subjecting the SDR system to these scenarios, it is easier to assess the models’ ability to adapt and optimize energy usage under different operational conditions, ensuring its effectiveness in real-world deployment. Several existing methodologies like CDDR, MDOs, and Binary-PSO and indicators are utilized to evaluate the performance of the proposed SDR system.
Table 4 Feature of GridLAB-D
| Characteristic | Specification |
| Purpose | Power system simulation and analysis tool |
| Components | Distribution networks, renewable energy sources, loads, control algorithms |
| Weather Modeling | Realistic weather patterns (temperature, solar radiation, wind speed) |
| Load Profiles | Diverse energy consumption patterns, including daily and seasonal variations |
| Grid Topologies | Distribution feeders, transformers, switches, and other grid infrastructure |
| Simulation Capabilities | Accurate modeling of power flows, voltage profiles, and equipment behavior |
| Customization | Flexible and customizable for specific requirements |
| Integration | Ability to integrate and assess smart Demand Response (DR) systems |
| Performance Evaluation | Optimization of energy usage and peak demand reduction |
| Development | Allows for further development and extensions |
Peak demand reduction: These metric measures the extent to which the system successfully reduces peak demand levels compared to the baseline scenario without SDR implementation. Higher peak demand reduction indicates the effectiveness of the system in managing and flattening the demand curve.
The observed outcomes from Figure 2a demonstrate that the implementation of the Smart Demand Response (SDR) system significantly improved peak demand reduction compared to the scenario without SDR. The SDR system achieved a higher peak demand reduction (87.14%) compared to the scenario without SDR (67.11%) during the 28th hour of the time period. The SDR system excelled in peak demand reduction (94.25%) compared to the scenario without SDR (66.16%) during the 168-time period. This indicates that the SDR system was highly effective in optimizing energy usage and reducing peak demand.
The observed outcome from Figure 2b depicts the effectiveness of proposed SDR in reducing peak energy demand compared to the existing models. The SDR method consistently outperforms the other methods (CDDR, MDOs, and Binary-PSO) in terms of peak demand reduction across all time periods. SDR achieves the highest average peak demand reduction of 80.04%, indicating its effectiveness in reducing peak energy demand and optimizing energy usage. CDDR and MDOs show relatively lower peak demand reduction values and average values compared to Binary-PSO and SDR. This suggests that these methods might have limitations in proactively altering energy usage to mitigate peak demand. Binary-PSO performs better than CDDR and MDOs in terms of peak demand reduction, but it still falls behind SDR in achieving higher reductions. The observed outcomes validate the prominent research goal of proposed SDR system that can predict high energy demand periods and proactively alter usage, resulting in significant peak demand reduction.
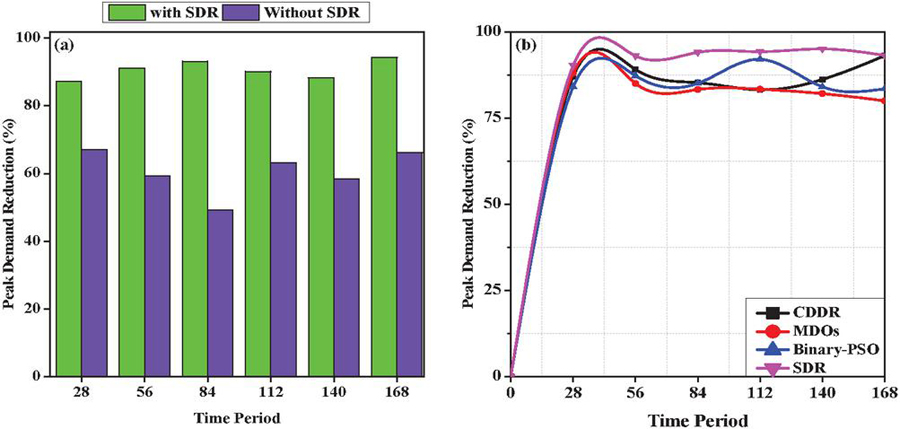
Figure 2 Analysis of peak demand reduction (%).
Energy savings: It quantifies the amount of energy saved through the implementation of the SDR system. Energy savings can result from load shifting, load shedding, or optimizing energy usage during peak periods, leading to reduced overall energy consumption.
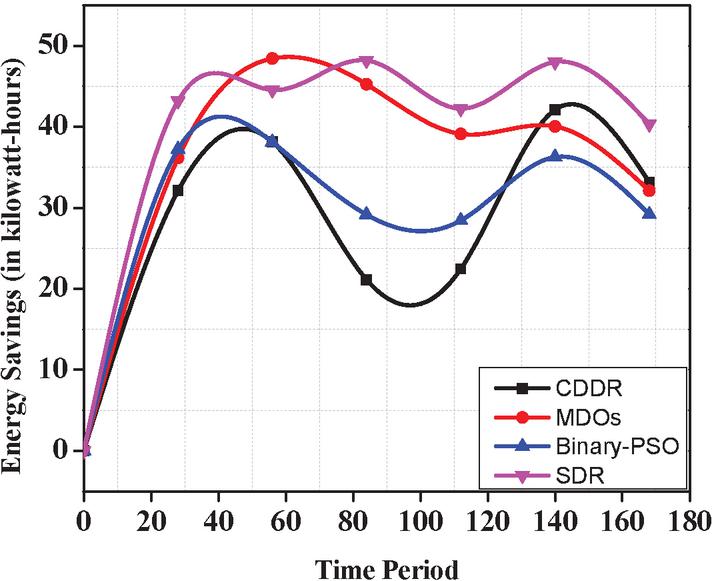
Figure 3 Energy saving (in kilowatt-hours).
Figure 3 represents the observation on Energy Savings (in kilowatt-hours) for different methods (CDDR, MDOs, Binary-PSO, and SDR). The energy savings achieved by SDR range from 40.34 kWh to 48.19 kWh across different time periods. The average energy savings achieved by SDR is 38.08 kWh. The SDR method consistently outperforms the other methods (CDDR, MDOs, and Binary-PSO) in terms of energy savings across all time periods. SDR achieves the highest average energy savings of 38.08 kWh, indicating its effectiveness in optimizing energy usage and reducing overall consumption. MDOs and Binary-PSO show moderate energy savings, but they fall behind SDR in achieving higher savings. CDDR exhibits relatively lower energy savings compared to the other methods, indicating potential limitations in altering energy usage to achieve significant savings. These findings highlight the potential of the SDR method in making better use of energy resources in smart grids and addressing the challenges associated with peak demand, grid instability, and rising energy prices.
Reaction time: This metric measures the system’s responsiveness to changing demand conditions. A faster reaction time ensures that the system can quickly adapt to sudden shifts in energy demand and effectively manage energy resources [27].

Figure 4 Analysis of response time vs demand shift.
From the Figure 4, it is notable that the SDR method consistently exhibits the lowest response time among all the methods, with an average response time of 0.33 seconds. This indicates that the SDR system can quickly adapt to changing demand conditions and effectively manage energy resources in real-time. MDOs and Binary-PSO show comparable response times, with an average of 0.46 seconds for both methods. These response times are slightly higher than those of SDR but still within an acceptable range for effective demand response. CDDR exhibits a slightly higher average response time of 0.52 seconds compared to the other methods. While it still provides a reasonable response time, it may have some limitations in terms of responsiveness to sudden shifts in energy demand.
The observed outcomes suggest that the developed SDR system, particularly the SDR method, excels in terms of response time, indicating its ability to quickly and efficiently adapt energy usage based on real-time data. The low response time is crucial for ensuring grid stability and optimizing energy resources during high demand periods [27]. The utilization of machine learning strategies, past data, weather predictions, and real-time data from smart meters contributes to the system’s ability to accurately predict demand and adjust energy usage promptly.
5 Conclusion and Future Work
In conclusion, the development of a smart demand response (DR) system utilizing machine learning strategies has shown promising results in addressing the challenges of peak demand and optimizing energy usage in smart grids. The observed outcomes, including peak demand reduction, energy savings, environmental consequences, response time, and energy-saving performance, provide valuable insights into the effectiveness of different DR methods. This study aims to develop a smart DR system that predicts and adjusts energy usage proactively. RL-GAN techniques estimate peak demand using past data and weather predictions. Real-time data from smart meters and sensors help meet projected demand. The system’s flexibility is tested through various scenarios. Several indicators, including peak demand reduction (80.04%), energy savings (38.09% of average energy in kilowatt-hours), and response time (average: 0.33 seconds), evaluate the system’s performance. The results demonstrate the system’s superiority, with higher peak demand reduction, significant energy savings, and shorter response times compared to other methods. The suggested smart DR system can potentially improve smart grids by maximizing the use of readily accessible resources and mitigating the effects of peak demand.
The future investigation deals with the integration of renewable energy sources, such as solar and wind, into the smart DR system. Moreover, we planned to assess the impact of renewable energy generation on peak demand reduction and energy savings, and develop strategies to optimize their utilization in conjunction with DR.
References
[1] Tiwari, R. S., Kumar, R., Gupta, O. H., and Sood, V. K. (2023). Dynamic Analysis of VSC-HVDC System with Disturbances in the Adjacent AC Networks. Distributed Generation & Alternative Energy Journal. https://doi.org/10.13052/dgaej2156-3306.3853.
[2] Aleksic, S., and Mujan, V. (2018). Exergy cost of information and communication equipment for smart metering and smart grids. Sustainable Energy, Grids and Networks, 14, 1–11. https://doi.org/10.1016/j.segan.2018.01.002.
[3] Chippada, D., and Reddy, M. D. (2023). Optimal Placement and Sizing of Renewable and Non-Renewable Resources in Smart Grid. Distributed Generation &Amp; Alternative Energy Journal, 38(03), 1033–1054. https://doi.org/10.13052/dgaej2156-3306.38314.
[4] Anderson, R. N., Boulanger, A., Powell, W. B., and Scott, W. (2011). Adaptive Stochastic Control for the Smart Grid. Proceedings of the IEEE, 99(6), 1098–1115. https://doi.org/10.1109/jproc.2011.2109671.
[5] Bahrami, S., and Sheikhi, A. (2015). From Demand Response in Smart Grid Toward Integrated Demand Response in Smart Energy Hub. IEEE Transactions on Smart Grid, 1–1. https://doi.org/10.1109/tsg.2015.2464374.
[6] Clement, K., Haesen, E., and Driesen, J. (2009). Coordinated charging of multiple plug-in hybrid electric vehicles in residential distribution grids. IEEE PES Power Systems Conference and Exposition. https://doi.org/10.1109/psce.2009.4839973.
[7] Pandey, Y., Hasan, N., Husain, M. A., Khan, A. N., Bakhsh, F. I., Minai, A. F., and Tabrez, M. (2022). An Environment Friendly Energy-Saving Dispatch Using Mixed Integer Linear Programming Relaxation in the Smart Grid with Renewable Energy Sources. Distributed Generation & Alternative Energy Journal, 37(4), 1239–1258. https://doi.org/10.13052/dgaej2156-3306.37414.
[8] Zhang, Q. (2021). Research on Grid Connected Optimization Scheduling of Micro-grid Utilizing on Improved Bee Colony Method. Distributed Generation &Amp; Alternative Energy Journal, 37(1), 23–40. https://doi.org/10.13052/dgaej2156-3306.3712.
[9] GEFCom2014.zip. (n.d.). Dropbox. Retrieved May 19, 2023, from https://www.dropbox.com/s/pqenrr2mcvl0hk9/GEFCom2014.zip?dl=0.
[10] GridLAB-D Simulation Software. (n.d.). Www.gridlabd.org. https://www.gridlabd.org/
[11] Hong, T., Pinson, P., Fan, S., Zareipour, H., Troccoli, A., and Hyndman, R. J. (2016). Probabilistic energy forecasting: Global Energy Forecasting Competition 2014 and beyond. International Journal of Forecasting, 32(3), 896–913. https://doi.org/10.1016/j.ijforecast.2016.02.001.
[12] Hossain, E., Khan, I., Un-Noor, F., Sikander, S. S., and Sunny, Md. S. H. (2019). Application of Big Data and Machine Learning in Smart Grid, and Associated Security Concerns: A Review. IEEE Access, 7, 13960–13988. https://doi.org/10.1109/access.2019.2894819.
[13] Ibars, C., Navarro, M., and Giupponi, L. (2010). Distributed Demand Management in Smart Grid with a Congestion Game. https://doi.org/10.1109/smartgrid.2010.5622091.
[14] Natarajan, R., Lokesh, G. H., Flammini, F., Premkumar, A., Venkatesan, V. K., and Gupta, S. K. (2023). A Novel Framework on Security and Energy Enhancement Based on Internet of Medical Things for Healthcare 5.0. Infrastructures, 8(2), 22.
[15] Judge, M. A., Khan, A., Manzoor, A., and Khattak, H. A. (2022). Overview of smart grid implementation: Frameworks, impact, performance and challenges. Journal of Energy Storage, 49, 104056. https://doi.org/10.1016/j.est.2022.104056.
[16] Kakran, S., and Chanana, S. (2018). Smart operations of smart grids integrated with distributed generation: A review. Renewable and Sustainable Energy Reviews, 81, 524–535. https://doi.org/10.1016/j.rser.2017.07.045.
[17] Kishore, S., and Snyder, L. H. (2010). Control Mechanisms for Residential Electricity Demand in SmartGrids. https://doi.org/10.1109/smartgrid.2010.5622084.
[18] Lars Mescheder, Nowozin, S., and Geiger, A. (2017). The numerics of GANs. 30, 1823–1833.
[19] Liang, H., Bong Gill Choi, Zhuang, W., and Shen, X. (2012). Towards optimal energy store-carry-and-deliver for PHEVs via V2G system. https://doi.org/10.1109/infcom.2012.6195538.
[20] Baseer, M. A., Vinoth Kumar, V., Izonin, I., Dronyuk, I., Velmurugan, A. K., and Swapna, B. (2023). Novel Hybrid Optimization Techniques to Enhance Reliability from Reverse Osmosis Desalination Process. Energies, 16(2), 713.
[21] Lu, R., and Hong, S. H. (2019). Incentive-based demand response for smart grid with reinforcement learning and deep neural network. Applied Energy, 236, 937–949. https://doi.org/10.1016/j.apenergy.2018.12.061.
[22] Mohsenian-Rad, A.-H., Wong, V. W. S., Jatskevich, J., Schober, R., and Leon-Garcia, A. (2010). Autonomous Demand-Side Management Based on Game-Theoretic Energy Consumption Scheduling for the Future Smart Grid. IEEE Transactions on Smart Grid, 1(3), 320–331. https://doi.org/10.1109/TSG.2010.2089069.
[23] O’Neill, D., Levorato, M., Goldsmith, A., and Mitra, U. (2010). Residential Demand Response Using Reinforcement Learning. https://doi.org/10.1109/smartgrid.2010.5622078.
[24] Pecan-Street-dB. (2022, August 16). GitHub. https://github.com/su-smart-grid-research-center/Pecan-Street-dB.
[25] Pedrasa, M. A. A., Spooner, T. D., and MacGill, I. F. (2010). Coordinated Scheduling of Residential Distributed Energy Resources to Optimize Smart Home Energy Services. IEEE Transactions on Smart Grid, 1(2), 134–143. https://doi.org/10.1109/tsg.2010.2053053.
[26] Venkatesan, V. K., Izonin, I., Periyasamy, J., Indirajithu, A., Batyuk, A., and Ramakrishna, M. T. (2022). Incorporation of Energy Efficient Computational Strategies for Clustering and Routing in Heterogeneous Networks of Smart City. Energies, 15(20), 7524.
[27] Raghunath, K. M. K., and Rengarajan, N. (2017). Response time optimization with enhanced fault-tolerant wireless sensor network design for on-board rapid transit applications. Cluster Computing, 22(S4), 9737–9753. https://doi.org/10.1007/s10586-017-1473-4.
[28] Saber, A. Y., and Venayagamoorthy, G. K. (2011). Plug-in Vehicles and Renewable Energy Sources for Cost and Emission Reductions. IEEE Transactions on Industrial Electronics, 58(4), 1229–1238. https://doi.org/10.1109/tie.2010.2047828.
[29] Siano, P. (2014). Demand response and smart grids – A survey. Renewable and Sustainable Energy Reviews, 30, 461–478. https://doi.org/10.1016/j.rser.2013.10.022.
[30] Uhlir, I., and Danecek, M. (2016). Dynamic Grid Stability: Technology and Solutions Leading to Smart Grid Technologies. IFAC-PapersOnLine, 49(27), 348–351. https://doi.org/10.1016/j.ifacol.2016.10.716.
[31] Wu, C., Mohsenian-Rad, H., and Huang, J. (2012). Vehicle-to-Aggregator Interaction Game. IEEE Transactions on Smart Grid, 3(1), 434–442. https://doi.org/10.1109/tsg.2011.2166414.
[32] Yan, Y., Qian, Y., Sharif, H., and Tipper, D. (2013). A Survey on Smart Grid Communication Infrastructures: Motivations, Requirements and Challenges. IEEE Communications Surveys and Tutorials, 15(1), 5–20. https://doi.org/10.1109/surv.2012.021312.00034.
[33] Zhang, D., Han, X., and Deng, C. (2018). Review on the research and practice of deep learning and reinforcement learning in smart grids. CSEE Journal of Power and Energy Systems, 4(3), 362–370. https://doi.org/10.17775/cseejpes.2018.00520.
Biographies

SwornaKokila M L was born in Kanyakumari, India, on April 29,1982. She received her B.E. degree Computer Science and Engineering from and M.E. degree in Computer Science and Engineering from ManonmaniumSundaranar University, Tirunelveli, India, in 2004 and 2008. Currently she is working as an Assistant Professor in Department of Computing Technology, SRM Institute of Science and Technology, Tamilnadu, India. Her current research interests include Image Processing, video surveillance, Machine Learning, Deep learning and Computer vision. She is a Life Member of the Indian Society for Technical Education (ISTE).

Venkatarathinam R is currently working as Professor in the Department of Information Technology and Vice principal at SBC Engineering College, India. He received his PhD Degree from Dr. M.G.R Educational and Research Institute. His research areas of interest are Mobile Computing, Computer Networks and Internet of Things. He has published more than 10+ Journals in Scopus and SCI indexed journals. He also attended and conducted several faculty development programs in recent technologies.

Rose Bindu Joseph P is currently working as an Associate Professor in the Department of Mathematics at Christ Academy Institute for Advanced Studies, Bangalore. She received her Ph.D. in Mathematics from VIT University, Vellore in the field of Interval Type-2 Fuzzy Theory. She has qualified NET for lectureship by CSIR-UGC. She holds a Master’s degree and bachelor’s degree in Mathematics from Mahatma Gandhi University, Kerala. She has more than 15 years of experience in academia and research. She has published more than 15 research papers in Scopus indexed journals and presented papers in many international conferences. Her research interests include fuzzy theory, machine learning, soft computing and artificial intelligence.

M. A. Manivasagam received the B.E. Degree from Computer Science and Engineering Discipline, University of Madras, the M.E. Degree in Computer Science and engineering from Anna University and Ph.D. Degree from the Computer Science and engineering discipline, St.Peter’s Institute of Higher education and Research, India, 2019. He is currently a Professor in the Department of Computer Science and Engineering, Siddartha Institute of Science and Technology, Andhra Pradesh, India. His research interests include real time applications in Wireless Sensor Networks, the Internet of Things, Artificial Intelligence and Machine Learning.

Kakarla Hari Kishore was born in Vijayawada, Andhra Pradesh, India. He received B.Tech (ECE) from JNTUH, M.Tech from SK University, A.P, India. He received his PhD in the field of VLSI from K L University, India. He received his Postdoctoral Fellowship (PDF) in Malaysia. He is working as Professor in ECE. He has published 4 IEEE Transactions and more than 130 research articles published in International Journals/Conferences. He has filled 07 patents and published 3 Textbooks. He had received several awards like the International Book of Records and the Indian Book of Records for the highest number of citations and H-index in Scopus/WoS. He is Editorial Board Member/Reviewer for several International Journals/Conferences. His research interests include VLSI Design, Fault Tolerance and Digital Testing, and SoC. He is a life member of ISTE, IE, IACSIT and IAENG.
Distributed Generation & Alternative Energy Journal, Vol. 39_1, 111–136.
doi: 10.13052/dgaej2156-3306.3915
© 2023 River Publishers