Identification of High and Low Voltage Ride-Through Control Parameters for Electromechanical Transient Modeling of Photovoltaic Inverter
Chen Jianjie1,*, Zhao Bo1, Zhang Fang1, Hu Juan2 and Zhang Li1
1Automatization Engineering College, Beijing Information Science & Technology University, Haidian 100192, Beijing, China
2China Electric Power Research Institute. Haidian 100192, Beijing, China
E-mail: chenjianjie1119@163.com
*Corresponding Author
Received 07 September 2023; Accepted 03 November 2023; Publication 31 January 2024
Abstract
The electromechanical transient model of a photovoltaic (PV) inverter’s high and low voltage ride-through has complex operating circumstances and a large number of control parameters, which makes parameter adjustment difficult. Furthermore, it is frequently challenging to identify a single set of control parameters that can successfully handle a variety of operating conditions. The Improved Differential Evolution Particle Swarm Optimization (IDEPSO) algorithm is proposed in this paper to provide a control parameter identification technique for high and low voltage ride-through that addresses these problems. Taking a 320kW PV inverter of a certain company as the research object, based on the specified current control strategy of high and low voltage ride-though, the parameters to be identified were determined by analyzing the influence of model parameters. Secondly, To enhance the algorithm’s capability to solve multidimensional optimization problems, convergence speed, and global search ability, the Differential Evolution (DE) algorithm’s search mechanism is incorporated into the Particle Swarm Optimization (PSO) algorithm, along with a non-fixed gradient inertia weight strategy for the algorithm’s inertia weight and the elite retention idea for the cross factor. Then, the objective function of the IDEPSO algorithm was built based on the concept of minimum deviation between simulation data and various groups of test data, and the significance of various working conditions was distinguished by weight division to improve the robustness of identification parameters. Finally, the identification parameters are imported into the PSASP program type 2 photovoltaic power station model, and the interval division and deviation calculation of the test data and simulation data are carried out. It is confirmed that the identification parameters meet the standards of the maximum variation permitted in GB/T 32892-2016 and are appropriate for a variety of working scenarios.
Keywords: Photovoltaic inverter’s electromechanical transient model, high-low voltage ride-through, specified current control strategy, identification of control parameters, IDEPSO.
1 Introduction
The high and low voltage ride-through control parameters, which are included in the model parameters with the inverter, are a crucial consideration when analyzing the dynamic response characteristics of the inverter. The accuracy of the PV grid-connected inverter, which serves as the hub connecting the PV modules to the grid, depends on the accuracy of the model parameters obtained [1]. However, due to various reasons, it is usually impossible to accurately obtain the high and low voltage ride-through control parameters, so there is an urgent need to find an effective identification method to realize the accurate identification of the high and low voltage ride-through control parameters, in order to obtain the high and low voltage ride-through performance of PV inverters under different operating conditions [2].
At present, theoretical study, numerical computation, and intelligent optimization algorithms are the main methodologies used for parameter identification in PV power plant models. Among them, the theoretical analysis method is based on the PV system’s operational mechanism, which relates the electrochemical process to the circuit’s components in the equivalent model, and determines the model’s unknown parameters through differential derivation of the V-I characteristic curve, etc. But when PV system structures become more intricate, it becomes much more difficult to calculate using theoretical analysis methods, which reduces the precision of parameter identification [3, 4]. Currently, numerical computation and intelligent optimization algorithms are often used for parameter identification, the essence of which is to make the simulation curve output from the model as close as possible to the measured curve by iterative means, so as to find the optimal solution of the model parameters [5–14]. The most commonly used method of numerical computation is the least squares method [5], and the commonly used methods of intelligent optimization algorithms are particle swarm algorithm [6], genetic algorithm [7], differential evolutionary algorithm [8] and so on. Literature [9] addresses the problems of low accuracy and poor stability of parameter identification in the current PV module model, and incorporates the differential evolution (DE) mechanism and refractive learning mechanism into the manta ray optimization (MRFO) algorithm in order to improve the local exploration ability, convergence speed, discretization, and global search ability of the manta ray optimization algorithm; Literature [10] in order to obtain more accurate parameters of the transient model of the PV inverter, the PSASP and Matlab joint simulation platform is established and particle swarm (PSO) algorithm is utilized to identify the PV inverter control parameters. Literature [11] in order to improve the optimization accuracy and reliability of PV load model parameter identification, the flight inertia weights, global optimal point perturbation and flight disturbance factor are introduced into the butterfly algorithm, which optimizes the performance of the butterfly algorithm in the process of parameter identification; Literature [12] for the purpose of analyzing the impact of the inverter’s LV ride-through characteristics on the power grid, a generalized method of testing the parameters of the AC current command link is proposed, which sequentially identifies the reactive current and the reactive current and the reactive current. The parameters of reactive and active current command equations are recognized sequentially, and the accuracy of the parameters is verified by substituting them into the simulation model. In terms of parameter identification of PV power plant model, the existing literature mostly focuses on the parameter identification of PV modules, PV grid-connected inverter normal operation control link and PV load model, and there is only a small amount of literature on the identification of LV ride-through control parameters, and there is even less research on the identification of high-voltage ride-through control parameters corresponding to LV ride-through [13, 14]. Although the parameter identification of PV power plant models is relatively perfect, there is a lack of studies and interpretations on the identification of high and low voltage ride-through control parameters.
This paper proposes a method of high and low voltage ride-through control parameter identification, because the high and low voltage ride-through operating conditions of the PV inverter electromechanical transient model are complex, the control parameters are difficult to adjust, and it is easy to appear that a set of control parameters can not satisfy the problems of multiple operating conditions. The algorithm adopts a non-fixed gradient inertia weight strategy for the inertia weights in the algorithm, adopts the idea of retaining elites in the crossover factors, and introduces real number coding, simple mutation operation, and “one-to-one” competitive survival strategy from DE algorithm into PSO algorithm in order to improve the ability of PSO algorithm to solve multidimensional optimization problems and to make it have a better convergence speed and a better performance. At the same time, the objective function of the IDEPSO algorithm is built around the concept of minimizing the deviation between the simulation data of the identification parameters and the test data of multiple sets of working conditions in order to make the identification parameters applicable to multiple sets of working conditions. Finally, a simulation model with the same capacity and parameters as the test system was established in PSASP real-time simulation software, and the operating conditions and perturbations consistent with the test were set up for simulation, and the interval division and deviation calculation of the test data and simulation data were carried out to verify the accuracy of the identification parameters.
2 Modeling and Control of PV High-Low Voltage Ride-Through
2.1 Overall Structure of the PV Plant Model
The overall structure of the type 2 PV plant model in the PSASP software is shown in Figure 1. The PV array model, the Station-level control model, the voltage ride-through state judgment model, the converter control model, the current limiting model, and the converter model should all be included in the electromechanical transient model of the PV plant [15].
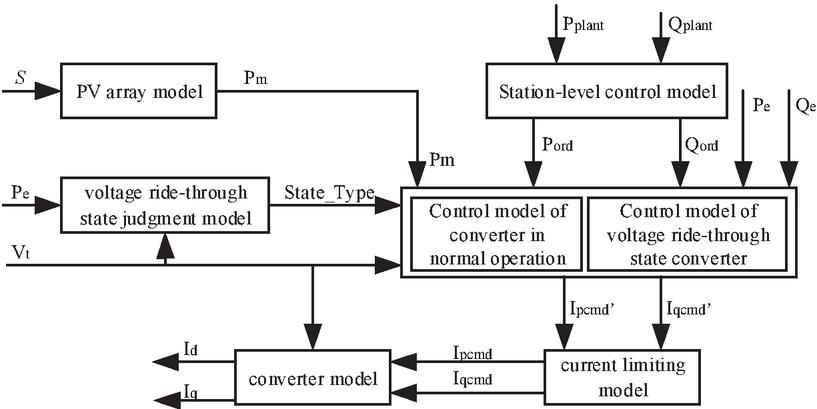
Figure 1 Type 2 photovoltaic power station model.
Among them, the PV array model is used to simulate the operation state of PV cells; the plant and station level control model tracks the grid frequency through frequency sag control to realize the function of grid frequency regulation; the voltage ride-through state judgment model judges whether the PV system enters into the high and low voltage ride-through state through real-time collection of extreme voltage to realize the switching between normal operation control and voltage ride-through operation control; the converter control model is divided into normal operation state and voltage ride-through state, realizing normal operation control and voltage ride-through operation control of the converter; the current limitating model can set the current priority mode under normal operation state or fault ride-through state, and if active or reactive current priority is selected, active or reactive current output will be guaranteed firstly; the converter model converts the active current and reactive current control commands into active current and reactive current [16–20].
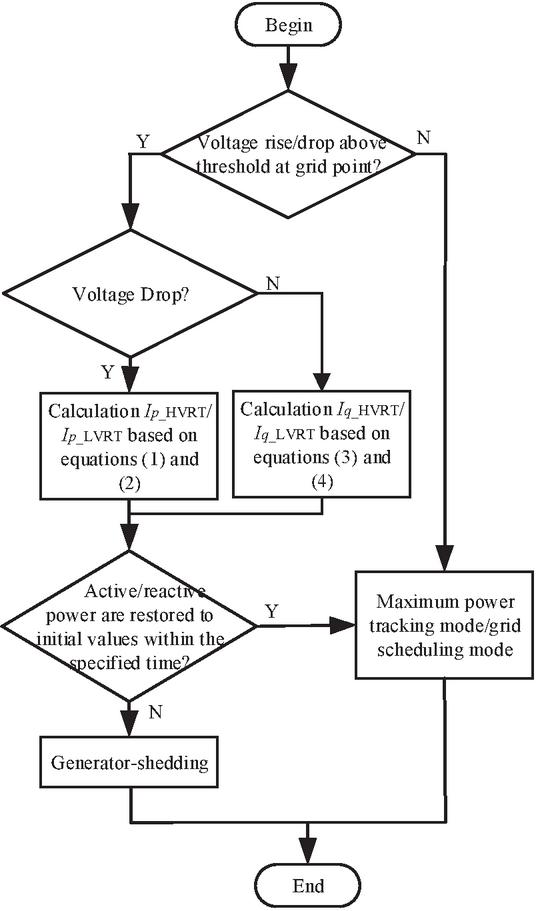
Figure 2 High and low voltage ride-through control.
2.2 Control and Modeling of Photovoltaic High-Low Voltage Ride-Through
High and low voltage ride-through capability as an important index to assess the performance of PV power station system, according to GB 19964-2012 “PV power station access to the power system technical regulations” requirements, when the power system accident or disturbance caused by the PV power generation system grid point voltage change, in a certain voltage change range and time interval, the PV power station to ensure that the continuous normal operation without off-grid, and grid voltage dips in the process of providing reactive current support [21].
The high and low voltage ride-through control flowchart is shown in Figure 2. When the grid voltage is within the normal range, the grid-side inverter adopts the maximum power tracking mode or is controlled according to the grid scheduling instruction, and gives priority to controlling the active power, i.e., when the amplitude of the active current and reactive current is limited at the same time, the active current is given priority to satisfy the active current demand. When there is a fault in the system that makes the machine-end voltage of the PV power station higher or lower than a certain threshold, the PV power station will enter the high and low voltage ride-through process, and the control mode changes from active priority to reactive priority current control, in order to inhibit the overcurrent of the inverter, the PV generator will make the output active current decrease rapidly through the control system. After the end of the high and low voltage ride-through process, the active output of the PV generator is required to quickly recover to the pre-fault level at a certain rate [22].
When the voltage at the grid point is in the range of 0.20.9 p.u., the PV power station will enter the low-voltage ride-through(LVRT) state, and the reactive current control instructions for the LVRT process are:
| (1) |
Where: K and K are reactive current control coefficients for the LVRT; u is the grid point voltage; I is the initial reactive current; I is reactive current set value for the LVRT; and 0.9 is the threshold value of crossing voltage for the LVRT.
The active current control instructions for the LVRT process are:
| (2) |
Where K and K are active current control coefficients for the LVRT; I is the initial active current; and I is active current set value for the LVRT.
When the voltage at the grid point is in the range of 1.11.3 p.u., the PV power station will enter the high voltage ride-through(HVRT) state, and the reactive current control instructions for the HVRT process are:
| (3) |
Where K and K are reactive current control coefficients for the HVRT; I is reactive current set value for the HVRT; and 1.1 denotes the voltage threshold for entering into HVRT.
The active current control instructions for the HVRT process are:
| (4) |
Where K and K are active current control coefficients for the HVRT; I is active current set value for the HVRT.
2.3 Recognizable Parameters for High and Low Voltage Ride-through Control Links
From the above high and low voltage ride-through active current control and reactive current control expressions, it can be seen that, in addition to the grid point voltage u, the initial active current I, the initial reactive current I, can be obtained through the field test data for the interception, standardization and transformation of the coordinates of the way. The rest of the parameters are unknown, due to the confidentiality of the manufacturer or the change of the operating conditions and other circumstances, it is generally not possible to accurately obtain the values of these parameters. Taking the type 2 PV plant in the PSASP software as an example, different control parameters are set in the high and low voltage ride-through control link to investigate the influence of high and low voltage control parameters on active and reactive currents.
In the simulation calculation, according to the typical working conditions of high and low voltage ride-through, three-phase drop occurs in LVRT condition with P 0.7Pn. and t (8.17, 10)s, and the voltage drops to 80% U; three-phase rise occurs in HVRT condition with P 0.7Pn, and the voltage rises to 130% U in the t (9.27, 9.77)s. In the analysis of LVRT active control parameter, keeping the reactive power control parameters unchanged in the LVRT and setting K and K to be selected as 0, 0.5, and 1, respectively, and I, the effect of the change of the active current coefficient on the active current is shown in Figure 3. From Figure 3, it can be seen that with the increase of K and K, the amplitude of the active current during the LVRT increases gradually, and the active current recovery time is shorter.
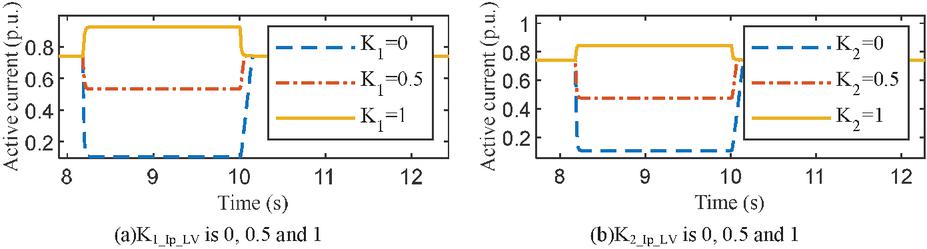
Figure 3 Waveform of active current variation when active current coefficients are different.
When analyzing the LVRT reactive control parameters, the active control parameters in LVRT are kept unchanged, because the high and low voltage ride-through links need to provide a certain amount of reactive current support when the grid voltage dips or rises, and the value of K will be large in general, therefore, the K is set to be selected as 1.5, 2, 2.5, and the K as 0, 0.5, 1, and I, and the effect of reactive current coefficient change on reactive current is shown in Figure 4. From Figure 4, it can be seen that the amplitude of reactive current during LVRT increases gradually with the increase of K and K, where the increase of K results in a larger transient overcurrent during recovery.
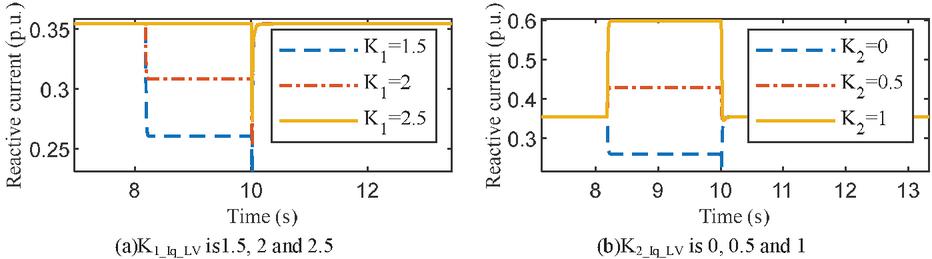
Figure 4 Waveform of reactive current variation when reactive current coefficients are different.
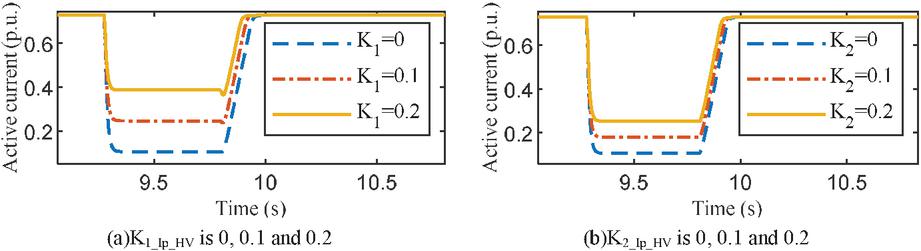
Figure 5 Waveform of active current variation when active current coefficients are different.
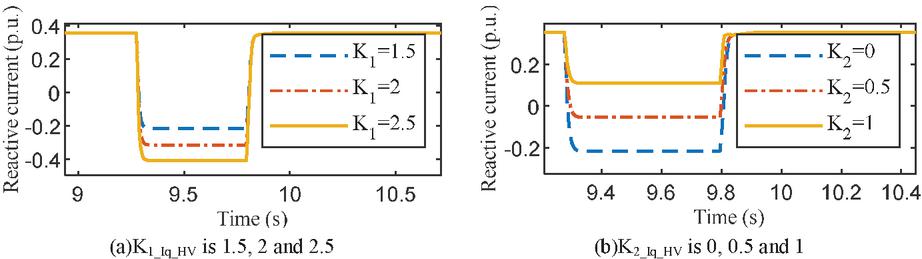
Figure 6 Waveform of reactive current variation when reactive current coefficients are different.
Similarly, to analyze the high voltage ride-through control parameters, due to the limitation of output current by the current limitation model, the value of HVRT active coefficient should not be too large, otherwise it is not possible to distinguish the influence of active current coefficient change on active current, so K and K are selected as 0, 0.1, 0.2 respectively, and the influence of HVRT active or reactive current coefficient change on active or reactive currents is shown in Figures 5 and 6. With the increase of K and K, the amplitude of active current during the HVRT increases gradually, and the recovery time of active current is shorter. With the increase of K, the amplitude of reactive current during the HVRT decreases gradually, while with the increase of K, the amplitude of reactive current during the HVRT increases gradually.
According to the aforementioned analysis, the high and low voltage ride-through control parameters are significant elements that are intimately linked to the high and low voltage ride-through performance of PV; as a result, parameter identification of the high and low voltage ride-through control parameters is necessary to accurately obtain the high and low voltage ride-through control parameters required by the simulation model.
3 Model Parameter Identification Based on IDEPSO Algorithm
The PSO algorithm is easy to use and quickly converges, but in the later stages of parameter identification for nonlinear, multi-polar, complex systems, it is prone to bounce about the best solution and fall into local optima [23]. The DE algorithm is able to dynamically track the current search situation and modify its search strategy in real time by virtue of its unique memory capability, and it does not need to rely on the feature information of the problem, which makes the algorithm more robust, but the DE algorithm is slower to converge in the later stage [24]. Combining the advantages of PSO and DE algorithms, this paper introduce real number coding, simple mutation operation and “one-to-one” competitive survival strategy into the PSO algorithm, and optimize the hyperparameters in the algorithm to obtain an IDEPSO algorithm with better overall performance.
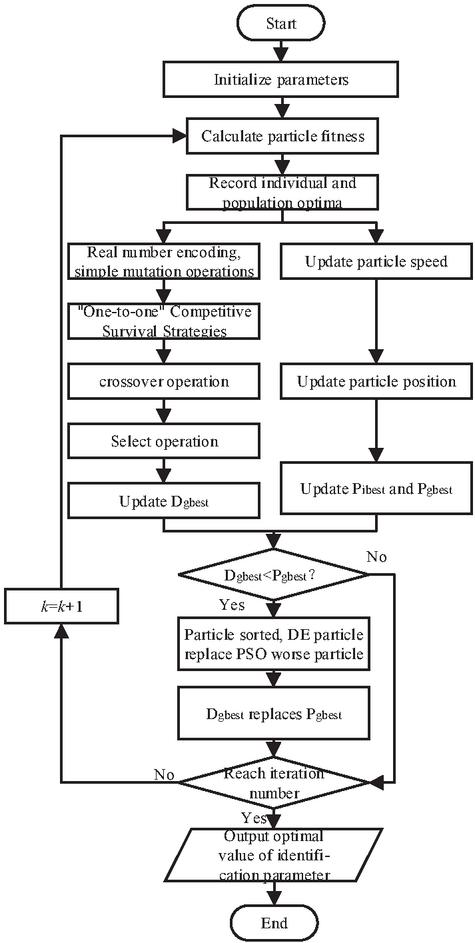
Figure 7 IDEPSO algorithm identification strategy flow.
3.1 IDEPSO Algorithm
The IDEPSO algorithm identification strategy flow is shown in Figure 7, and its specific steps are as follows:
(1) Setting the population size, dimension, range of values for particle positions and velocities, number of iterations, inertia weights, learning factors, and crossover and mutation operators to initialize the initial positions and velocities of the population;
(2) Calculate the fitness values of the individuals in the population and record individual optimum and global optimum;
(3) particles into the PSO algorithm search mechanism and the DE algorithm search mechanism, respectively:
(a) PSO algorithm search mechanism: the particle generates new velocity and new position according to Equations (5) and (6), and calculates the fitness value to update the individual optimal P and population optimal P;
| (5) | |
| (6) |
Where, v is the velocity of particle s; k is the number of iterations; w is the inertia weight; c, c are the learning factors; r, r are two random numbers on [0,1]; x is the current position of particle s; y is the individual best position of particle s; y is the current best position of the particle.
(b) DE algorithm search mechanism: in the first step, real numbers are encoded, simple mutation operation is performed according to Equation (7); in the second step, in order to increase the diversity of the population, binomial distribution hybridization is performed on the mutated individuals according to Equation (8); in the third step, the selection operation adopts a greedy strategy, i.e., the resulting offspring individuals are retained only if they are better than the parent individuals, otherwise the parent individuals are retained to the next generation. And the fitness value is calculated to update the population optimal D;
| (7) | |
| (8) |
where h is the new individual after mutation and F is the mutation factor; p1, p2, and p3 are random integers with ; l is a random number between [0,1]; and CR is the crossover probability.
(4) Compare the size of fitness values of P and D, if D, then the two populations of particles are sorted according to the size of the fitness values, and replace the poorer particles of PSO with the better particles of DE, and the optimum of the DE population replaces the optimum of the PSO population. Instead, skip to step (5).
(5) Determine whether the search accuracy requirements are met or the maximum number of iterations is reached; if the termination conditions are not met, repeat steps (2) to (4); if the termination conditions are met, output the historical optimal position and the corresponding optimal fitness value.
3.2 Construction of Objective Function and Optimization of Hyperparameters
Since the identification of high and low voltage ride-through control parameters requires multiple sets of working conditions to obtain one set of identification results, the identification results should be applicable to multiple sets of working conditions and meet the requirement of minimizing the deviation between the output values of the simulation model and the actual measured values. Based on the above considerations, the objective function of IDEPSO is constructed. Specifically expressed as:
| (9) |
Where d is the number of working conditions of the test; is the weight of the rth working condition; n is the length of the test data; j is the jth data point; i is the AC side current; and the subscripts sim and meas are the simulated and measured values.
In order to improve the search performance of IDEPSO algorithm, this paper adopts a nonfixed gradient inertia weight strategy for the important parameter inertia weight w that affects the performance of the algorithm, and the cross-factor CR adopts the idea of retaining the elite, so that the algorithm has a strong global search capability while maintaining a certain degree of local search capability. w, CR is updated as follows:
| (10) | |
| (11) |
where w is the average value of the sum of all w’s up to the current iteration; w and w are the minimum and maximum values of inertia weights; is the control factor; k is the current iteration; M is the maximum iteration; J is the fitness value of the current particle s; J and J are the maximum and minimum fitness values of the current population; and CR and CR are the maximum and minimum values of the crossover factor, respectively.
4 Calculus Analysis
A photovoltaic inverter from a certain company is used as the research object to carry out the identification of photovoltaic high and low voltage ride-through control parameters, establish a simulation model in PSASP real-time simulation software with capacity and parameters similar to those of the test system, set up the operating conditions and perturbations consistent with the test to carry out simulation, and carry out the interval division and bias calculation of the test data and the simulation data to calibrate the accuracy of the results of the model identification parameter test.
4.1 Identification of High and Low Voltage Ride-through Control Parameters
Particle positions are used by the IDEPSO identification algorithm to represent the values of the parameters that need to be identified. In order to maintain the performance stability of the algorithm, it is necessary to determine the range of the values of the parameters that need to be identified based on its operating characteristics. The following table shows how the IDEPSO’s initial values were established.
Table 1 Initial value setting of IDEPSO
| Search Scope | |||||||
| 80 | 1.3, 1.7 | [0.4,0.9] | 0.6 | [0.6,0.9] | 20 | [1,1] | [2 2] |
The working conditions of grid point voltage dropping to 0%, 20%, 40%, 60%, and 80% of the rated voltage U and grid point voltage rising to 115% and 130% of the rated voltage U are set during the field test, and data such as active power P, reactive power Q, current i, AC-side voltage U, and DC-bus voltage U of the PV inverter during the period of high and low penetration are measured and recorded. Among them, the voltage drop for 0% of rated voltage test, the response curve did not enter the steady state during the fault due to the excessive depth of the drop and the time of the drop; the voltage drop for 20% of rated voltage test, due to the phase-locked loop, caused the active power to drop below zero; the data that meet the requirements of parameter identification are the data of the voltage drop for 40%, 60%, and 80% of the rated voltage, as well as the data of voltage rise for 115%U, 130%U. Detailed equipment parameters are shown in the Table 2.
Table 2 Detailed equipment parameters
| Parameter | Value |
| DC bus start voltage (V) | 550 |
| Minimum DC bus voltage (V) | 500 |
| Maximum DC bus voltage (V) | 1500 |
| Full-load MPPT voltage range (V) | 8601300 |
| Optimum MPPT operating voltage (V) | 1080 |
| Maximum Input Current (A) | 24*20 |
| DC Bus Capacitor (F) | 2918 |
| Rated output power (kW) | 320 |
| Maximum output power (kW) | 352 |
| Rated grid-side voltage (V) | 800 |
| Rated grid frequency (Hz) | 50 |
| Permissible grid frequency range (Hz) | 4555 |
| Rated output current (A) | 230.9 |
| Maximum AC Output Current (A) | 254 |
| Total current harmonic distortion rate (%) | 3 (Rated power at rated voltage) |
After obtaining the field test data, it is necessary to intercept, standardization and transform the field test data to extract the dq-axis current i and the dq-axis voltage U on the AC side during the high and low ride-through period, and the initial dq-axis current i before the high and low ride-through period, and then identify the control parameters of the high and low ride-through by combining the extracted data with the IDEPSO algorithm. The identification curves and test curves for different operating conditions are shown in Figures 8 and 9.
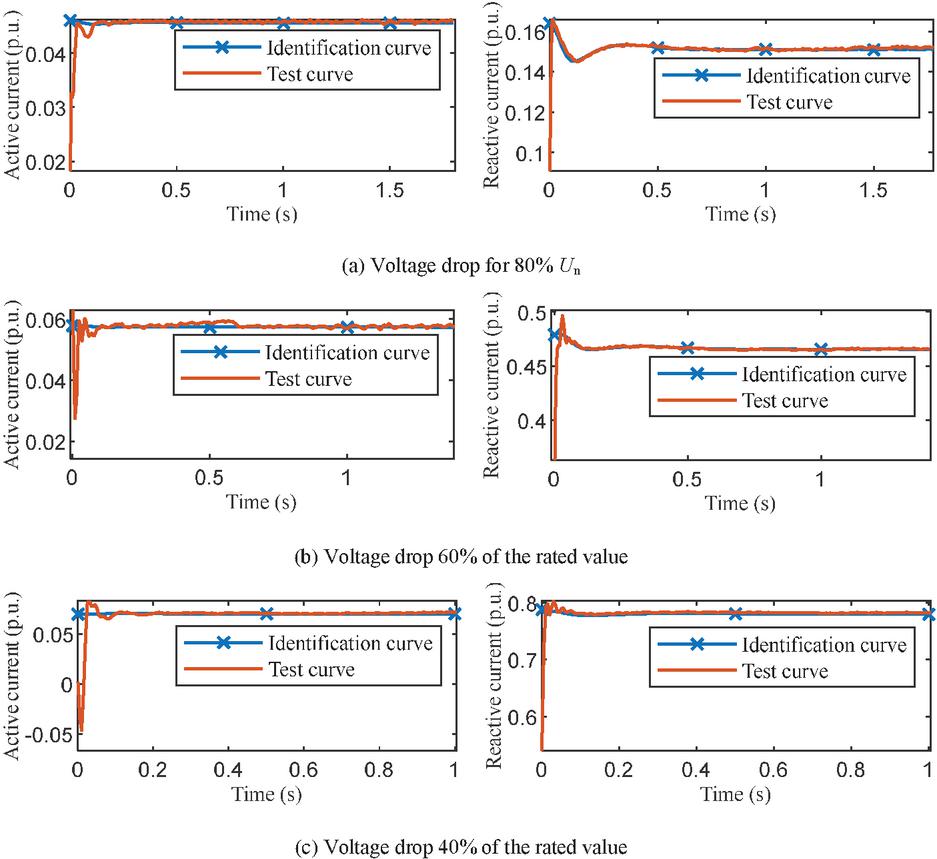
Figure 8 Identification curve and measurement curve based on low voltage crossing test data under different working conditions.
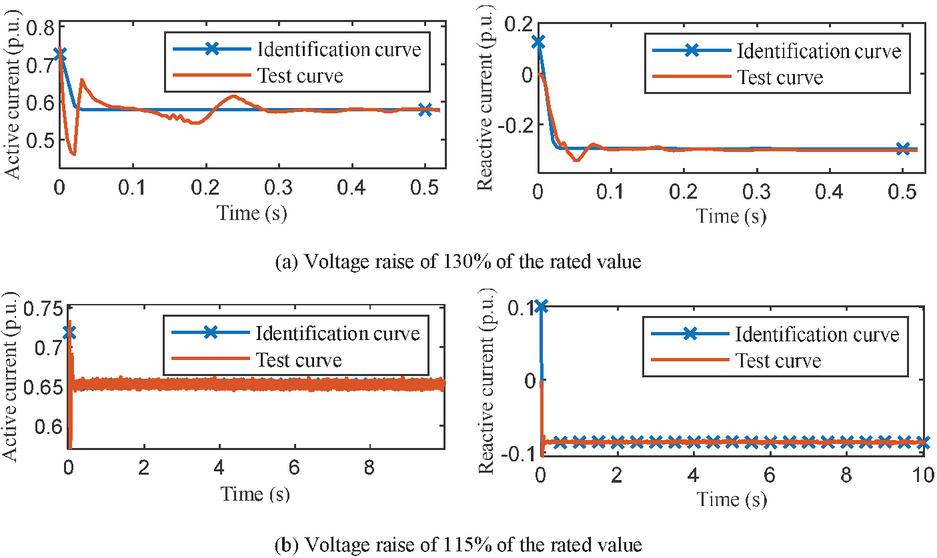
Figure 9 Identification curve and test curve under different working conditions.
As can be seen from Figures 8 and 9, except for the poor approximation of the identification curve to the test curve at the beginning stage of fault fall, the identification curve at the rest of the time is basically consistent with the test curve. The identification results and fitness values of the high and low voltage ride-through control parameters are shown in Table 3.
The DE and PSO algorithms are applied to determine the high and low voltage ride-through control parameters under the same conditions, respectively, to show the superiority of the IDEPSO algorithm. Since these three intelligent algorithms are stochastic search optimization algorithms, each algorithm carries out 10 times of identification, and adopts the method of averaging the results to reduce the random error. The changes of the fitness value of the three algorithms during the identification process are shown in Figure 10, and the results of the number of iterations and the minimum fitness value are shown in Table 4. It can be seen in Figure 10 and Table 4 that, in the process of identifying high and low voltage voltage ride-through control parameters, the convergence speed and global search capability of IDEPSO algorithm are significantly better than PSO algorithm and DE algorithm.
Table 3 Identification result
| Mode | Parameter | Identification Value | J |
| LVRT | K | -0.0552 | 0.0645 |
| K | 0.5668 | ||
| I | -0.3267 | ||
| K | 1.4769 | 0.1139 | |
| K | -0.6473 | ||
| I | -0.0075 | ||
| HVRT | K | -0.4632 | 0.2154 |
| K | 0.5056 | ||
| I | 0.8410 | ||
| K | 1.3207 | 0.1128 | |
| K | 0.9868 | ||
| I | -0.0144 |
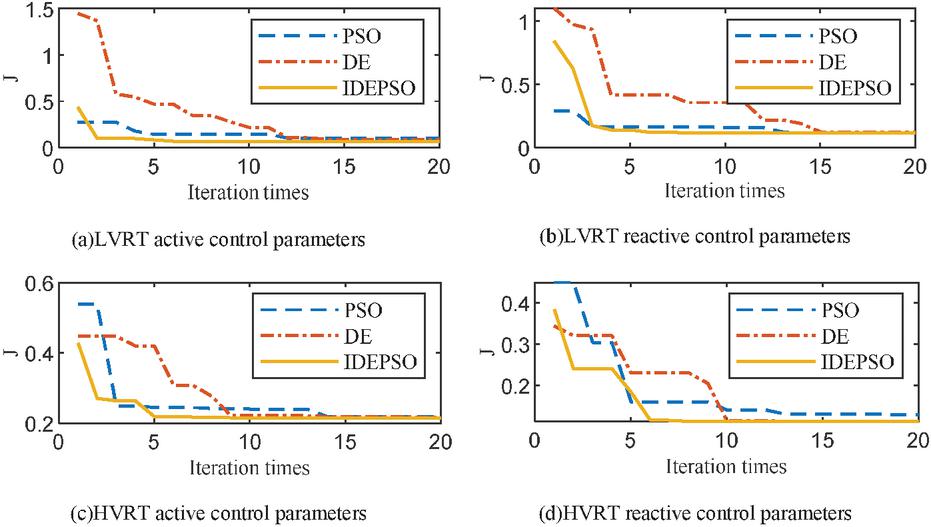
Figure 10 Fitness value change process.
Table 4 Number of iterations and fitness value
| PSO | DE | IDEPSO | |||||
| Control | Iteration | Iteration | Iteration | ||||
| Mode | Mode | Times | J | Times | J | Times | J |
| LVRT | Active | 12 | 0.1034 | 14 | 0.0887 | 6 | 0.0645 |
| Reactive | 14 | 0.1184 | 15 | 0.1213 | 8 | 0.1139 | |
| HVRT | Active | 14 | 0.2179 | 14 | 0.2171 | 5 | 0.2154 |
| Reactive | 13 | 0.1292 | 13 | 0.1133 | 8 | 0.1128 |
4.2 Simulation Verification of Identification Results
In order to calibrate the accuracy of the idetification results of the model parameter, the identified parameters are substituted into the Type 2 PV power plant model in the PSASP software, the operating conditions consistent with the test are set for simulation, and the interval division and deviation calculation is done on the test data and the simulation data. The electrical quantities calibrated include voltage, active power, reactive power, active current and reactive current.
The high and low voltage ride-through process is divided into three time periods by the green dash-dotted line, A (before fault), B (during fault) and C (after fault) with reference to the base wave positive sequence voltage. According to the response characteristics of active and reactive power, the B time period is divided into the intervals of B (transient) and B (steady state) by the green dash-dotted line, and the C time period is divided into the intervals of C (transient) and C (steady state) by the green dash-dotted line. For the detailed interval division process, see GB/T 32892-2016 “PV power generation system model and parameter testing protocol”. Due to space reasons, Figure 11 only shows the comparison between the test curve(solide line) and simulation curve(dotted line) and the division of intervals under the voltage drop to 40%U and 80%U conditions. It can be seen that in the last period of the LVRT recovery phase, i.e., near the location of the recovery fault start point, when the control mode is switched from voltage ride-through operation control to normal operation control, which leads to a large deviation between the test data and the simulation data, the dynamic behaviours of the simulation model in other LVRT periods match well with the field results.
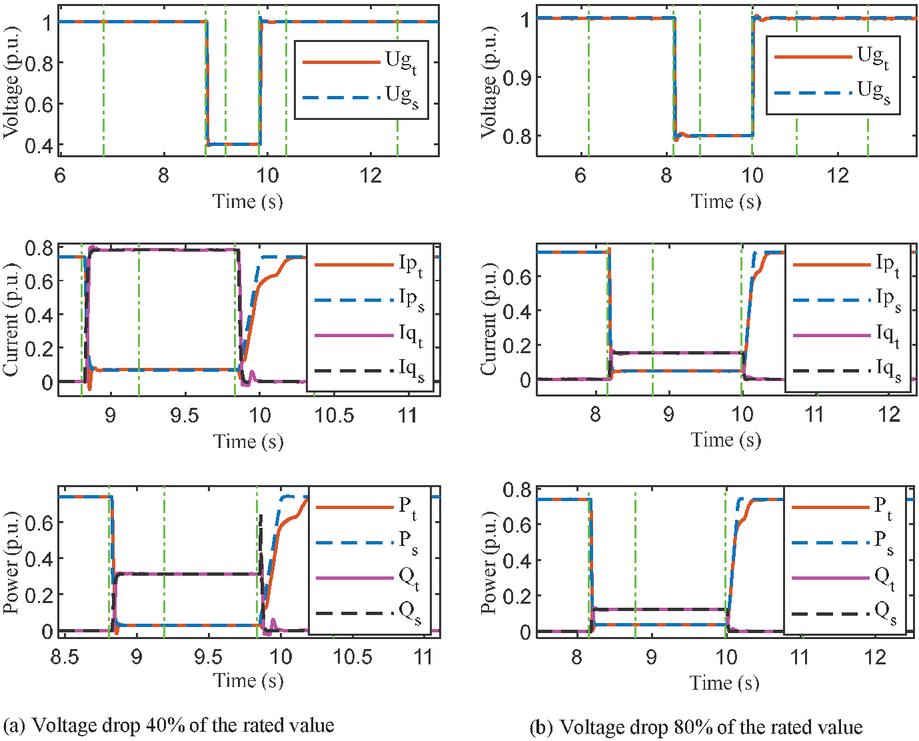
Figure 11 Low voltage crossing test and simulation waveform.
After the division of data zones, the deviation of the transient and steady state intervals should be calculated separately for each time period. The average deviation (F) is calculated for the transient interval of each time period, and the average deviation (F) and the maximum deviation (F) should be calculated for the steady-state interval, and finally the weighted average total deviation (F) of the whole voltage ride-through process is calculated, and the detailed calculation formula is referred to the GB/T 32892-2016 “PV Power Generation System Model and Parameter Testing Procedures”. The calculation results of the deviation between test and simulation data under voltage drop to 40%U and 80%U conditions are shown in Table 5.
Table 5 Deviation calculation result
| F/p.u. | F/p.u. | F/p.u. | F/p.u. | |||||
| Parameter | 80% | 40% | 80% | 40% | 80% | 40% | 80% | 40% |
| AC voltage, U/U | 0.0012 | 0.0012 | 0.0023 | 0.0148 | 0.0015 | 0.0016 | 0.0020 | 0.0085 |
| Active current, i/i | 0.0007 | 0.0019 | 0.0190 | 0.0610 | 0.0024 | 0.0028 | 0.0057 | 0.0148 |
| Reactive current, i/i | 0.0001 | 0.0004 | 0.0023 | 0.0184 | 0.0027 | 0.0021 | 0.0011 | 0.0074 |
| Active power, P/P | 0.0011 | 0.0008 | 0.0197 | 0.0626 | 0.0033 | 0.0020 | 0.0058 | 0.0162 |
| Reactive power, Q/Qn | 0.0001 | 0.0005 | 0.0019 | 0.0065 | 0.0027 | 0.0012 | 0.0009 | 0.0024 |
Similarly, the comparison of the test and simulation waveforms under the voltage raised to 115%U and 130%U conditions and the division of the intervals are shown in Figure 12. From the figure, it can be seen that the dynamic behaviour of the simulation model is basically consistent with the field results except for the second half of the high voltage ride-through recovery phase, and the reason for the large deviation is the same as that of the low voltage ride-through. The calculated results of the deviation of the test and simulation data under the voltage raised to 115%U and 130%U operating conditions are shown in Table 6.
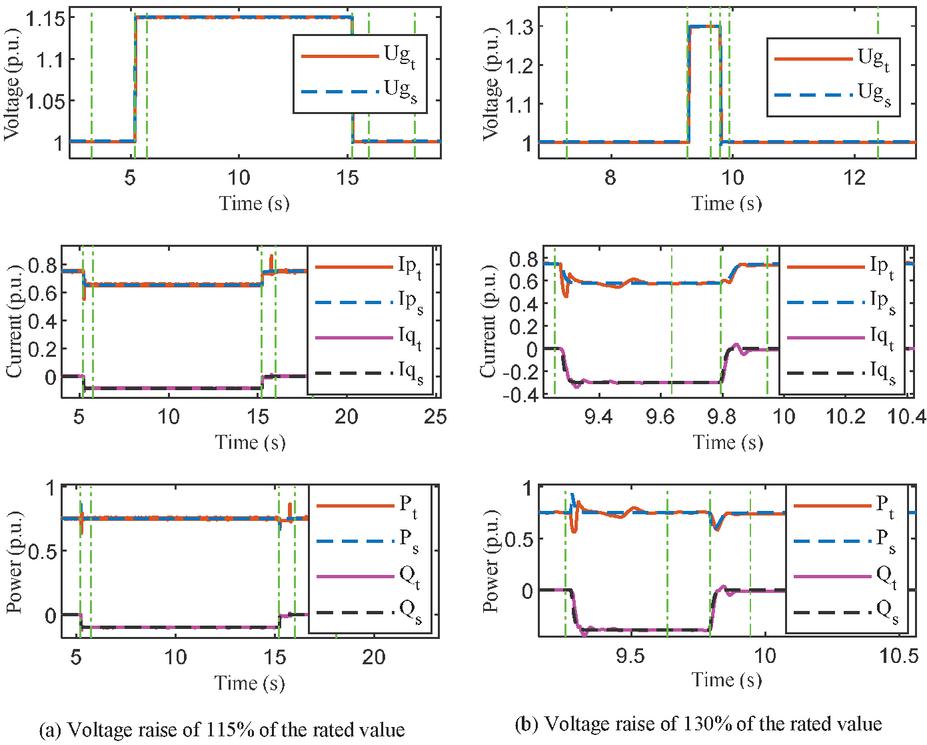
Figure 12 High voltage crossing test and simulation waveform.
Table 6 Deviation calculation result
| F/p.u. | F/p.u. | F/p.u. | F/p.u. | |||||
| Parameter | 115% | 130% | 115% | 130% | 115% | 130% | 115% | 130% |
| AC voltage, U/U | 0.0012 | 0.0011 | 0.0033 | 0.0138 | 0.0014 | 0.0017 | 0.0034 | 0.0044 |
| Active current, i/i | 0.0023 | 0.0019 | 0.0070 | 0.0079 | 0.0135 | 0.1041 | 0.0116 | 0.0029 |
| Reactive current, i/i | 0.0004 | 0.0026 | 0.0077 | 0.0144 | 0.0026 | 0.0122 | 0.0037 | 0.0037 |
| Active power, P/P | 0.0016 | 0.0015 | 0.0066 | 0.0109 | 0.0126 | 0.1036 | 0.0113 | 0.0049 |
| Reactive power, Q/Qn | 0.0005 | 0.0033 | 0.0078 | 0.0178 | 0.0031 | 0.0122 | 0.0042 | 0.0045 |
The deviation calculation results in Tables 5 and 6 are compared with the maximum deviation values allowed by the national standard in Table 7. The results show that all the relevant deviations meet the requirements of GB/T 32892-2016 “Test Procedures for Models and Parameters of Photovoltaic Power Generation Systems”.
Table 7 Maximum allowable deviation
| Parameter | F/p.u. | F/p.u. | F/p.u. | F/p.u. |
| AC voltage, U/U | 0.02 | 0.05 | 0.05 | 0.05 |
| Active current, i/i | 0.10 | 0.20 | 0.15 | 0.15 |
| Reactive current, i/i | 0.10 | 0.20 | 0.15 | 0.15 |
| Active power, P/P | 0.10 | 0.20 | 0.15 | 0.15 |
| Reactive power, Q/Qn | 0.10 | 0.20 | 0.15 | 0.15 |
5 Conclusion
This paper takes a 320 kW photovoltaic inverter from a certain manufacturer as its research object. It then identifies and verifies the photovoltaic inverter’s high-low voltage ride-through control parameters using data from a field high-low voltage ride-through test and a model of a type 2 photovoltaic power station created using the real-time simulation software PSASP. It then comes to the following conclusions:
(1) Through the impact analysis of the high and low voltage control parameters, it is discovered that the high and low voltage ride-through control parameters are significant factors affecting the performance of the high and low voltage ride-through of PV based on the high and low voltage ride-through specified current control strategy.
(2) A high and low voltage ride-through control parameter identification method based on IDEPSO algorithm is proposed to address the identification issues for high and low voltage ride-through control parameters in the electromechanical transient model of a photovoltaic inverter.
(3) By adopting the non-fixed step inertia weights strategy for the inertia weights in PSO algorithm, and by adopting the retained elitist idea for the cross-factors in DE algorithm, it improves the global optimisation ability and convergence speed of the IDEPSO algorithm.
(4) Using the high and low voltage ride-through data from an actual PV inverter, the high and low voltage ride-through control parameters are identified, and the test data and simulation data deviation calculation results demonstrate that the group of identified parameters can be applied to a variety of working conditions and meet the requirements of GB/T 32892-2016 for the maximum permissible deviation value. This confirms the validity and reasonableness of the method proposed in this paper.
In this paper, only some typical scenarios of high and low voltage ride-through are selected for parameter identification and verification, and it is not possible to realise the identification and verification of normal operation control parameters after switching in the process of fault recovery, and the above problems need to be further researched and demonstrated.
Acknowledgements
This research was Supported by Open Fund of the State Key Laboratory of Operation and Control of Renewable Energy & Storage Systems (No. DGB51201901183).
References
[1] Xu Yan, Jin Weijai, Zhu Xiaorong. Parameter identification of photovoltaic grid-connected inverter based on GAPSO[J]. Acta Energiae Solaris Sinica, 2021, 42(07): 103–109.
[2] Rajput S K, Dheer D K. Performance Analysis and Energy Conservation of PV Based Hybrid Power System[J]. Distributed Generation & Alternative Energy Journal, 2022, 38(01): 67–84.
[3] Jin Weijia. Study on dynamic model and parameter identification of photovoltaic grid-connected inverter[D]. North China Electric Power University, 2018.
[4] Wu D, Su J, Chen Z, Liu H. Effects of Distributed Generation on Carbon Emission Reduction of Distribution Network[J]. Distributed Generation & Alternative Energy Journal, 2023, 39(01): 57–82.
[5] Shen Xinwei, Zheng Jinghong, Zhu Shouzhen, et al. A dq axis decoupling prarameter identification strategy for grid-connected inverter controller of photovoltaic generation system[J]. Automation of Electric Power Systems, 2014, 38(4): 1–6.
[6] Sun Lixia, Lin Xue, Jiin Yuqing, et al. Modeling of grid-connected photovoltaic generation unit based on particle swarm optimization algorithm[J]. Power System Technology, 2015, 39(05): 1213–1218.
[7] Zhu Mingxiao, Li Jiacai, Chang Dingge, et al. Optimization of antenna array deployment for partial discharge localization in substations by hybrid particle swarm optimization and genetic algorithm method[J]. Energies, 2018, 11(7): 1813–1831.
[8] Liu Zhongqian. Equivalence of photovoltaic cluster and identification for inverter controller parameters[D]. Hefei University of Technology, 2018.
[9] Jian Xianzhong, Wang Peng, Wang Ruzhi. Parameter identification model of photovoltaic module based on improved manta ray optimization algorithm[J]. acta metrologica sinica, 2023, 44(01): 109–119.
[10] He Hao, Cui Cheng, Jia Xihao, et al. Photovoltaic inverter parameter identification method based on transient response trajectory[J]. Smart Power, 2022, 50(04): 51–58.
[11] Kang Pengpeng, Zhu Siyu, Wang Heng, et al. Parameter identification of comprehensive load model with photovoltaic generation based on the IBOA algorithm[J]. Renewable Energy Resources, 2021, 39(11): 1541–1547.
[12] Ge Luming, Qu Linan, Chen Ning, et al. Characterstic analysis of low voltage ride-though and parameter test method for photovoltaic inverter[J]. Automation of Electric Power Systems, 2018, 42(18): 149–156.
[13] Han Pingping, Fan Guijun, Sun Weizhen, et al. Identification of LVRT characteristics of photovoltaic inverters based on data testing and PSO algorithm. Electric Power Automation Equipment, 2020, 40(02): 49–54+1–2.
[14] Cao Bin, Liu Wenzhuo, Yuan Shuai, et al. Modeling of photovoltaic power system based on low voltage ride-through test[J]. Power System Protection and Control, 2020, 48(18): 146–155.
[15] Wang Zedi. Research on photovoltaic power plant transient model and parameter identification[D]. Shenyang University of Technology, 2018.
[16] Ouyang Sen, Ma Wenjie. Low voltage ride through control strategy of photovoltaic inverter considering voltage fault type[J]. Electric Power Automation Equipment, 2018, 38(09): 21–26.
[17] Yu Mengran. Study on low crossing of photovoltaic system based on drop control[J]. Telecom Power Technologies, 2019, 36(03): 7–9.
[18] Hou Lei, Zhao Ming, Yang Zhiqiang, et al. Research on simulation models and stability of pv grid-connected power system based on PSASP[J]. Northeast Electric Power Technology, 2016, 37(06): 15–19.
[19] Wei Chengzhi, Liu Xingwei, Chen Xiaolong, et al. Modeling and simulation of photovoltaic power system with low voltage ride through capability[J]. Proceedings of the CSU-EPSA, 2016, 28(10): 67–73.
[20] Shi Shanshan, Zhang Shuang Qing, Lin Xiaojin, et al. Validation of LVRT capability of PV grid-connected inverters in different test environments[J]. Electrical Automation, 2015, 37(5): 43–46.
[21] Model and parameter test regulation for photovoltaic power system: GB/T 32892-2016[s]. Beijing: State Grid Corporation of China, 2016.
[22] Wang Xichuan, Liu Chun, Lin Weifang, et al. Influence of wind turbine fault ride-through characteristics on transient overvoltage of large-scale wind power dc transmission systems and parameter optimization[J]. Power System Technology, 2021, 45(12): 4612–4621.
[23] Mengting G. Multi-objective Optimal Scheduling Analysis of Power System Based on Improved Particle Swarm Algorithm[J]. Distributed Generation & Alternative Energy Journal, 2023, 38(05), 1609–1636.
[24] Liu Jinkun, Shen Xiaorong, Zhao Long. System identification theory and MATLAB simulation [M]. Beijing:Publishing House of Electronics Industry, 2013.
Biography
Chen Jianjie received the bachelor’s degree in electrical engineering from Nanjing University of Information Science & Technology in 2021, He is currently studying as a graduate student at the Automatization Engineering College of Beijing Information Science & Technology University. His research areas include construction of new energy electromechanical model and parameter identification.
Zhao Bo received the B.S. and M.S. degrees in electrical engineering from Beijing University of Aeronautics and Astronautics in 2000 and 2003, and received Ph.D. degrees in electrical engineering from China Electric Power Research Institute in 2013. He served as an Electrical Engineer at China Electric Power Research Institute, State Grid of China. He works in Beijing Information Science & Technology University since 2018 and now as a researcher/professor level senior engineer. His current research interest includes the analysis and control of new energy and energy storage and the protection and control of microgrid.
Zhang Fang is associate professor of Beijing Information Science And Technology University. Her current research interest include Power system stability analysis and control, etc.
Hu Juan received B.S. degrees and M.S degrees from Hunan University in 2000 and 2003. She works in the China Electric Power Research Institute since 2003 and now as a senior engineer. Her current research interest includes energy storage, power electronics and flexible AC transmission.
Zhang Li received Ph.D. degrees from North China Electric Power University in 2009. Her current research interest includes Microgrid operation analysis and control, distribution network fault location, etc.
Distributed Generation & Alternative Energy Journal, Vol. 39_2, 195–220.
doi: 10.13052/dgaej2156-3306.3921
© 2024 River Publishers