Resolution and Analysis of Transmission Line Fault Types Based on Recording Type Data and Deep Learning
Qingbo Yang*, Kaiping Zhang, Yingpo Yang, Hongya Li and Mengmeng Sun
Xuchang Electric Vocational College, 461000, Xuchang, Henan, China
E-mail: qingboyang@foxmail.com
*Corresponding Author
Received 18 November 2023; Accepted 07 December 2023; Publication 31 January 2024
Abstract
The reliable identification of fault types in transmission lines is essential for restoring power supply swiftly and minimizing economic losses during outages, thereby ensuring the safe and efficient functioning of the power system. This paper addresses the challenge of low recognition accuracy in existing transmission line fault diagnosis methods and presents a novel approach based on fault recording data collected from both ends of the line. This method distinguishes between lightning-strike and non-lightning-strike faults, utilizing a deep learning network architecture to analyze time-domain information from recorded data, using the initial and terminal waveforms as inputs. The proposed fault identification model integrates fault current phase mode transformation, Local Mean Decomposition (LMD) decomposition, and spectral entropy analysis, applying deep learning principles to enhance fault detection precision. This comprehensive approach enables the effective identification of various fault types on transmission lines. Extensive simulation tests were conducted using a sophisticated fault simulation model developed within simulation software to validate the proposed algorithm’s efficacy. The results demonstrate the algorithm’s high accuracy and efficiency in recognizing various fault types on transmission lines.
Keywords: Deep-type learning network architecture, fault recording-type data, fault identification, transmission line.
1 Introduction
With the continuous progress of electric power science and technology, the power system has stepped into a brand new era, which includes large power grids, large power plants, large units, ultra-high-voltage transmission, long-distance power transmission, direct-current transmission, highly automated control, and market-oriented operation, and at the same time, it also puts forward greater challenges to the health and stable operation of the power system. Transmission lines, as one of the main components of the power system, are crucial for the identification and analysis of fault types, which is of great significance for fault analysis, fault location, and relay protection of the power system. The traditional method of fault type identification uses a fault phase-selective element, which is based on the principle of identifying the fault type based on the electrical characteristics of the transmission line at the time of the fault [1–4]. This method has the advantages of easy operation and quick judgment, but it is limited and interfered with by many factors such as load current, system operation mode, fault location, transition resistance, and fault phase, so the validity of its fault type identification criterion is weakened, and the scope of application of different fault phase selecting elements varies.
Domestic experts and scholars have improved and perfected the distributed recording type ranging method and proposed a variety of recording type analysis methods, which can better realize fault location [5–7]. Over the years, experts and scholars in the field of power system engineering have made significant advancements in fault detection and diagnosis methods. In contrast to these established approaches, our research takes a different path by introducing a novel neural network-based method for fault type identification. This method leverages deep learning network architectures to analyze time-domain information extracted from recorded data, utilizing the initial and terminal waveforms as inputs. Additionally, it integrates fault current phase mode transformation, Local Mean Decomposition (LMD) decomposition, and spectral entropy analysis, all within a deep learning framework. To further realize the identification of recorded waveform type data type, the research on lightning bypass and counterstrike identification has made some progress [8], covering most of the high-voltage AC and DC lines, and the judgment of lightning strike type has made a more mature development. Transmission line faults caused by other disasters such as mountain fires, foreign objects, wind deviation, etc. occur from time to time, making the identification of non-lightning-strike type faults particularly important. Fault recorder-type data installed on transmission lines can be used as the main data source for fault-cause identification. A fault recorder is a device that collects fault (transient) waveforms, monitors real-time status and analyzes the shape of the waveforms, etc. It has been widely installed in the power system [9]. A fault recorder can realize a high sampling rate, and its rich transient information can provide strong support for distinguishing lightning strike and non-lightning strike faults [10], its continuous recording characteristics can fully portray the transmission line faults in the time level of the change process [11], and its long time recording of the state of each electrical quantity can analyze the slow change of the development of faults such as hill fires. The information recorded by the wave-recording type device includes the switching quantity change of the collected line, the voltage and current waveform change of each phase and zero sequence, and the harmonic information corresponding to each moment in the collection phase. Therefore, selecting the typical features that best reflect the mapping relationship between the causes of transmission line faults and the recorded waveform data set is a key issue in recognizing the causes of faults based on the fault-recorded waveform data.
Currently, there is a problem of low accuracy in the identification methods for high-voltage transmission line fault types. Fault recording type data contains information about transmission line parameters and fault types, but the research on it is relatively limited, so there is still a vast space for data mining. In recent years, researchers at home and abroad have been keen on applying artificial intelligence algorithms to solve the problem of identifying the fault types of transmission lines, which, through machine learning, can automatically train a model for identifying the fault types without relying on specific identification criteria and without the interference of factors such as the system operation mode and transition resistance. This process can usually be divided into two parts: feature parameter extraction and classifier pattern recognition. Common feature extraction methods include fault component analysis, empirical modal decomposition, wavelet transform, etc., while the methods used for pattern recognition mainly include deep learning network structures, neural network architectures [12, 13], fuzzy inference systems [14, 15], and support vector machines. The transmission line fault type identification method using artificial intelligence algorithms has a strong generalization ability, but the prerequisite is that it needs to extract appropriate feature parameters and have large-scale data samples, and also requires that the number of samples in the majority class and minority class is balanced. Usually, transmission lines adopt A, B, and C three-phase conductor systems, and when a line short-circuit fault occurs, there are a total of 10 fault types if the complications are not considered [16, 17]. However, in the actual power system, the probability of occurrence of different types of faults varies greatly, with single-phase short circuit grounding having the highest probability and three-phase short circuit occurring with the lowest probability, resulting in an unbalanced data set of actual transmission line faults. When applying data mining classification algorithms to unbalanced datasets, they are prone to face problems such as extreme values, insufficient data, and noise [18–20], resulting in poor performance of the trained classifiers in the identification of a few classes and poor overall classification performance.
Therefore, this paper proposes an innovative transmission line fault type identification method, which adopts the fault recording type data at both ends of the transmission line as the information source and utilizes the deep learning network architecture algorithm. This method has important theoretical significance and practical application value. It uses the voltage and current data at both ends of the line to discriminate the fault type by automatically adjusting the generalized correlation factor before and after the time domain delay. According to the distribution law of the correlation factor with the time delay factor , the method can accurately determine the fault type. Meanwhile, the method also combines the fault current phase mode transform, LMD decomposition, and the principle of 1(1/2)-dimensional spectral entropy, as well as the theory of deep learning network architecture, to realize the accurate identification of various fault types on transmission lines. The study also used Matlab simulation software to establish a fault simulation model and conducted simulation tests, which is a new method that has important theoretical significance and practical engineering value for diagnosing transmission line fault types.
2 Principle of Fault Type Diagnosis Based on Recording Type Data
2.1 Sources of Information
The voltage u and current i across the line can be decomposed into a series of harmonics:
| (1) |
Where: is the maximum value of the th harmonic voltage, is the maximum value of the th harmonic current, is the phase of the th harmonic voltage, is the phase of the th harmonic current, is the angular frequency and is the time.
The voltage and current signals here are not all the measurement signals of the wave recorder, but a section of waveform data intercepted before and after the occurrence of the fault as needed, called real-time sampling data.
2.2 Delayed Sampling
Based on real-time sampling, the two-terminal voltage and current recording data are delayed in the time domain, and then the recording data with the same time length as the real-time sampling data are intercepted, and the delayed two-terminal voltage and current are decomposed into a series of harmonics. The expression is:
| (2) |
The time delay factor can be chosen arbitrarily theoretically, and the engineering can be chosen appropriately according to the characteristics of the data of each segment at the time of wave recording type, usually choosing a larger one first, and then decreasing it gradually, or it can be searched adaptively.
2.3 Data Normalization
The voltage and current data from real-time and delayed sampling at both ends are normalized to their maximum values, which is the basis for comparing the relative magnitude of each generalized correlation factor.
2.4 Calculation of Generalized Correlation Factors
In this paper, we use the generalized correlation function to evaluate the similarity of signal waveforms between different periods. To take the amplitude and phase of the voltage and current into account, we use a method that expresses the generalized correlation factor as a complex number. When this complex number tends to zero, its phase can take any value. We base our diagnosis on the modulus of the complex correlation factor, whereby the magnitude of the correlation factor means the magnitude of its mode.
By calculating the generalized correlation factor between the real-time acquisition data and the corresponding time-delayed acquisition data, as well as the numerical distribution of the discriminant function within the recording-type time duration under different time-delay factors , we can perform the diagnosis of the fault type based on the modal value of the correlation factor and the distributional characteristics of the discriminant function.
2.5 Diagnostic Process for Fault Types
When the voltage and current correlation factors for the different periods have large values after each time domain delay (i.e., after the fault has occurred), and the correlation factor with the pre-fault data is small, then a lightning-strike type fault can be identified. On the other hand, if the voltage and current correlation factors for each time domain delay are small, but the correlation factor with the pre-fault data is large, then a non-lightning-strike type fault can be identified. In performing the diagnosis of lightning-strike type faults, meteorological data, and monitoring system data can also be combined to further differentiate whether the fault is triggered by external factors such as a fallen tree, a short-circuit of a foreign object, or a wind dance. In the diagnosis of non-lightning-strike type faults, comparing meteorological data and monitoring system data can help to further determine whether the faults are non-lightning-strike type faults such as dirt flash, lightning flash, ice flash, etc. [21, 22].
If the correlation factors of voltage and current show a tendency to gradually increase and then stabilize at different time intervals after the time domain delay, but the correlation factor with the pre-fault is smaller, then it can be recognized as a permanent fault with variable grounding resistivity. For this fault type, the grounding resistance at the fault point may be characterized by increasing and then decreasing or decreasing and then increasing [23, 24].
2.6 Fault Data Processing
When data acquisition is performed on a Rochester coil, there is a possibility that it may be affected by factors such as electromagnetic interference from external sources or insufficient power supply, which may lead to data loss or errors [25]. Therefore, it is necessary to perform the detection of abnormal data to ensure the authenticity and reliability of the collected data. To assess whether the collected recording type data is anomalous or not, the following data change rates can be considered:
| (3) |
In Equation (3), is the data signal at different moments, if 0, which is greater than its threshold, it means that the data at that moment is abnormal data, except for the peak or trough points, which is due to the high sampling rate, 1 s to update 1 time, and the change of data values is small. If the proportion of abnormal data points is more than 10%, it means that the corresponding recorded wave-type data curve is invalid and data correction is required.
The data correction performed when a point data at a moment in time of the recorded waveform type data is determined to be abnormal is:
| (4) |
The data correction performed when the load data for a certain period of the recorded waveform type data is determined to be abnormal is:
| (5) |
3 Modeling of Recording-type Data and Deep-type Learning Network Architectures
3.1 Fault Type Simulation Modeling
To verify the validity and credibility of the methodology proposed in this study, a model was constructed using ATP software to simulate a 500 kV UHV transmission line with a total length of 15,433 km. The simplified equivalent model of the relevant system is shown in Figure 1.
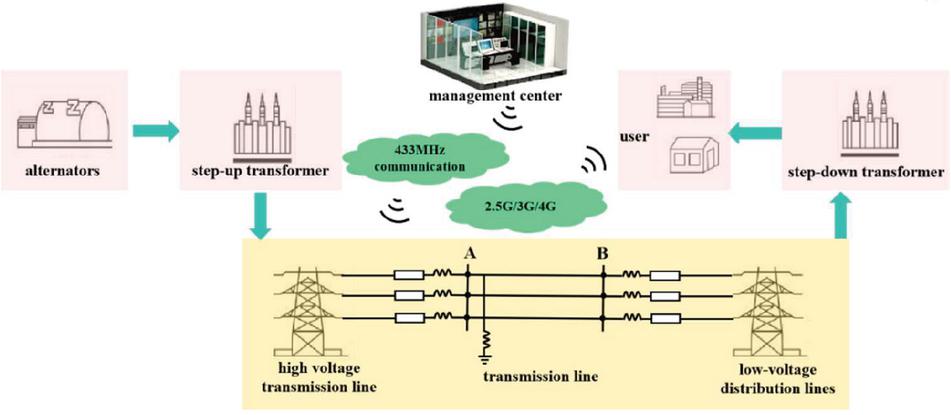
Figure 1 Transmission line fault model.
Let R, L, and C be the positive sequence resistance, positive sequence inductance, and positive sequence capacitance of the three-phase transmission line, and R, L, and C be the zero sequence resistance, zero sequence inductance, and zero sequence capacitance of the three-phase transmission line.
For this fault model, R 0.0282 /km, L 0.2743 /km, C 5529 S/km R 0.3279 /km, L 0.7305 /km, and C 2359 S/km.
To simulate transmission line faults, time-controlled switches, and resistive elements are used to simulate ground fault branches. The simulation of three-phase short-circuit faults (ABC), two-phase short-circuit faults (AB), two-phase short-circuit ground faults (ABg), and single-phase ground short-circuit faults (Ag) is realized by setting the moments when the switches are divided and closed. In the simulation, we use the L1 phase as the faulted phase, and in the case of lightning strike type faults, the moment of switch closure is set to be 0.03 seconds after the start of the simulation, while the time of switch disconnection to return to normal is set to be 0.13 seconds after the start of the simulation. For a non-lightning-strike type fault, the switch closure moment is also set to 0.03 seconds after the start of the simulation, and the switch disconnection time to return to normal is set to the end of the simulation.
3.2 Data Sources
Recorded wave-type data are obtained from the distributed fault monitoring system of multiple transmission lines. In the training process of the deep-type learning network architecture, the standard graphs of lightning strikes (bypassing and counterstrike) and non-lightning strikes are first established, as shown in Figure 2.
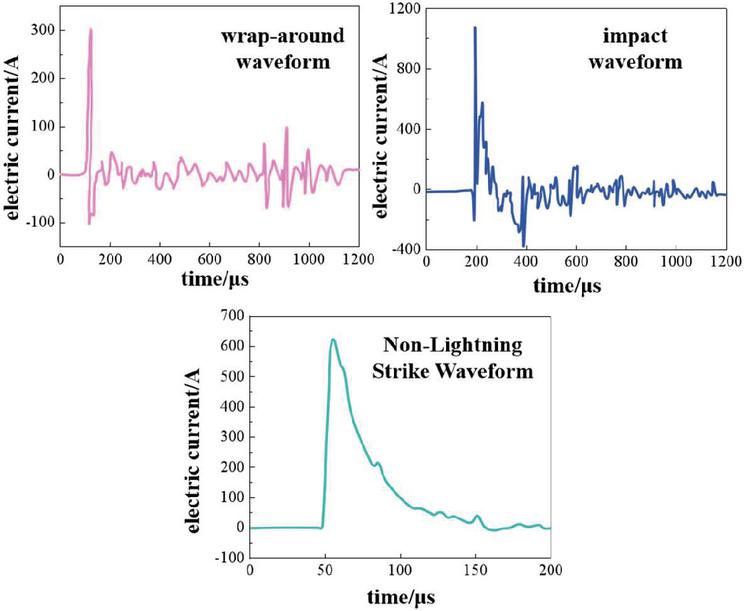
Figure 2 Standard waveform.
To make the sampling of samples as balanced as possible, to ensure that the number of training and validation sets for different types of waveforms is as consistent as possible, and for the training and validation sets are randomly sampled, and the ratio of the training set and validation set is 3:1, as shown in Table 1.
Table 1 Data sample configuration
| Recorded Waveform Type | Training Set | Validation Set | Add Up the Total |
| Thunderbolt | 675 | 225 | 1125 |
| Non-lightning strike | 654 | 218 | 1090 |
| Add up the total | 1329 | 443 | 2215 |
3.3 Data Sources
Figure 3 shows the process of building a deep-type learning network architecture, where key parameters in the time series of lightning data, i.e., the waveheads and wavetails, are used as inputs. These input data were processed through 5 layers of convolutional and pooling layers, and the results were finally derived at the fully connected layer. The model architecture was constructed based on the Alexnet network structure, and the parameters were fine-tuned to end up with an applicable classification model.
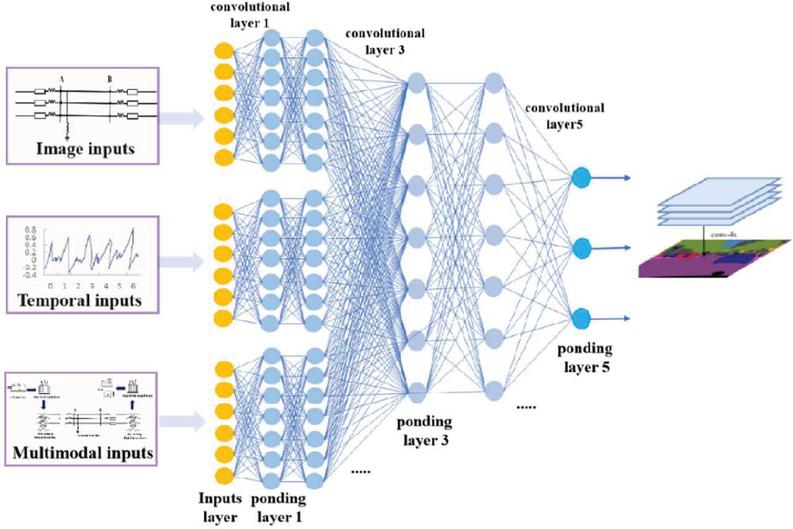
Figure 3 Deep type learning network architecture network architecture.
To optimize the performance of the deep-type learning network architecture, we use an open-source Linux operating system and a MySQL database. The hardware configuration is powerful, including a high-end series of Intel CPUs as well as large-capacity memory and hard disk to ensure efficient processing of large-scale data. In the deep-type learning network architecture, the key evaluation metrics of precision include Precision and Recall, which are as follows [26–28] :
| (6) |
In Equation (6), TP denotes the number of lightning strikes for both actual and predicted values; FP denotes the number of non-lightning strikes for predicted values, but the number of lightning strikes for actual values; and FN denotes the number of lightning strikes for actual values, but the number of non-lightning strikes for predicted values.
In precision analysis, the mean assay precision (mAP), which is the area enclosed by the curve formed by the recall and accuracy with the horizontal axis, is usually used to count the accuracy of different types of validation sets [29, 30].
4 Experimental Results and Analysis
First, with the help of the already established transmission line simulation model, we set different fault types and generated the corresponding fault current waveforms. A To commence our investigation, we utilized a well-established transmission line simulation model to simulate various fault types and generate the corresponding fault current waveforms. Figure 4(A) exemplifies the ABC three-phase fault type, which serves as an illustrative case study. Next, we employed a phase-mode transformation to process the fault signal and performed decomposition to extract 1-mode components. Notably, the number of eigenvalues obtained after signal decomposition displayed variability, ranging from 5 to 12. Figure 4(B) outlines the intricacies of the deep learning network architecture algorithm, which plays a pivotal role in our research. Considering the inherent characteristics of the deep-type learning network architecture algorithm, it is noteworthy that the first few eigenvalues typically encapsulate the majority of information from the original signal. Conversely, the latter components may not contribute substantially to the analysis. To further elucidate this phenomenon, we consistently selected PF1 to PF8 for feature extraction, as depicted in Figure 4(C). This figure offers a detailed insight into the decomposition effect of each feature component of the deep-type learning network architecture, particularly in the case of the ABC fault type.
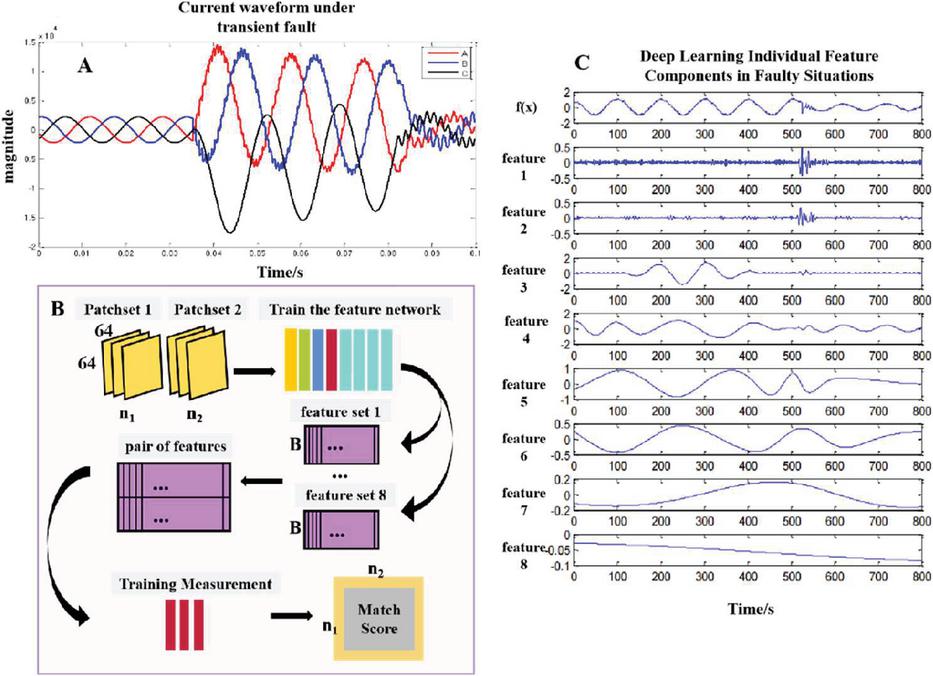
Figure 4 (A) Current waveforms under ABC faults; (B) Process of deep type learning network architecture algorithm modeling; (C) Current LMD component under ABC faults.
After completing the signal feature decomposition, we perform Fourier analysis on each feature component and use the generalized correlation function to calculate the corresponding generalized correlation factor. The results of the correlation analysis for lightning-strike type faults and non-lightning-strike type faults are listed in Tables 2 and 3, respectively. where Z is the correlation factor of ABC faults which are the ongoing state of phase A with the ongoing state of phase B, Z is the correlation factor of the ongoing state of phase B with the ongoing state of phase C, and Z is the correlation factor of the ongoing state of phase A with the ongoing state of phase C. The results are shown in Tables 2, and 3, respectively.
Table 2 Results of correlation analysis of lightning-type faults
| PF | Z | Z | Z |
| 1 | 0.735 | 0.702 | 0.800 |
| 2 | 1.928 | 1.883 | 1.930 |
| 3 | 2.330 | 2.287 | 2.880 |
| 4 | 2.561 | 2.517 | 2.930 |
| 5 | 2.956 | 2.919 | 2.8401 |
| 6 | 27.700 | 27.710 | 31.000 |
| 7 | 4.716 | 3.740 | 3.100 |
| 8 | 4.607 | 3.680 | 3.230 |
Table 3 Results of correlation analysis of non-lightning-strike faults
| PF | Z | Z | Z |
| 1 | 5.447 | 11.800 | 2.779 |
| 2 | 4.893 | 15.070 | 4.460 |
| 3 | 5.718 | 12.500 | 8.220 |
| 4 | 7.526 | 10.570 | 17.070 |
| 5 | 10.740 | 10.010 | 15.620 |
| 6 | 300.000 | 203.700 | 277.000 |
| 7 | 19.760 | 8.229 | 11.400 |
| 8 | 9.450 | 6.748 | 5.900 |
Subsequently, the generalized correlation factors of the first 8 feature components were subjected to a 1(1/2) dimensional spectral analysis, from which the dimensional spectral entropy values of each component were derived. These dimensional spectral entropy values will be used as input data to form the vector E (E, E, E, E, E, E, E, E) of Elman’s deep-type learning network architecture for subsequent fault type identification. A large number of computed feature values are used as training sample inputs to train the deep-type learning network architecture. Subsequently, after the parameter settings are completed and the network is trained, we input the test samples to test them. The test results for various fault types (ABC, AB, ABg, Ag) are shown in Figure 4.
During the iterative process of ABC fault feature vector extraction, we set the approximation error rate to 0.00102. After approximately 170 iterations, the test vectors began to exhibit a convergence trend and converged completely after 226 iterations, marking the completion of the recognition process. At this point, the recognition network stopped iterating and its effectiveness was analyzed. When the number of iterations reaches 226 the iteration is stopped, and the fault feature vector extraction is completed, according to the data in Figure 5, we can learn that the error value of ABC fault feature vector extraction is 0.0040211, the extraction correctness is 99.7%, the extraction time is 2 seconds, and the number of errors is 0 times. These feature vector extraction performance parameters show that the results of ABC fault feature vector extraction are obvious and very good. Therefore, combining the feature vector extraction method proposed in this paper with the Elman deep-type learning network architecture is feasible for the recognition of ABC faults.
During the iteration process of AB fault feature vector extraction, we observed that the test vector started to show a convergence trend when the number of iterations was about 80, and after 288 iterations were carried out, the feature extraction process was completely converged, marking the stopping of the iteration of the feature extraction network, and then we analyzed its effect. When the number of iterations reaches 288 and stops iterating, and the fault feature extraction is completed, according to the data in Figure 4, we can learn that the error value of the AB fault feature extraction is 0.0039489, the correct rate reaches 99.7%, the extraction time is 3 seconds, and the number of errors is 0 times. These feature extraction performance parameters show that the feature extraction of AB fault is obvious and excellent. Therefore, combining the feature vector extraction method proposed in this paper with the Elman deep-type learning network architecture is feasible for the recognition of AB faults.
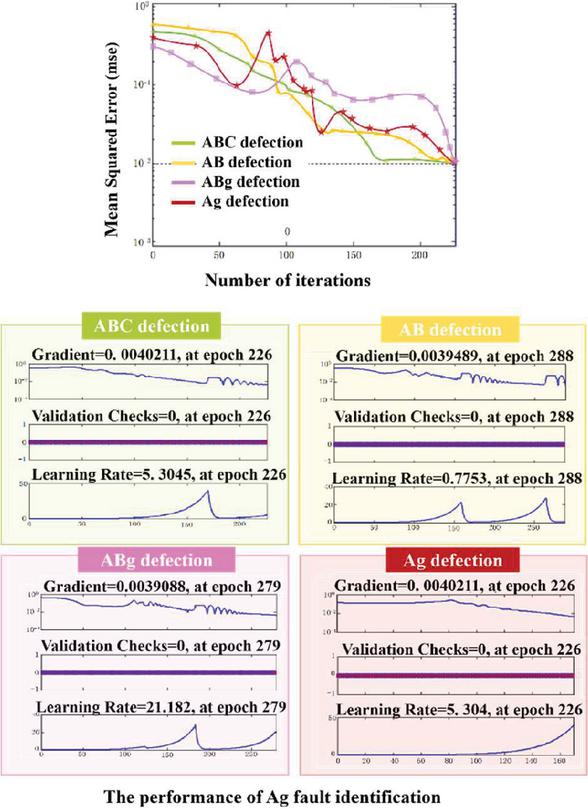
Figure 5 Test results of feature vector extraction for each fault type.
During the iteration process of ABg fault feature extraction, we observed that the test vectors started to show a convergence trend when the number of iterations was about 180, and after 279 iterations were carried out, the feature extraction process was completely converged, marking the cessation of iteration of the feature extraction network, and subsequently we analyzed its effect. When the number of iterations reaches 279 the stopping of iterations, and the fault feature extraction is completed, according to the data, it can be obtained that the error value of the ABg fault feature extraction is 0.0039088, the feature extraction correctness is 97.8%, the extraction time is 3 seconds, and the number of errors is 0 times. These feature extraction performance parameters show that the feature extraction of ABg faults is obvious and excellent. Therefore, combining the feature vector extraction method proposed in this paper with the Elman deep-type learning network architecture is feasible for the recognition of ABg faults.
During the iteration process of Ag fault feature extraction, we observed that the test vectors started to show a convergence trend when the number of iterations was about 80, and after 170 iterations were performed, the feature extraction process completely converged, marking the stopping of the iteration of the feature extraction network, and then we analyzed its effect. When the number of iterations reaches 170 and stops iterating, and the fault feature extraction is completed, according to the data in Figure 5, we can learn that the error value of Ag fault feature extraction is 0.0054212, the feature extraction correctness rate reaches 99.4%, the extraction time is 2 seconds, and the number of errors is 0 times. These performance parameters show that the feature extraction of the Ag fault is obvious and excellent. Therefore, combining the feature vector extraction method proposed in this paper with the Elman deep-type learning network architecture is feasible for Ag fault recognition.
After feature recognition of the time-domain information of the recorded wave-type data, we built a transmission line short-circuit fault recognition model using wave head and wave tail as input parameters. We compared the recognition accuracy of the deep-type learning network architecture models built for different types of transmission line fault-recorded wave-type data. As can be seen in Figure 6, with the increase in the number of iterations, the accuracy of lightning strikes and non-lightning strikes gradually improves and eventually stabilizes, with a stable value of about 0.93. The accuracy of lightning strikes is slightly higher than that of non-lightning strikes, which is related to the more obvious characteristics of lightning strikes, especially the wave head of the counterstrike has a unique characteristic, with a segment of the reverse polarity pulse before the main pulse, which increases the recognition of the waveform.
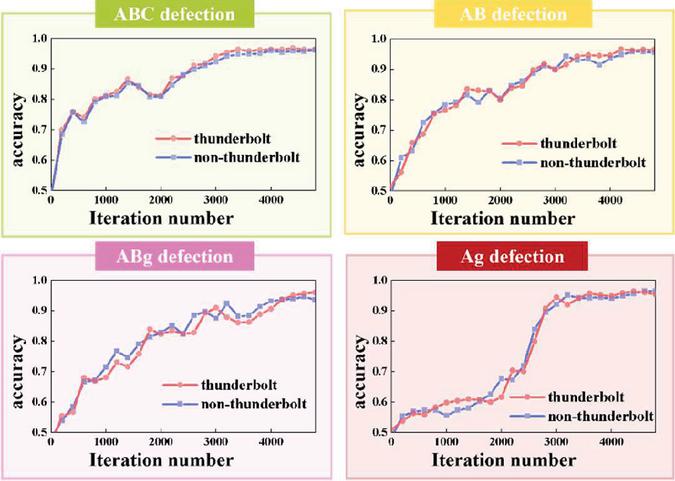
Figure 6 Accuracy of model identification of deep-type learning network architecture for different types of transmission line faults.
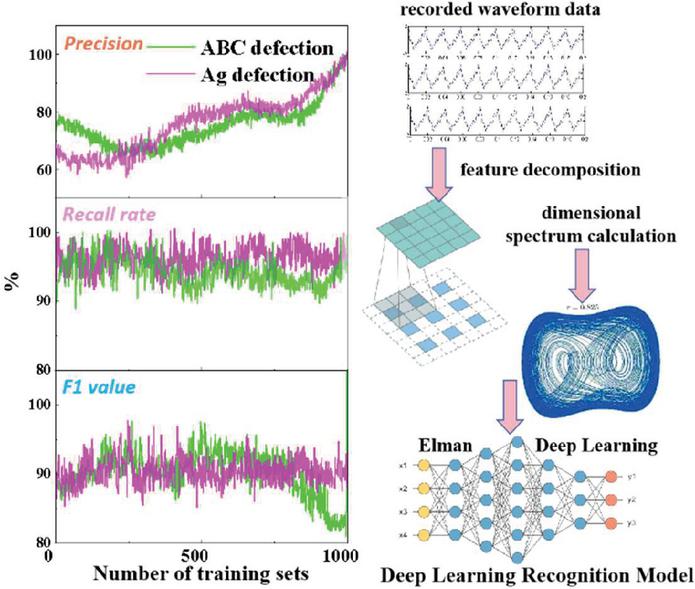
Figure 7 Discriminative results of ABC fault and Ag fault type of transmission line based on deep type learning network architecture models.
Using various types of fault data, which are obtained through simulation experiments, the transmission line fault diagnosis method proposed in this paper based on recording-type data and deep-type learning network architecture is tested. Taking ABC faults and Ag faults as examples, the test results are shown in Figure 7. In addition, to verify the feasibility and performance advantages of the method, we conducted a comparative analysis of the accuracy and efficiency of the wavelet transform, the neural-type network architecture, and the deep-type learning network architecture, and the specific diagnostic results are recorded in Table 4.
Table 4 Comparison of the accuracy of transmission line fault identification based on different algorithmic models
| Type of | Average Elapsed | ||
| Identification | Algorithmic Model | Map (%) | Time/s |
| ABC Failure | Wavelet transform (math.) | 94.1 | 2.1 |
| Neural network architecture | 90.7 | 1.3 | |
| Deep Type Learning Network Architecture | 90.5 | 1.1 | |
| AB Failure | Wavelet transform (math.) | 85.2 | 3.6 |
| Neural network architecture | 90.3 | 2.1 | |
| Deep Type Learning Network Architecture | 93.7 | 1.6 | |
| ABg failure | Wavelet transform (math.) | 95.1 | 3.2 |
| Neural network architecture | 93.7 | 1.8 | |
| Deep Type Learning Network Architecture | 96.2 | 1.7 | |
| Ag Failure | Wavelet transform (math.) | 88.9 | 2.8 |
| Neural network architecture | 84.1 | 1.5 | |
| Deep Type Learning Network Architecture | 90.6 | 1.8 |
From the data in Table 4, we can observe that the wavelet transform performs the best in terms of the recognition accuracy of ABC faults, while the recognition method based on the deep-type learning network architecture proposed in this paper outperforms both the wavelet transform and the neural-type network architecture in terms of the recognition accuracy of AB, ABg, and Ag fault types. In terms of efficiency, the method in this paper has a significant advantage, especially when dealing with large-scale data samples, while the efficiency of wavelet transform is relatively low. In real power systems, the probability of three-phase faults occurring is relatively low. Therefore, the transmission line fault identification method proposed in this paper based on recorded wavelet-type data, LMD-1 (1/2) dimensional spectral entropy, and Elman deep-type learning network architecture is feasible and performs better in the identification of fault types.
5 Conclusion and Discussion
In conclusion, this study presents an innovative method for identifying short-circuit faults in transmission lines, utilizing recorded waveform-type data and a deep-type learning network architecture. The approach involves using standard lightning strike and non-lightning strike waveforms as input data, alongside voltage and current data collected before and after faults at both ends of the transmission line. We have successfully constructed a training model for the deep-type learning network architecture and conducted a comprehensive analysis of recorded waveform-type data for various types of transmission line faults. Our findings strongly support the feasibility and effectiveness of the proposed transmission line fault identification method. With high reliability and efficiency, our approach offers a valuable contribution to the field of transmission line short-circuit fault identification, providing a solid foundation for further research in this area.
References
[1] Tong Xiaoyang, Luo Zhongyun. Fuzzy classification method for transmission line faults based on fuzzy support vector machine and its dimension reduction display[J]. High Voltage Technology, 2015, 41(7): 2276–2282.
[2] Lin Sheng, He Zhengyou, Zang Tianlei, et al. A transmission line fault classification method based on coarse neural network[J]. Chinese Journal of Electrical Engineering, 2010, 30(28): 72–79.
[3] Yang Jianwei, Lo Guomin, He Zhengyou. Fault classification method for high voltage transmission lines based on wavelet entropy weight and support vector machine[J]. Power Grid Technology, 2007(23): 22–26+32.
[4] Xu Shu-Wei, Qiu Cai-Ming, Zhang Dong-Xia, et al. Deep learning-based fault type identification for transmission lines[J]. Chinese Journal of Electrical Engineering, 2019, 39(1): 65–74+321.
[5] Zhang Chao, Zheng Xiaoqiong, Wang Di, et al. Research on power transformer fault diagnosis based on genetic algorithm evolutionary wavelet neural network[J]. Automation and Instrumentation, 2019(10): 136–139.
[6] Tao Wei, Gu Bin, Xu Xingchun, et al. Grid transformer fault detection based on adaptive RBF neural network[J]. Science and Technology Bulletin, 2019, 35(12): 110–113.
[7] Qi Jinding, Sun Tao, San Yan, et al. Research on transmission line fault diagnosis based on support vector machine algorithm[J]. Computer and Network, 2019, 45(23): 68–71.
[8] Wang Shoupeng, Zhao Dongmei. Research review and prospect of power grid fault diagnosis[J]. Power System Automation, 2017, 41(19): 164–175.
[9] Yang Lin, Wang Bin, Dong Xinzhou. A review of fault ranging research on high-voltage DC transmission lines[J]. Power System Automation, 2018, 42(8): 185–191.
[10] K. Sun, Z. Tang, M. Li, et al. A Cable Fault Identification and Location Method Based on HEM[C]//2020 5th Asia Conference on Power and Electrical Engineering (ACPEE). 2020: 1657–1661.
[11] R. A. Guinee. A Novel Correlation Pulse Echo Methodology for Transmission Line Fault Identification and Location Using Pseudorandom Binary Sequences[C]//Proceedings of the 10th WSEAS International Conference on Mathematical Methods and Computational Techniques in Electrical Engineering. Stevens Point, Wisconsin, USA: World Scientific and Engineering Academy and Society (WSEAS), 2008: 155–161.
[12] H. Liang, X. Han, H. Yu, et al. Transmission Line Fault-Cause Identification Method for Large-Scale New Energy Grid Connection Scenarios[J]. Global Energy Interconnection, 2022, 5(4): 362–374.
[13] Y. Liu, Y. Zhu, K. Wu. CNN-Based Fault Phase Identification Method of Double Circuit Transmission Lines[J]. Electric Power Components and Systems, 2020, 48(8): 833–843.
[14] C. Ding, Z. Wang, Q. Ding, et al. Convolutional Neural Network Based on Fast Fourier Transform and Gramian Angle Field for Fault Identification of HVDC Transmission Line[J]. Sustainable Energy, Grids and Networks, 2022, 32: 100888.
[15] H. Wu, J. Wang, D. Nan, et al. Transmission Line Fault Cause Identification Method Based on Transient Waveform Image and MCNN-LSTM[J]. Meta.
[16] Tian Pengfei, Yu You, Dong Ming, et al. CNN-SVM-based fault identification method for high-voltage transmission lines[J]. Power System Protection and Control, 2022, 50(13): 119–125.
[17] Huang JM. Transmission line fault identification method considering transient singular information and unbalanced fault recording dataset [D]. Wuhan University, 2017.
[18] K. Krishna Kumari, V. Vanitha, M. G. Hussien. Framework for Transmission Line Fault Detection in a Five Bus System Using Discrete Wavelet Transform[J]. Distributed Generation & Alternative Energy Journal, 2022: 525–536.
[19] Wang Xinming, Wang Xiangyu, Jia Xiaobu, et al. Fault identification method for out-of-service transmission line based on wavelet packet decomposition convolutional neural network[J]. Electrical Measurement and Instrumentation: 1–7.
[20] Sun Cuiying Lu Yanqiao, Sun Cuiying. neural network-based fault identification method for transmission line[J]. Science Technology and Engineering, 2019, 19(20): 283–288.
[21] C. H. Prasad, K. Subbaramaiah, P. Sujatha. Economic Analysis by Optimal Placing of DGs in Distribution Networks by Particle Swarm Optimisation and Gravitational Search Optimisation Algorithm[J]. Distributed Generation & Alternative Energy Journal, 2023: 923–942.
[22] Du W. Transmission line fault origin recognition based on recorded wave data and deep learning [D]. Shandong University, 2020.
[23] Ni Chen. Fast detection and identification of transmission line faults based on convolutional neural network [D]. Inner Mongolia University of Technology, 2019.
[24] Dong Huanyu. Identification of transmission line fault causes based on fault recording data characteristics [D]. North China Electric Power University (Beijing), 2023.
[25] Zhang Xiaoyang. Calculation of transmission line parameters based on fault recording data [D]. Xi’an University of Technology, 2018.
[26] Shuang Cheng. Research on single-phase ground fault localization technology and application of multi-terminal transmission line based on fault recording data [D]. China University of Mining and Technology, 2019.
[27] M. M. Gajjala, A. Ahmad. Transmission Congestion Management in Deregulated Power System Using Adaptive Restarting Genetic Algorithm[J]. Distributed Generation & Alternative Energy Journal, 2023: 249–272.
[28] Cai Shuang. Transmission line fault identification based on Elman neural network [D]. East China Jiaotong University, 2014.
[29] Z. Q. Zhou, P. Fan, C. H. Zhao. Research on the application of deep learning in short-circuit fault identification of transmission lines[J]. Electrotechnology, 2020(23): 94–95+98.
[30] Wu Hao, Quan Yusheng, Fang Linjie, et al. Transmission line fault diagnosis method based on recorded wave data[J]. Guangdong Electric Power, 2015, 28(12): 1–5+12.
Biographies

Qingbo Yang was born in Luohe, Henan, P.R. China, in 1982, He received the Master degree from Chongqing University, P.R. China. Now, he works in the Department of Information Engineering, Xuchang Electric Vocational College. His research interests include Big data analysis and visualization, artificial intelligence, intelligent internet, etc.

Kaiping Zhang was born in Xuchang, Henan, P.R. China, in 1983. She received the Master degree from Northwest Normal University, P.R. China. Now, she works in the Department of Information Engineering at Xuchang Electrical Vocational College. Her research interests include Big Data Technology.

Yingpo Yang was born in Luohe, Henan P.R. China, in 1983. He received the bachelor’s degree from Tianjin University of Technology, P.R. China. Now, he works in the Information Management Center at Xuchang Electrical Vocational College. His main research interests include network data monitoring and analysis, information communication and security, and intelligent internet, cloud computing.

Hongya Li was born in Xuchang, Henan, P.R. China, in 1991. She received the Master’s degree from Nanning Normal University, P.R. China. Now, she works in Department of Information Engineering, Xuchang Electric Vocational College, her research interests include artificial intelligence, Data mining, irtual reality.

Mengmeng Sun was born in Xuchang, Henan, P.R. China, in 1992. She received the Master’s degree from Southwest University, P.R. China. Now, she works in Department of Information Engineering, Xuchang Electric Vocational College, her research interests include artificial intelligence, deep learning and cloud computing.
Distributed Generation & Alternative Energy Journal, Vol. 39_2, 319–340.
doi: 10.13052/dgaej2156-3306.3925
© 2024 River Publishers