Prediction of Power Equipment Emergency Repair Based on Adaptive Neural Network Fuzzy Inference Method
Tongtong Zhang1,*, Ya’nan Wang1, Yuhang Pang1, Yating Jin2, Jian Wu1 and Junyi Li2
1China Electric Power Research Institute, Beijing, China
2State Grid Zhejiang Electric Power Supply Material Branch Company, Zhejiang, China
E-mail: zh_tongt@126.com; sunshine_wyn@163.com; pangyuhang2014@foxmail.com; 25811269@qq.com; kimheesun521@163.com; tongmuyi@qq.com
*Corresponding Author
Received 11 July 2024; Accepted 09 September 2024
Abstract
If the emergency repair prediction of power equipment is only made from the perspective of historical spare parts inventory data, it cannot reflect the impact of disaster-causing elements and disaster evolution on the demand for emergency repair spare parts in the future. Therefore, this paper aims to propose a reliable power equipment emergency repair prediction method, and constructs a demand prediction method for emergency repair spare parts of power equipment based on scenario analysis. Constructing a power equipment repair system through intelligent reasoning methods to improve the efficiency of power equipment repair. This article comprehensively uses methods such as literature analysis, model inference, and case simulation verification, this paper innovatively combines the adaptive neural network fuzzy inference system with expert experience. This paper validates the superiority of the prediction method constructed in this paper through comparative analysis. The results show that with the increase of the amount of data, the prediction accuracy of the method proposed in this paper will be improved, which can provide a reference for the subsequent emergency repair prediction of power equipment.
Keywords: Adaptive neural network, fuzzy reasoning, electrical equipment, rush repair, prediction.
1 Introduction
Distribution network is not only the core process of connecting high and low voltage users in the system, but also an extremely important energy supply system in contemporary cities. Moreover, it is located in the most central position of the load of the special power system, and has the basic characteristics of relatively large power consumption scale, high load density, and high demand for reliability and quality [1]. With the continuous development of the times, the public’s demand for power quality has also increased significantly, which enables power supply companies to continuously improve their operational management literacy, achieve more ideal work efficiency, and greatly improve the reliability of the power grid system. This has formed relatively more requirements for subsequent fault maintenance, and has also formed more requirements for the work level of subsequent maintenance [2]. For the actual repair link, how to realize the effective location of the fault point has a very significant impact on the overall repair process. This is of great value to ensure the stability of the power supply system and to control the losses caused by power problems as much as possible.
In order to realize the accurate prediction of emergency repair spare parts of power equipment, the primary problem is how to deal with the intermittent demand for emergency repair spare parts of power equipment. The demand for spare parts belongs to the intermittent demand mode, which is characterized by a small amount of non-zero demand interspersed in the continuous zero demand [3], while the demand for emergency repair spare parts of power equipment is a typical intermittent demand mode, and too many zero values increase the difficulty of prediction the demand for emergency repair spare parts of power equipment. Due to the uncertainty of many decision-making factors (natural, social and human factors) before, during and after the occurrence of emergency events, some influencing factors are difficult to measure quantitatively, and the resulting demand for emergency repair spare parts of power equipment is also fuzzy. Therefore, how to solve the fuzziness of emergency repair spare parts of power equipment demand information is the second major problem.
The innovation of this article is as follows: based on the core scenario set that triggers spare parts demand and spare parts demand, introducing the idea of fuzzy theory, using an adaptive neural network fuzzy reasoning system to mine the association rules between core scenarios and spare parts demand from data, and optimizing the weights of scenario elements through expert experience. Then, the Bayesian network scenario inference model trained on the dataset is combined with fuzzy association rules to establish a scenario analysis based prediction model for spare parts demand in power equipment emergency repairs.
This article aims to propose a reliable method for predicting the demand for spare parts in power equipment emergency repairs. A scenario analysis based method for predicting the demand for spare parts in power equipment emergency repairs is constructed, and an adaptive neural network fuzzy reasoning system is innovatively combined with expert experience to conduct data experiments to verify the feasibility and effectiveness of the model. The superiority of the prediction method constructed in this article has been verified through comparative analysis
The purpose of this paper is to propose a reliable prediction method for power equipment emergency repair, and innovatively combine the adaptive neural network fuzzy inference system with expert experience, and consider the weight of different scenario elements to achieve more accurate prediction of emergency repair spare parts of power equipment.
2 Related Work
To diagnose and predict equipment faults, it is first necessary to obtain accurate monitoring data of the equipment’s status. Equipment monitoring data usually includes two types: online data and offline data. Online data is collected through sensor technology, which can provide real-time status monitoring for equipment. However, it is easily affected by sensor reliability and external environmental noise, resulting in high measurement errors. Offline data is measured through on-site manual inspection or other physical experiments, and the measurement results are accurate. However, the sampling cost is too high to achieve real-time monitoring of equipment. The complementarity between the advantages and disadvantages of the two types of data prompts equipment maintenance personnel to integrate them, improve the real-time and accuracy of equipment monitoring, and reduce data sampling costs. The main idea of the fusion method for online and offline data is to use sparse offline data in the time dimension to estimate the overall trend of device monitoring results. Based on the trend information, the online data is corrected, and the missing values in the time dimension of offline data are filled in using the corrected data [4].
In recent years, many valuable methods for fusing online and offline data have been studied and proposed. Reference [5] proposes an online and offline data fusion method based on Kriging interpolation analysis. This method first establishes a connection model between offline data and online data, calculates the system deviation coefficient of online data, and then uses Kriging method to interpolate the obtained deviation coefficient to estimate the overall trend of online data deviation. Finally, based on the trend information, the online data is corrected, and the missing values of offline data are filled in with the correction results. Reference [6] considers the randomness of the correspondence between online and offline data, constructs a Bayesian spatiotemporal model for the fusion of online and offline data, estimates the probability distribution of Bayesian model parameters using the maximum expectation algorithm, and fuses online and offline data based on the estimation results of the model.
Quantitative analysis methods are mainly divided into two categories: fault diagnosis methods based on statistical analysis and fault diagnosis methods based on machine learning. Fault diagnosis methods based on statistical analysis use feature dimensionality reduction techniques to map multi-dimensional features of equipment to a low dimensional space (called the main variable space). Based on the distribution characteristics of the main variable, statistical measures are constructed to measure the degree of deviation between equipment operating characteristics and normal features. The corresponding statistical measures are calculated using the monitoring data of the tested equipment for fault diagnosis. Common feature dimensionality reduction methods include Principal Component Analysis (PCA), Partial Least Squares (PLS), Independent Component Analysis (ICA), and others [7]. The principal component analysis method decomposes the multi-dimensional feature space of the equipment into a subspace composed of principal component features and a residual space. By calculating the T2 or Q statistics of the tested equipment in the subspace or residual space, it describes the degree of deviation between the equipment state and the normal state for fault diagnosis. Reference [8] applies principal component analysis to the fault diagnosis of power transformer equipment, and combines T2 and Q statistics to propose a fault diagnosis method of power equipment based on combined characteristic indexes. Reference [9] proposes a power equipment fault diagnosis algorithm based on principal component analysis, which reduces the dimensionality of power equipment data feature vectors and improves the training and testing accuracy of the algorithm. Reference [10] proposes a multivariate process monitoring and fault diagnosis method based on principal component analysis. This method combines multi-dimensional state indicators of power equipment into a single indicator, and integrates feature information between different indicators to diagnose equipment faults.
The support vector machine model projects the normal state data and fault data of equipment into a high-dimensional space, exploring a hyperplane that can separate normal and fault data, and using it as a fault decision boundary for equipment fault diagnosis. Reference [11] proposed using support vector machines for feature classification of power equipment operation data to achieve fault identification of power equipment. Reference [12] proposed a support vector machine based method for predicting and diagnosing dissolved gas concentrations in power transformer oil, which solves the problem of equipment fault diagnosis under small sample conditions. Reference [13] proposes using genetic algorithms to optimize the parameters of support vector machine models and improve the accuracy of support vector machine diagnostic results. Artificial neural network model describes the complex correspondence between network inputs and outputs by simulating the working mode of human brain neurons. In fault diagnosis applications, the input of artificial neural networks is device monitoring data, and the output is device health status.
Equipment monitoring data is transformed into equipment fault diagnosis results through non-linear weighting of each layer structure. Reference [14] introduces artificial neural networks into fault diagnosis based on neural networks. This method collects historical data of power equipment, and determines whether the equipment is in a fault state based on the trained neural network. Reference [15] considers the issue of insufficient equipment historical data and proposes to use resampling method to obtain more equipment historical data. By training artificial neural networks with the sampled equipment data, the accuracy of equipment fault diagnosis can be improved. Reference [16] proposes a power equipment diagnosis model that combines principal component analysis with neural networks. The model first extracts key performance indicators of the equipment using principal component analysis, and then trains a neural network using observation data of the key indicators. After that, the trained neural network is used for fault diagnosis.
Hidden Markov model is a statistical model composed of Markov chains containing multiple hidden states. This model decomposes the process of equipment from normal state to fault state into multiple hidden states that cannot be directly observed. Each hidden state has different probability distributions for equipment monitoring data. The model describes the dynamic characteristics of equipment from normal to faulty states through the transition probability between hidden states, and estimates the probability of equipment being in different hidden states based on monitoring data for fault diagnosis [17]. Reference [18] proposed a method based on Hidden Markov Model. This method describes the multiple stages of equipment development from normal to fault through the hidden states in the Hidden Markov Model, and evaluates the health status of the equipment by calculating the likelihood of monitoring data of the tested equipment under different hidden states. Reference [19] proposes a fault diagnosis method that combines wavelet analysis with hidden Markov models for complex fault characteristics of power equipment. Firstly, the feature vector of equipment data is extracted by wavelet decomposition, and then the hidden Markov model is used to identify the fault pattern, and on this basis, the fault diagnosis is carried out. Reference [20] combines power equipment oil chromatography analysis technology with hidden Markov models. Firstly, oil chromatography analysis is used to extract feature vectors from equipment monitoring data. Then, the extracted feature vectors are used to train the hidden Markov model, and the probability of the equipment in different hidden states is evaluated based on the training results.
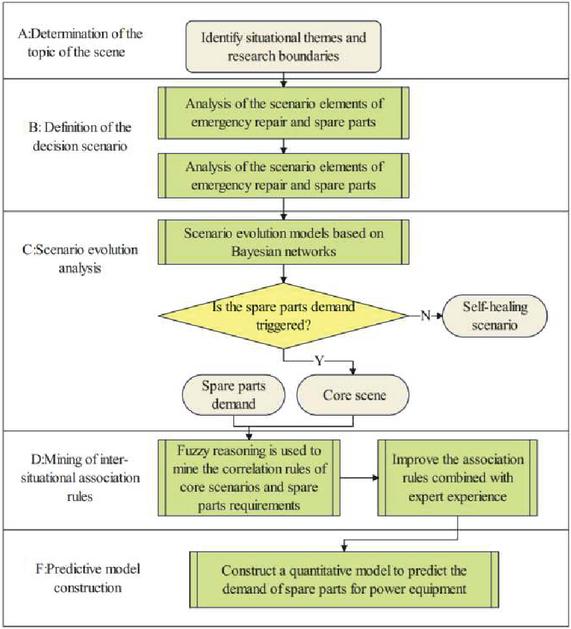
Figure 1 Ideas for building a demand prediction model for emergency repair spare parts of power equipment based on scenario analysis.
3 Model Construction
3.1 Model Construction Ideas
The demand for emergency repair spare parts of power equipment mainly comes from the occurrence of power emergencies. Therefore, to predict the demand for emergency repair spare parts of power equipment, we must first analyze and sort out various external manifestations, characteristics, development trends, and possible impacts of power emergencies, and construct scenario or situation descriptions of events, identify abnormal scenarios that may generate emergency repair spare parts requirements. The abnormal scenario of emergency repair spare parts of power equipment is caused by the abnormal state of inventory data and power equipment status data. Scenario evolution trend analysis and association rule mining are the main methods to predict the demand of emergency repair spare parts in this paper. The idea of building a demand prediction model of emergency repair spare parts of power equipment based on scenario analysis is shown in Figure 1:
(1) Scenario theme determination
This article takes spare parts for power equipment repair as the scenario theme, and needs to define the research scope and conduct in-depth research on the characteristics of spare parts for power equipment repair. Based on sufficient collection of information related to the scenario theme, scenario analysis should be carried out
(2) Definition of Decision Scenarios
Based on the theme of the scenario, explore the mechanism of the development of power emergencies, analyze the possible uncertainty factors that may occur in the future and the potential impact on spare parts for power equipment repair, identify the scenario elements that have a significant impact, and define decision-making scenarios based on the scenario elements.
(3) Scenario Evolution Analysis
Based on the constructed decision scenario, the possible path of scenario development is deduced through Bayesian network, and the core scenario that can lead to the demand for emergency repair spare parts of power equipment is analyzed. If the decision scenario can trigger the demand for emergency repair spare parts of power equipment, it is the core scenario; if the decision scenario cannot trigger the demand for emergency repair spare parts, it is the self-healing scenario.
(4) Mining association rules between scenarios
The core scenario represents the scenario that can generate spare parts demand, but the specific demand for emergency repair spare parts still needs to be predicted by quantitative models. Using fuzzy reasoning to mine the association rules between the core scenario and the demand for emergency repair spare parts, and combining expert experience to improve the association rules, the core scenario is associated with the demand quantity.
(5) Prediction model construction
Based on the association rules between mining scenarios, a comprehensive model is constructed to predict the demand for emergency repair spare parts for power equipment, achieving the prediction of demand under different scenarios. When it is necessary to make a decision on the demand for emergency repair spare parts, the relevant data can be input into the model to obtain the predicted demand for power equipment emergency repair spare parts.
Power emergency is an uncertain event usually caused by the sudden occurrence of internal and external factors in the power system. It will cause serious harm loss or impact to the part or the whole of the power system. These factors may include natural disasters, man-made sabotage, equipment failure, etc., and the impact of events may include power outage, equipment damage and other aspects. As electric power emergency is the prerequisite for generating the background demand for emergency repair of electric power equipment, it is necessary to analyze the influencing factors of emergency repair demand of electric power equipment from the perspective of electric power emergency. The scenario of power system is composed of scenario elements. Determining the scenario elements that affect spare parts demand and constructing scenarios can realize the scenario evolution analysis of power equipment demand. By analyzing the demand data for emergency repair spare parts caused by power system emergencies at home and abroad in recent years, as shown in Figure 2, the following scenario elements affecting the demand for emergency repair spare parts for power equipment are summarized from the perspective of power emergencies:
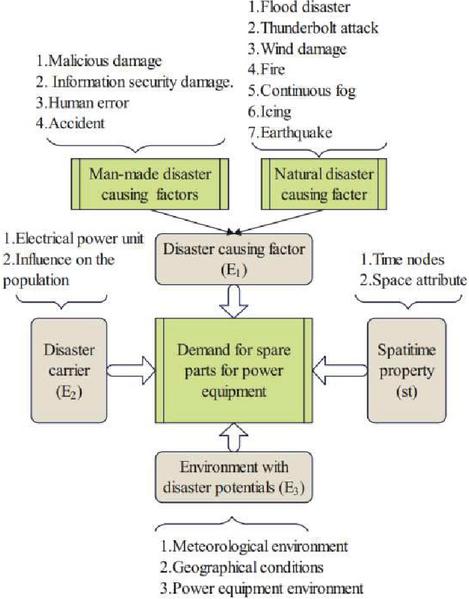
Figure 2 Scenario elements affecting the demand for emergency repair spare parts of power equipment.
3.2 Model Building
In view of the complexity and dynamic characteristics of power emergency scenarios and their impact on the decision-making of emergency repair spare parts of power equipment, the definition of scenarios is considered from both static and dynamic aspects. Specifically, the scenario model includes not only static aspects such as the definition of attribute names and attribute states in scenario elements, but also dynamic aspects such as the relationship between different elements in the process of scenario evolution. These two aspects are the common description of situational elements in the situational deduction problem, and they are also the core basis for solving the situational deduction problem. According to the above scenario elements, the decision-making scenario set of the demand for emergency repair spare parts of power equipment established based on the common knowledge element model is , is composed of each decision-making scenario, and the definition of decision-making scenario is shown in formula (1):
| (1) |
Among them, represents the spatio-temporal elements of the scenario, including the decision-making time and the scenario occurrence place , represents the collection of scenario elements that constitute the scenario, including disaster-causing factor-related elements , disaster-bearing body-related elements , disaster-pregnant environment-related elements represents scenario elements. represents the attribute set of all elements of the decision-making scenario , , represents the attribute set of the scenario element , , and represents the -th attribute of the corresponding scenario element .
In the scenario analysis of emergency repair spare parts of power equipment, there is a causal relationship between each adjacent scenario. Scenario elements are the basis of constructing scenarios, and there are certain associations among them, which lead to the changes of the status of scenario elements. Through the analysis of the state changes of scenario elements, we can understand the evolution process between scenarios, and these changes are driven by the complex role relationships between scenario elements, so these role relationships are also the cause of causality between adjacent scenarios. Therefore, the relationship between situational elements is the core of situational evolution analysis. Concretely speaking, the result of the functional relationship between the situational elements is the functional relationship between the attributes of the elements. Different scenario elements will interact within the scenario, and the result of this interaction is the change of the attribute state of the elements in the situation, thus evolving from the situation s to the next situation. The relationship between the elements of the situation and the situation is shown in Figure 3.
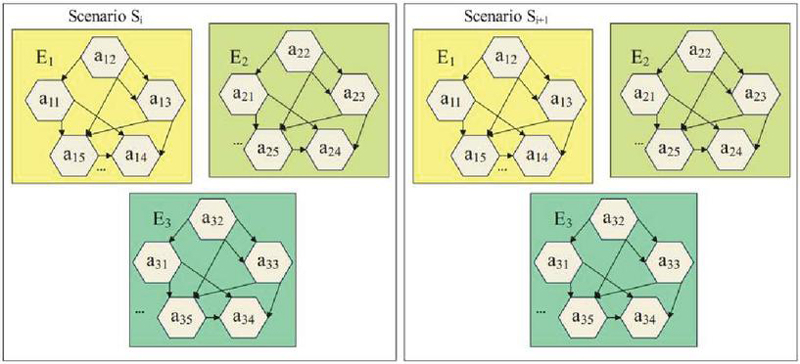
Figure 3 Demonstration of the relationship between scenario elements and scenarios.
Decision-making scenarios need to include the relational information between scenario elements to achieve deduction between scenarios. This paper uses a ruler to express the relationship between scene elements, and uses an incidence matrix to describe it, as shown in formula (2):
| (2) |
Among them, represents the association relationship between the scene element and the scene element , and represents the number of elements contained in the scene.
By giving the values of some variables, the probability distributions of others can be deduced. The scenario-based Bayesian network model constructed in this paper includes three parts, namely . Among them, represents the variables of different emergency repair spare parts decision scenarios in this paper, each network node has a conditional probability table.
Figure 4 is an example of the evolution path of a scenario. The initial scenario is extracted from the input decision-making scenario, the scenario elements are comprehensively considered, and the evolution relationship between scenarios is analyzed by using Bayesian networks to obtain the evolution path in the figure. There are two types of output scenarios: self-healing scenarios and core scenarios. If the deduced future scenario cannot trigger the demand for spare parts, it is defined as a self-healing scenario, such as in the figure, and the of this scenario is 0. If the deduced future scenario will trigger the demand for spare parts, it is defined as the core scenario, such as in the figure, and recorded in the core scenario set . Moreover, the of this scenario is 1, and the initial scenario of the core scenario is recorded at the same time, which is convenient for deploying spare parts in advance and improves the efficiency of emergency decision-making.

Figure 4 Example of scenario evolution path.
After the scenario deduction analysis, the scenario of is extracted to form the core scenario set . For the core scenario in , we modify some parameters to facilitate the reasoning of fuzzy rules in the later stage. For core scenario , where is 1, we remove the attribute and modify its attribute element, as shown in formula (3):
| (3) |
In order to avoid data redundancy, according to the collected data of power system historical accidents and spare parts requirements, we combine the spatial and temporal distribution of demand in the core scenario set to establish the spare parts requirement set of power equipment. The spare part requirement set is composed of a single requirement , and the spare part requirement is defined as formula (4):
| (4) |
The demand data for emergency repair spare parts can be expressed as . Among them, represents the time and location of the emergency repair spare parts demand, which echoes the elements in the core scenario , and represents the name of the required emergency repair spare parts, such as tension clamps, overhead conductors and other spare parts. represents the demand for emergency repair spare parts, and represents the unit of measurement for emergency repair spare parts. For example, the common unit of measurement for tension clamps is pair, and the unit of measurement for overhead conductors is kilometers.
3.3 Fuzzy Analysis
In this paper, expert experience and adaptive neural network fuzzy inference system (ANFIS) are combined to obtain fuzzy rules and improve the prediction efficiency of emergency repair spare parts.
The process of ANFIS fuzzy model construction is shown in Figure 5. Among them, the core scenario and spare parts demand data after determining the weight of scenario elements are input into the model as training samples, the ANFIS system is constructed and the model parameters are trained, the fuzzy rule base is obtained, and the error index E is calculated. When the error index is less than or equal to the error target £, the model training is over. When the error index is greater than the error target, continue to train the ANFIS model until the ANFIS model that meets the error target is trained.
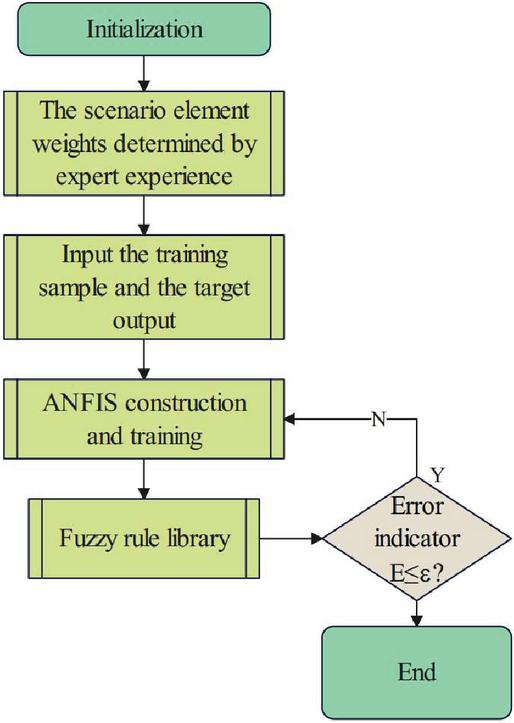
Figure 5 Fuzzy model construction flow chart.
We assume that the inputs of the fuzzy inference system are and , and the output is (obtained by weighted average of the outputs of each rule). There are two IF-THEN rules, as shown by formula (5) and formula (6):
| (5) | |
| (6) |
Among them, and are the fuzzy numbers of the antecedent, is the exact number in the consequent. The equivalent ANFIS model structure is shown in Figure 6. The input vector of the model in the figure is , the weights and can be obtained by multiplying the membership function in the antecedent, and are the proportion of the weights of each rule to the total weights, and the output is the weighted average of and .
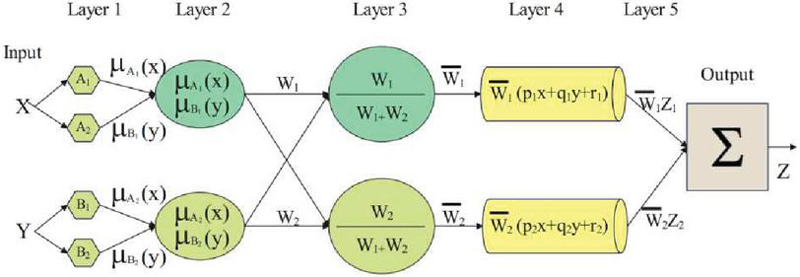
Figure 6 ANFIS model structure corresponding to the first-order Sugeno fuzzy model.
The functions of each layer are described separately below:
Layer 1: Fuzziness. For each fuzzy set, a function is defined to describe the degree to which a given input belongs to the fuzzy set (called membership degree), which is called membership function. The node of the first layer is calculated in formula (7), where is the fuzzy set, is the value of the membership, the input or belongs to fuzzy .
| (7) |
Layer 2: The rule confidence corresponding to the -th node is as in formula (8), where “” can be any T-normal form operator that performs a fuzzy “AND”.
| (8) |
Layer 3: Normalized confidence. The model calculates the ratio of the confidence to the confidence, as in formula (9):
| (9) |
Layer 4: Calculating rule output. As shown in formula (10), where is the normalized confidence of the output, is the consequential parameter, which needs to be updated:
| (10) |
Layer 5: Calculating the total output. The model sums the output of the fourth level to obtain the total output, as shown in the formula (11):
| (11) |
4 Model Experiment Analysis
4.1 Model Construction
In order to improve the immersion of human-computer interaction process, the simulation construction of virtual model in augmented reality system needs to pursue the highest possible fidelity. The power scenario and equipment model experimentally constructed in this paper adopts the process steps shown in Figure 7. For three-dimensional modeling, the shape should be the same as the actual object as much as possible, and the accuracy of the model-related data should be guaranteed to reach the corresponding accuracy.

Figure 7 Roadmap for 3D power scenario construction.
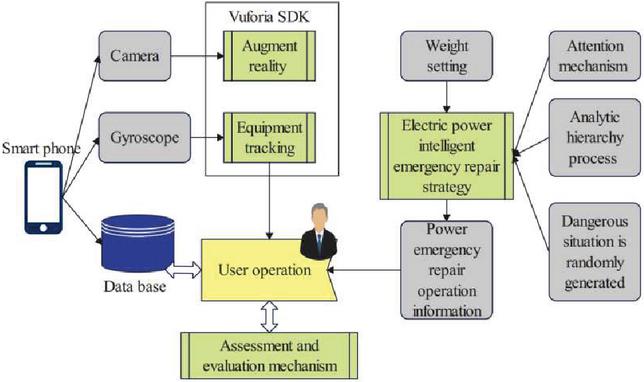
Figure 8 Architecture of power emergency repair training system based on augmented reality.
The architecture of the power emergency repair training system based on augmented reality designed is shown in Figure 8. The system runs on the smartphone terminal, and triggers various interaction mechanisms to complete the corresponding functions by coordinating the visual input from the camera with the resources stored in the database. Relying on sensors such as the gyroscope of the smartphone device, users can observe the augmented reality environment from different perspectives through the mobile phone.
The Web server host and database server host in the system test work need to be custom configured and deployed, Server host test environment is shown in Table 1.
Table 1 Server host test environment
| Project | Hardware and Software Configuration |
| Processor | Intel i5 4 Core 2.8 GHz |
| Memory | 32GB RAM |
| Hard disk | 1TB |
| Operating system | Windows 7 |
| Performance testing tool | LoadRunner 10.0 |
4.2 Results
The Bayesian network-based scenario evolution model is combined with an adaptive neural network-fuzzy inference system improved by experts’ experience. First, the scenario evolution is used to analyze whether there will be emergency repair spare parts demand, and then the adaptive neural network-fuzzy inference system is used to mine the association rules between core scenarios and emergency repair spare parts demand, so as to realize the prediction of emergency repair spare parts demand for power equipment. The test set is input into the built emergency repair spare parts demand prediction model, and the predicted demand Q’ is compared with the actual demand Q to obtain the results shown in Figure 9.
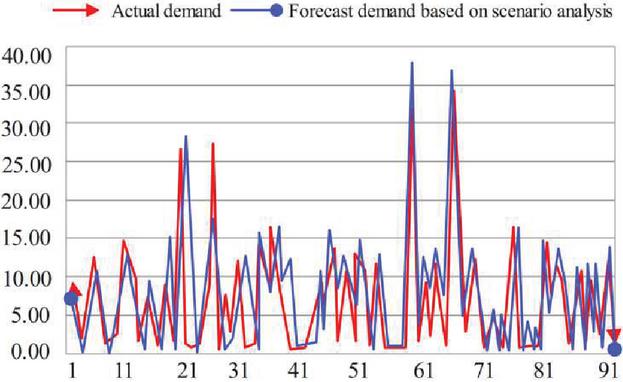
Figure 9 Comparison between actual demand Q and predicted demand Q’.
The demand prediction environment of emergency repair spare parts of power equipment is complex, and it has high uncertainty and long-term zero demand, so many influencing factors need to be considered at the same time. We proposes a scenario-based prediction method for the demand of spare parts for emergency repair of power equipment. This method uses scenario evolution to screen out the scenarios that generate the demand for emergency repair spare parts, and then predicts the demand for emergency repair spare parts of electric power equipment. Therefore, this method can accurately predict the demand for emergency repair spare parts of electric power equipment. It is necessary to compare the demand prediction method proposed in this paper with the commonly used demand prediction methods in the power field, and analyze the differences between the two prediction effects.
In the power industry, support vector regression (SVR) is commonly used to predict power demand. SVR method can not only process linear separable data, but also process nonlinear separable data. In the SVR method, a boundary band is constructed by minimizing the prediction error and maximizing the interval, and the data points are mapped into a high-dimensional space to achieve regression analysis. Support vector regression model is used as a comparison model for analysis. Consistent with the above data analysis and processing process, the same training set and test set are input into the support vector regression model. Then, this paper compares the SVR model with the demand prediction model of emergency repair spare parts. The prediction effect of SVR and the prediction model proposed on the test set is shown in Figure 10.
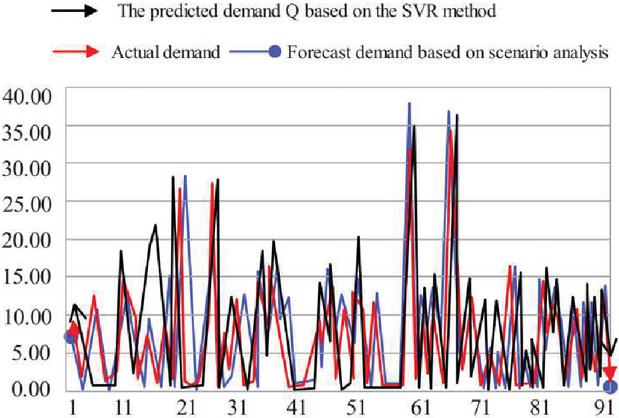
Figure 10 Comparison curve of prediction effects of the two methods.
The prediction indicator of the scenario analysis method and the SVR method were calculated, and the comparison of the prediction indicator of the two methods is shown in Table 2.
Table 2 Comparison of prediction effects of different models
| The predictive | Support vector | |
| model proposed | machine | |
| in this paper | regression model | |
| MAE (Mean Absolute Error) | 1.07 | 3.70 |
| RMSE (Root Mean Squared Error) | 2.38 | 6.77 |
In order to examine the performance of the system under high pressure environment, a mixed pressure test case as shown in Table 3 is designed, that is, a multi-step pressurization form is used to examine whether the performance of the system under different pressures meets expectations.
Table 3 Test results table of system performance
| Response Time (ms) | ||
| Concurrency | Maximum | Average |
| 20 | 363 | 180 |
| 40 | 351 | 193 |
| 60 | 384 | 199 |
| 80 | 390 | 224 |
| 100 | 407 | 235 |
| 120 | 398 | 242 |
| 140 | 947 | 602 |
| 160 | 1107 | 686 |
| 180 | 1063 | 750 |
| 200 | 1201 | 924 |
4.3 Analysis and Discussion
As shown in Figure 9, the RMSE of the calculated comprehensive test set is 2.40, and the MAE is 1.08. Figure 9 is the comparison curve between the actual demand Q and the predicted demand Q’ of the test set data. It can be seen that the predicted demand curve basically fits the actual demand, and a large number of zero values that do not generate emergency repair spare parts demand are also separated through scenario evolution analysis, and the prediction accuracy is high, which verifies the effectiveness of the proposed method.
From the comparison between the predicted demand and the actual demand in Figure 10, it can be seen that due to the large number of zero-value demands in the data, the predicted value of SVR is generally low, which makes the prediction effect of the SVR method not good, and some predicted values are negative value. However, the demand prediction method of emergency repair spare parts of power equipment based on scenario analysis proposed in this paper has good prediction effect. In particular, it uses scenario evolution to analyze whether there is a demand for power equipment emergency repair spares parts, so that the zero-value demand prediction is accurate and will not affect the core scenario non-zero demand prediction, so the prediction effect is good.
From the results in Table 2, it can be seen that due to the large number of zero values in the dataset, the MAE and RMSE of the support vector regression model are relatively high, and the prediction effect is poor. The prediction model based on scenario analysis has a relatively good effect, its MAE and RMSE are smaller, and its prediction accuracy is higher than that of support vector regression model. The prediction model based on scenario analysis will produce the core scenario of the demand for emergency repair spare parts and predict the demand for emergency repair spare parts in stages, which reduces the impact of a large number of zero values on the prediction effect of the model and makes the demand prediction method proposed in this paper can be effectively predicted. The validity and superiority of the model are proved by the analysis of the above example data. The results show that compared with the traditional method, the proposed method can greatly improve the accuracy of the demand prediction of emergency repair spare parts, and can provide a basis for the purchase and scheduling of emergency repair spare parts in the subsequent power grid system. Based on the analysis of spare parts demand prediction model for emergency repair of electric power equipment and the spare parts management of electric power enterprises, three suggestions are put forward. In terms of technology application, power enterprises should strengthen the application of digital technology in the management of emergency repair spare parts of power equipment. Through powerful data analysis and scientific prediction model construction, they should analyze the scenarios that may generate demand for emergency repair spare parts as early as possible and predict their demand, so as to reserve an appropriate amount of emergency repair spare parts of power equipment in advance. In terms of data accumulation, due to the lack of historical data of emergency repair spare parts of power equipment, it is necessary to strengthen the collection and accumulation of historical data related to emergency repair spare parts of power equipment. Moreover, enterprises need to consider the impact of power emergencies on the demand for emergency repair spare parts of power equipment, and improve the accuracy of the demand prediction model for emergency repair spare parts of power equipment by continuously inputting internal and external data related to emergency repair spare parts of power equipment. In the selection of prediction methods, due to the intermittent and uncertain demand of emergency repair spare parts of power equipment, it is difficult to predict its demand. Therefore, when choosing the demand prediction method for emergency repair spare parts of power equipment, enterprises can use the method of considering whether and how much the demand for emergency repair spare parts of power equipment is generated to analyze the generation process of emergency repair spare parts of power equipment demand and use combined methods to predict.
From the system performance test results shown in Table 3, it can be seen that when the number of concurrent users in the system is around 160, the peak logic operation response time of the system exceeds 1 second. However, according to the actual situation of the distribution network emergency repair task management business of the power supply company, the concurrent traffic of commanders in the system and the concurrent traffic of remote PAD devices are basically maintained at 100. Therefore, the data processing time of the system in the environment of 100 concurrency meets the relevant standards in the performance requirement analysis, and the system is still running normally when the concurrency reaches 200, and there is no crash or no response. If the business environment of the system changes in subsequent applications, the performance of the system can be improved by improving the hardware and software configuration of the system server.
5 Conclusion
This paper innovatively combines the adaptive neural network fuzzy inference system with expert experience, and considers the weights of different scenario elements to achieve more accurate prediction of emergency repair spare parts of power equipment. In addition, this paper validates the superiority of the prediction method constructed in this paper through experiments, and the method proposed in this paper is affected by data. However, although the prediction method based on scenario analysis proposed in this paper predicts the demand for emergency repair spare parts, it needs to ensure that the input data of the model is large when the prediction results are good. Therefore, the prediction model can be continuously optimized with the real-time input data flow by establishing an online prediction model and other methods.
Although the scenario analysis based prediction method proposed in this article predicts the demand for emergency repair spare parts, the more input data the model has, the better the prediction effect of the model. This can be achieved by establishing online prediction models and continuously optimizing the prediction model with real-time input data flow.
Acknowledgement
We thank the State Grid Corporation of Science and Technology Project Research on Key Technologies and Applications of Full Life Cycle Quality Control for Power Equipment (grant number 5700-202355319A-1-1-ZN).
References
[1] A. Khoshand, A. Karami, G. Rostami, and N. Emaminejad, ‘Prediction of e-waste generation: application of modified adaptive neuro-fuzzy inference system (MANFIS),’ Waste Management & Research, pp. 389–400, 2023.
[2] A. Milad, S. A. Majeed, I. Adwan, N. A. Khalifa, and N. I. M. Yusoff, ‘Adaptive neuro fuzzy inference system for predicting flexible pavement distress in tropical regions,’ Journal of Engineering Science and Technology, 2022.
[3] B. Raheem, E. Ogbuju, and F. Oladipo, ‘Development of a lightning prediction model using machine learning algorithm: survey,’ Journal of Applied Artificial Intelligence, pp. 45–56, 2023.
[4] C. A. Pinto, J. T. Farinha, H. Raposo, and D. Galar, ‘Stochastic versus fuzzy models – a discussion centered on the reliability of an electrical power supply system in a large European hospital,’ Energies, pp. 1024–1035, 2022.
[5] C. K. Chang, B. K. Boyanapalli, and R. N. Wu, ‘Adaptive adjustment of threshold criterion in predicting failure for medium voltage power cable joints,’ IEEE Transactions on Dielectrics and Electrical Insulation, pp. 955–963, 2021.
[6] C. Kyrkou, P. Kolios, T. Theocharides, and M. Polycarpou, ‘Machine learning for emergency management: A survey and future outlook,’ Proceedings of the IEEE, 111(1), pp. 19–41, 2022.
[7] C. Zhang, G. Tian, A. M. Fathollahi-Fard, W. Wang, P. Wu, and Z. Li, ‘Interval-valued intuitionistic uncertain linguistic cloud petri net and its application to risk assessment for subway fire accident,’ IEEE transactions on automation science and engineering, pp. 163–177, 2020.
[8] D. Yao, J. Han, Q. Li, Q. Wang, C. Li, D. Zhang, … and C. Tian, ‘An intelligent risk forewarning method for operation of power system considering multi-region extreme weather correlation,’ Electronics, pp. 3487–3495, 2023.
[9] G. Lorenzini, M. A. Kamarposhti, M. Kanan, A. Solyman, and M. H. Ahmed, ‘A solution to investigate uncertainties in reliability analysis of distribution system based on fuzzy logic method,’ Journal Européen des Systèmes Automatisés, pp. 289–294, 2024.
[10] H. Li, M. Liang, F. Li, J. Zuo, C. Zhang, and Y. Ma, ‘Operational safety risk assessment of water diversion infrastructure based on FMEA with fuzzy inference system,’ Water Supply, pp. 7513–7531, 2022.
[11] J. H. Kim, S. H. Park, S. J. Park, B. J. Yun, and Y. S. Hong, ‘Wind turbine fire prevention system using fuzzy rules and weka data mining cluster analysis,’ Energies, pp. 5176–5185, 2023.
[12] M. Gheibi, R. Moezzi, H. Taghavian, S. Wacławek, N. Emrani, M. Mohtasham, … and J. Cyrus, ‘A risk-based soft sensor for failure rate monitoring in water distribution network via adaptive neuro-fuzzy interference systems,’ Scientific Reports, pp. 12200–12210, 2023.
[13] N. Hadroug, A. Hafaifa, A. Iratni and M. Guemana, ‘Reliability modeling using an adaptive neuro-fuzzy inference system: Gas turbine application,’ Fuzzy Information and Engineering, pp. 154–183, 2021.
[14] P. Odeyar, D. B. Apel, R. Hall, B. Zon, and K. Skrzypkowski, ‘A review of reliability and fault analysis methods for heavy equipment and their components used in mining,’ energies, pp. 6263–6275, 2022.
[15] P. Prabhakaran, A. Subbaiyan, P. Bhaskaran and S. Velusamy, ‘Preventive track maintenance model using fuzzy weight convolution neural network for metro rail system,’ Journal of Intelligent & Fuzzy Systems, pp. 4565–4586, 2022.
[16] R. Pandit, D. Astolfi, J. Hong, D. Infield, and M. Santos, ‘SCADA data for wind turbine data-driven condition performance monitoring: A review on state-of-art, challenges and future trends,’ Wind Engineering, pp. 422–441, 2023.
[17] T. Touil, and A. Lakehal, ‘Electrical power generator faults analysis using fault tree and bayesian network. acta universitatis sapientiae,’ Electrical and Mechanical Engineering, pp. 45–59, 2023.
[18] W. Q. Huang, and K. Y. Chen, ‘Fuzzy inference soil analysis system for automated vehicles in honey tangerine orchards,’ International Journal of Fuzzy Systems, 25(8), pp. 3049–3060, 2023.
[19] Y. Hao, M. Tian, Y. Wang, and M. Huang, ‘Demand forecasting for rush repair spare parts of power equipment using fuzzy C-means clustering and the fuzzy decision tree,’ Int. J. Innov. Comput. Inf. Control, pp. 1007–1021, 2023.
[20] Y. Li, X. Sun, L. Tong, B. Peng, and J. Li, ‘Research on intelligent algorithm-based power system fault prediction and diagnosis technology,’ Journal of Electrotechnology, Electrical Engineering and Management, pp. 84–91, 2024.
Biographies

Tongtong Zhang graduated from University of Chinese Academy of Sciences with a Master’s degree in 2019 and joined China Electric Power Research Institute (CEPRI) in August of the same year. She is currently engaged in research on power information and communication, condition evaluation, and artificial intelligence, and has published 9 papers and 9 patents.

Ya’nan Wang received the MS degree in communication and information system from the Beijing Jiaotong University, Beijing, China, in 2017. In August 2017, she joined the China Electric Power Research Institute. Her research interests include power communication network simulation technology and optical transmission technology.

Yuhang Pang received Master’s degree from XJTU in 2021. Since then he has been employed by CEPRI. He has been engaged in scientific research in the field of Electric-Power Communication and its Intelligence for 3 years. He often participates in academic association activities and wins awards, and has published more than 10 papers and patents in related fields.

Yating Jin graduated from Xi’an University of Technology, master’s degree. Since joining the State Grid Zhejiang Electric Power Supply Material Branch Company in 2021, she has been committed to quality management. She is familiar with quality management tasks such as verification, supervision of production, sampling inspection, and handling of suppliers’ non-compliant behavior. She is dedicated to promoting the construction of information systems to further enhance the efficiency and effectiveness of quality management work.

Jian Wu graduated from China University of Geosciences (Beijing) with a major in Information and Communication Engineering in 2017, mainly engaged in work related to power communication. During his work, he published 7 papers and 8 patents.

Junyi Li Graduated from Shanghai University of Electric Power, Bachelor’s degree. He has been working in the power system industry for over thirty years. From electricity marketing to contract management, to material procurement, and to quality supervision, no matter which job he undertakes, he learns, specializes, and loves it. He is a “screw” that never rusts on ordinary posts, doing his job with dedication and excellence.
Distributed Generation & Alternative Energy Journal, Vol. 39_4, 915–940.
doi: 10.13052/dgaej2156-3306.39411
© 2024 River Publishers