Based on The Multi-index Quantitative Evaluation Model of Health Status of Distributed Distribution Network
Yao Zhang1, Zhongqiang Zhou2,*, Yin Lian 3, Kun Zhou4 and Qihong Shi5
1Electric Power Dispatching and Control Center, Department of Distribution Control, Guizhou Power Grid, Guiyang, 550000, China
2Electric Power Dispatching and Control Center, Automation Department, Guizhou Power Grid, Guiyang, 550000, China
3Xingyi Power Supply Bureau, Electric Power Dispatching and Control Center, Xingyi, 562400, China
4Bijie Power Supply Bureau, Electric Power Dispatching and Control Center, Bijie, 551700, China
5Anshun Power Supply Bureau, Electric Power Dispatching and Control Center, Anshun, 561000, China
E-mail: gzdwzzq@163.com
*Corresponding Author
Received 12 July 2024; Accepted 23 September 2024
Abstract
With the rapid development of smart grids, accurate and timely assessment of the health status of distribution networks is crucial. This article proposes a multi-indicator quantitative evaluation model based on the health status of distributed distribution networks. The model incorporates diverse pivotal metrics about the distribution network, encompassing voltage stability, equipment senescence, and fault occurrence frequencies. Leveraging sophisticated data analytics techniques facilitates a quantitative appraisal of the network’s overall health status. To delve deeper into the efficacy of intelligent distribution network situational awareness, this study presents a comprehensive evaluation framework encompassing a robust index system and evaluation methodologies. The comprehensive evaluation index system includes five primary indicators, as well as a total of 17 secondary indicators, to objectively quantify the effectiveness of intelligent distribution network situational awareness. This paper uses a subjective and objective mixed evaluation method based on the binomial coefficient and multi-objective planning methods to weight the comprehensive evaluation index system. The comprehensive evaluation model for the implementation effect of intelligent distribution network situational awareness proposed in this article objectively and accurately reflects the operation status of the distribution network, eliminates the one-sidedness of a single evaluation method, effectively improves the observability of the intelligent distribution network, and realizes the analysis of weak links and potential risks in the distribution network.
Keywords: Health index, status assessment, distribution network risk, multi-index quantitative evaluation.
1 Introduction
The physical carrier of smart distribution network is the integration of all old and new technologies, new and old equipment and network, and the health level of equipment and network is an important basis and support for all other work, and is an essential cornerstone of smart grid construction [1, 2]. Therefore, it should be the starting point of the construction of intelligent distribution network to comprehensively and systematically grasp the health level of the existing distribution network equipment and network, and to realize lean and efficient management of the existing distribution network assets. How to efficiently plan, design, operate and maintain the increasing huge assets and equipment is not only one of the key issues to improve the operation performance of power grid enterprises, but also is the foundation and an essential and important part of smart grid construction [3]. Therefore, in the power grid enterprise asset management introduced health index theory and risk analysis technology, establish and improve the necessary assets database, not only for power grid risk control and equipment management strategy to provide important information, and can guarantee the overall reliability of power system, reduce operational costs, improve the return on investment, solid foundation for smart grid construction [4, 5].
Since 2010, the Gas and Electricity Market Office, the UK industry regulator, has used the health index as one of the regulatory indicators, linked to risk management, that is, the health index to replace the equipment failure rate and then calculate the risk, and each distribution network operator must report the annual asset plan according to HI [6, 7]. At present, each equipment of 10 kV and above has a corresponding health index, but the HI of high voltage equipment is relatively accurate. The HI of distribution equipment is basically experience and extensive, and the HI of a single equipment cannot be linked to the maintenance plan [8, 9]. The Power Equipment Health Index, a distribution asset management system based on status, risk and life asset management, has been adopted and promoted by the UK power industry, and the UK standard PAS 55 and the International Asset Management Standard ISO55000 issued in January 2014 have also adopted the above research results. Intelligent distribution network situational awareness is is an important part of a new generation of distribution automation system, the quality of the situational awareness effect determines the intelligent distribution network development level and operational efficiency, but the distribution network equipment diversity, polymorphic, power distribution automation system, power distribution energy management system and so on different areas, scene difference is bigger, the implementation of the situational awareness [10, 11]. If the comprehensive evaluation of the situational awareness can be achieved, the weak links and potential dangers of the distribution network can be found in time, and the visibility of the distribution network can be improved, so as to provide reference information for active intelligent prevention and control.
In the design and research of multi index quantitative evaluation models based on distributed distribution network health status, foreign research has been earlier and more in-depth, especially in the fields of big data analysis and artificial intelligence applications, showing a leading position; However, domestic research focuses more on solving practical problems and localized innovation. By integrating advanced theories and technologies at home and abroad, this model has achieved international progressiveness in terms of the comprehensiveness of evaluation indicators, the accuracy of quantitative methods, and the efficiency of system integration, especially in terms of adapting to complex distributed distribution network structures and real-time data processing. This article establishes a scientific and systematic evaluation index system for the implementation effect of situational awareness, proposes a comprehensive evaluation method for the implementation effect of intelligent distribution network situational awareness by combining the binomial coefficient method and multi-objective programming method for weighting, and finally verifies the rationality of the proposed comprehensive evaluation model for the implementation effect of intelligent distribution network situational awareness using typical regional distribution network data in a certain city.
2 Smart Distribution Network Key Technology
2.1 Situation Awareness
Situation awareness requires distribution system analysis and control to obtain the required data. The monitoring optimization configuration technology is used to improve observability and PMU optimization configuration [12, 13]. Field operation data mainly completes the collection of multiple data to prepare for the understanding, evaluation and prediction of the situation [14, 15]. However, the distribution network has a large scale and complex structure, and it is not easy to achieve comprehensive data collection and monitoring equipment coverage. Compared with the transmission network, the distribution network is seriously insufficient [16, 17]. Therefore, for the distribution network, how to use the limited funds to achieve the optimal measurement allocation to improve the system’s observability as far as possible to lay a solid foundation for the distribution network status estimation is particularly important [18, 19]. So the core of the distribution network situation awareness technology is according to the different actual requirements, both the actual operation of the distribution network, accuracy, considering state estimation, reliability, economy, robustness and information security factors, realize the optimal configuration of measurement and control terminal and planning through multiple types of equipment mixed configuration, measuring flexible configuration and convenient deployment, construction of strong and effective measurement and control system. At present, some progress has been made in optimizing distribution network measuring instruments and measurement and control terminals, mainly reflected in the consideration of economy, observability, reliability, state estimation accuracy, information security, robustness of N-1 element failure, robustness and network reconstruction. In addition, the optimization and planning problem of PMU in the power distribution system has also attracted people’s attention.
2.2 Situation Understanding
Situation understanding is to evaluate and analyze the steady-state operation, economy, flexibility, survival ability, distributed power supply acceptance capacity of distribution system, so as to obtain the knowledge contained in the collected data [20]. Situation understanding technology mainly includes: three-phase power flow computing technology of distribution network including distributed power supply, three-phase state estimation technology of distribution network including distributed power supply, analysis technology of survivability and vulnerability of distribution system; power transmission ability of distribution system; flexibility analysis of distribution system; big data and cloud computing technology of intelligent distribution system.
Figure 1 Operation process of power distribution flow.
Figure 1 presents the operation process of distribution, in which power flow calculation and state estimation of the distribution network are the basic tools for distribution network analysis, such as security assessment, network reconstruction, fault handling, and reactive power optimization. Taking the distribution network state estimation technology as an example, In addition to the need to handle large-scale systems addition to developing solution algorithms with fast computational speed and high numerical stability, We also need to consider the following aspects of the development: more accurate status estimation; State estimation of measurement and parameter uncertainty; Multi-region distributed state estimation; Estimation of global transmission and AC and DC mixed states. The flexibility of the power system refers to the ability to quickly and effectively allocate existing resources, quickly respond to the power grid’s power changes and control the power grid’s key operating parameters within a certain time scale under economic and operational constraints. A flexible power system can not only meet the power gap when power is insufficient but also economically dispose of the power when power is excess. The power system causes changes in load demand and power output for any reason to ensure adequate power supply. The transmission network’s flexibility mainly aims to treat randomness and uncertain conditions brought by load fluctuation and power station expansion factors under the power structure of hydropower and thermal power with strong controllability [21, 22]. The access to many intermittent power sources, such as wind power and photovoltaic power generation in the distribution network, forms a unique power supply structure, and the output of the power generation side is characterized by low controllability, strong randomness and uncertainty. Therefore, the intermittent power supply’s randomness and uncertainty conditions must be carefully considered and dealt with. With the increasingly complex power grid structure and the expansion of scale, the distribution network system integration data increased dramatically, real-time information processing is huge, the need to deal with huge amounts of data, a large number of distributed powers, the rapid development of electric vehicles, PMU device, will be intelligent distribution network big data resources pool into more data flow. In the huge time-varying power operation data, how to screen, sort, integrate and mine the data, obtain real-time, efficient and high-precision power grid information, and deeply excavate its internal implicit knowledge is an important research content.
2.3 Situation Prediction
The situation prediction is to predict the changes of various changing factors in the distribution system, such as load, distributed power supply, EV, and evaluate and warn the safety risk of the system. The output prediction of distributed power supply, safety analysis and risk early warning of power distribution network [23]. In the situation prediction, it is necessary to consider the modeling and parameter identification methods of load, distributed power supply, electric vehicles, etc. with timely air correlation of actual control operation characteristics, and calculate the impact of uncertainty on them. There is a lack of actual measurement points in the distribution network, so it is unrealistic to monitor the load data of each node in real time. Strengthening the load prediction of the distribution system is helpful to timely grasp the operation situation of the distribution network, and find the abnormal power supply and potential faults in time, so as to strengthen the management of the distribution network and improve the level of safe and economic operation.
With the continuous increase of the grid-connected capacity of distributed power supply, the risk of song and randomness to the dispatching operation of power system and the impact on power quality become more and more prominent. Accurate and rapid prediction of distributed generation power can make the power dispatcher predict and simulate the line accurate and rapid prediction, and can make the power dispatcher predict and simulate the development of the future power grid operation trajectory, so as to flexibly respond to the changes of the future power grid operation state, and ensure the stable operation and reliable power supply of the power system.
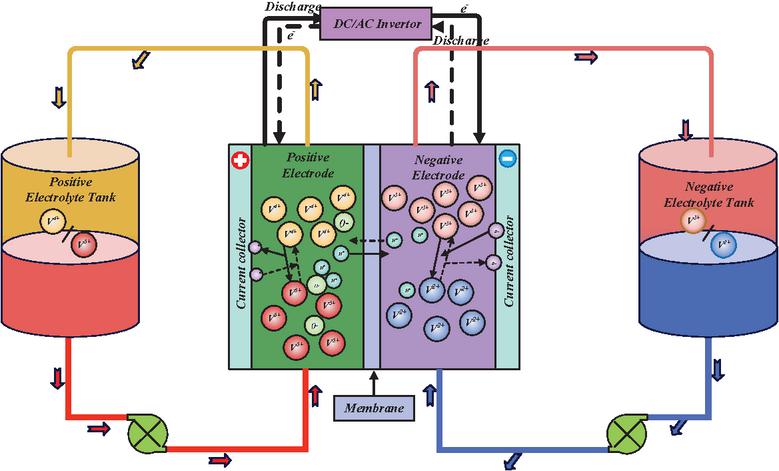
Figure 2 Internal optimization of distributed power supply.
Figure 2 shows the internal optimization of distributed power supply. The power prediction of distributed power supply is roughly divided into two categories: deterministic point value prediction and uncertain probability prediction. The power generation of distributed power supply is affected by meteorological factors. In contrast, the probabilistic prediction method can give the value of all possible photovoltaic power generation at the next moment and the probability of its occurrence, covering a relatively comprehensive prediction information, which is more valuable for arranging the operation and regulation plan of the power system at a reasonable risk level. However, both point value prediction and probability prediction, the results are not describing the distributed power output power of spatial and space correlation characteristics: in addition, the probability method need to know the probability distribution information, when the probability distribution is unknown or difficult to determine the probability distribution, probability prediction results deviation, fuzzy method, interval method provides a new way to deal with the challenge.
3 Application of CFD in Wind Energy Development
3.1 AHP
The core idea of the Analytic Hierarchy Process (AHP) is to decompose complex problems by establishing a clear hierarchical structure. It can effectively handle the internal connections and mutual independence between various evaluation indicators, quantify and synthesize them, and have strong flexibility and integrity. It is the key to analyzing complex problems and establishing an evaluation system. The construction process of the hierarchical structure model:
(1) Objective layer establishment: Firstly, clarify the overall objective of the evaluation, which is to comprehensively and accurately quantify the health status of the distributed distribution network.
(2) Criterion layer construction: Based on this goal, we have identified several key dimensions as criterion layers, such as grid structure stability, equipment performance status, and operation and maintenance management level. These dimensions are selected based on a deep understanding of the characteristics of distributed distribution networks, aiming to comprehensively cover all aspects of the health status of the power grid.
(3) Refinement of indicator layer: Under the criterion layer, further refinement is carried out into specific evaluation indicators, such as voltage stability, equipment ageing degree, failure rate, etc. Each indicator is specifically quantified based on its upper-level criteria dimension to ensure the comprehensiveness and accuracy of the evaluation.
(4) Sorting out the relationships between elements: When constructing the hierarchical structure, we clearly defined the membership relationships and mutual influences between the elements at each layer, ensuring the logical and rational structure of the entire model.
According to the monitoring node distribution model, predict index model of distribution under time series, the use of statistical information analysis method, sampling the health parameter information of HVDC distribution equipment to sample set, suppress the dc power quality disturbance processing, using the time window function TW to increase the time interval of distribution equipment, to reduce the monitoring interference, assuming dc micro power grid quality paste evaluation set for (F, Q), using multi-beam constraint control method, voltage imbalance characteristic analysis, get the energy consumption of power distribution equipment such as formula (1) as shown [24, 25].
| (1) |
Taking the voltage fluctuation and flicker of the distribution network, voltage temporary drop and voltage imbalance coefficient as the constraint parameters, the constraint parameter model of the health index of the distribution equipment is constructed, and the correlation dimension eigenvalue function of the distribution equipment health index is shown in formula (2).
| (2) |
In Equation (2), is the main frequency characteristic of the DC energy mass distribution, and the transmission scheduling set is constructed, which meets the conditions of Equation (3):
| (3) |
Through the above constraints, the dc power distribution network D, calculate distribution equipment in D distribution space, compare the ac power quality index system, build the distribution equipment health index and downward distribution equipment, distribution model, distribution equipment health index sequence distribution certainty function as shown in formula (4).
| (4) |
Where is the regional function of the information distribution of health index of power distribution [26]. Assuming that the input power distribution equipment health index time series is , according to the application scenario or voltage level ", the input and output relationship of the power distribution equipment health index is shown in formula (5).
| (5) |
According to the correlation between different indicators, the internal characteristics are extracted, and the stability is adjusted according to input current and voltage fluctuation of the distribution equipment. The fuzzy function is shown in formula (6).
| (6) |
3.2 Analysis of Fish Bone Map
It is used to organize the characteristics of the problem and the affected factors, which is an analysis method to see the essence through the phenomenon [27]. This paper adopts the countermeasure type fish bone map, which subdivides a certain problem or phenomenon into several aspects to find the cause, and lists a number of countermeasures that may be needed to improve a certain situation or achieve a certain goal.
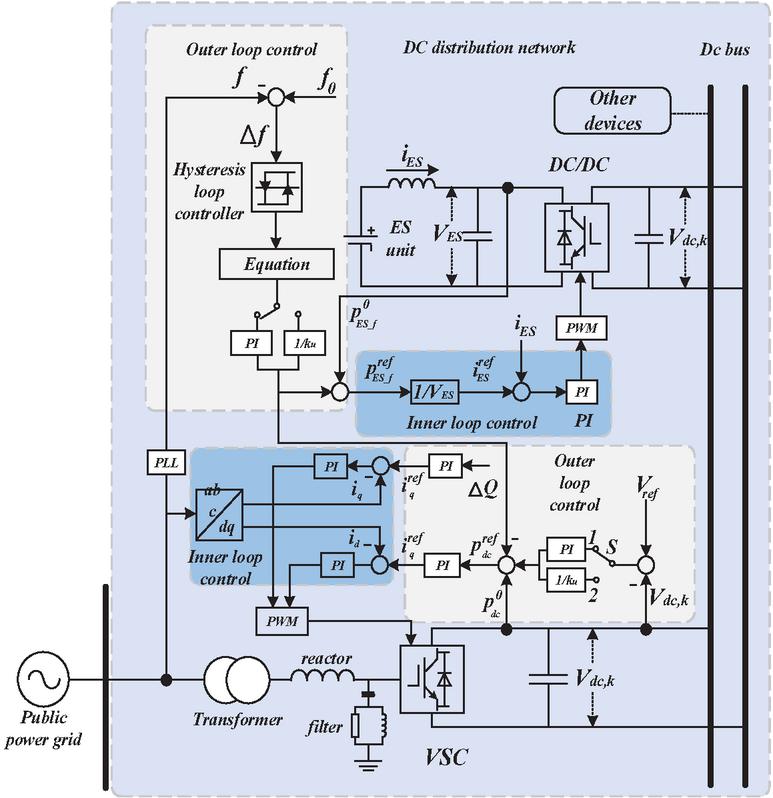
Figure 3 Internal circuit of power distribution equipment.
Figure 3 presents the internal circuit of the distribution equipment, according to the modulation of the distribution equipment output DC harmonic distributed harmonic, the distributed prediction of the distribution equipment health index, the envelope characteristics series information flow is shown in formula (7).
| (7) |
In this paper, the model of distribution equipment health index based on load balancing scheduling and maximum likelihood estimation adopts the load balancing scheduling method to analyze and evaluate the equipment. In the case of voltage waveform distortion, the correlation dimension of distribution is obtained as shown in formula (8).
| (8) |
The maximum likelihood estimation model is established, using the correlation dimension feature extraction method, and the distribution equipment health index distribution state equation is shown in Equation (9).
| (9) |
The maximum likelihood estimation model of the distribution of health equipment is established, and combined with the method of piecewise linear fitting estimation, the least squares fitting function of the distribution of health index is shown in Equation (10).
| (10) |
According to the correlation between DC energy quality indicators, the output AC component predicted by the health index of distribution equipment is shown in formula (11).
| (11) |
According to the characteristics of disturbance fluctuation, the health index time series of power distribution equipment is reconstructed in two dimensions. Using the method of voltage imbalance assessment, the fuzzy constraint vector of health index prediction assessment of power distribution equipment is shown in formula (12).
| (12) |
Efficiency of health index prediction: Device health index expression is shown in formula (13).
| (13) |
3.3 Fuzzy Comprehensive Evaluation
Fuzzy comprehensive evaluation is a kind of analysis method based on quant various fuzzy information in analysis and evaluation [28]. It uses the membership degree to describe the intermediate degree of the difference, and can reasonably quantify the qualitative indicators, so that the uncertainty of the original data in the comprehensive evaluation and the ambiguity of the evaluation criteria are better solved. When determining the evaluation criteria of indicators, the membership evaluation function is divided into three categories: benefit, cost and moderate.
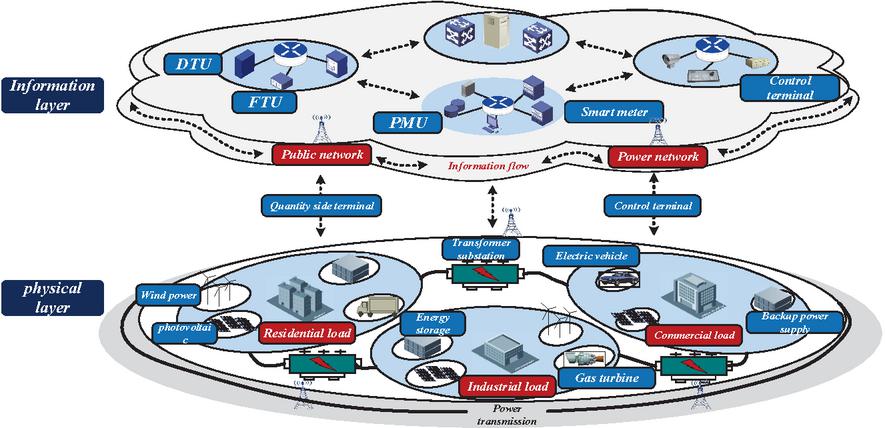
Figure 4 Overall architecture of power distribution network.
Figure 4 for the power distribution network overall architecture, this paper by combing and analyzing the existing distribution network operation level and power supply capacity of related indicators, take fish bone diagram analysis method and Delphi method screening index, Delphi method can fully comprehensive expert guidance, and through the hierarchical analysis index system hierarchy structure [29, 30]. For an individual index, the total volume index and the relative type index are mainly used. Total indicators reflect the scale or level of the power grid in a certain time scale, in quantitative indicators and relative indicators. The total index reflects the scale or level of the power grid in a certain time scale, such as the variable capacitor load ratio. The relative index represents a quantitative contrast relationship, generally expressed in percentage, and can abstract the difference of the absolute numbers in the characteristics of the power grid, such as the transfer ratio of the overloaded medium voltage line.
4 Experimental Results and Analysis
This study selected a distributed distribution network in a certain city for research, which includes multiple voltage levels and different types of power equipment such as transformers, switchgear, and lines. In practical operation, it was found that there were many problems with the distribution network. Therefore, this study designed a multi-index quantitative evaluation model based on distributed distribution network health status to optimize the distribution network.
Conduct data cleaning, outlier handling, and missing value-filling strategies for collection and processing. Firstly, clarify the scope and sources of data collection, including real-time operational data of the distribution network, equipment status monitoring data, historical fault records, and external environmental data (weather, temperature, etc.).
First, clean, denoise, and standardize the collected over 10000 real-time data to ensure that the quality meets the evaluation requirements. The steps include data format standardization and converting all data into a unified format and unit for subsequent processing and analysis. Duplicate data deletion: By comparing key fields such as timestamps and identifiers of the data, duplicate data records are deleted. Invalid data removal: Identify and remove data that is illogical or beyond a reasonable range, such as voltage values exceeding the rated voltage range of the equipment.
The presence of outliers can seriously affect the evaluation results of the model. We have employed various strategies to handle outliers, including statistical methods that utilize statistical principles such as mean, median, standard deviation, etc., to identify outliers and remove or correct them. Model-based detection: Machine learning algorithms such as clustering and outlier detection automatically identify and process outliers.
The presence of missing values can also affect the accuracy of the model. We have adopted the following strategy to fill in missing values: direct deletion: For data records with many missing values, if the deletion does not affect the integrity of the overall data, they will be deleted directly. Mean/Median/Mode imputation: Select the mean, median, or mode as the imputation values for missing values based on the data distribution. Interpolation method: Use interpolation methods in time series analysis, such as linear interpolation, polynomial interpolation, etc., to estimate missing values. Model prediction: Use machine learning models to predict and fill in missing values.
4.1 Applied Analysis
In order to realize the grid assets lean, the whole process, comprehensive management, currently in the field of power grid has made gratifying achievements. In the field of distribution, though, after city network transformation in recent years, the new urbanization distribution network and rural network construction, has made gratifying achievements, but because the distribution network foundation is weak, combined with the rapid development of distributed renewable energy, energy storage and growing load, such as electric vehicles, heat pump direct access, lead to distribution network structure is complex, the traditional technology and management mode is no longer to adapt to the development of the new situation. Compared with foreign developed countries, China has a large gap in distribution network structure, standardized construction, distribution automation and intelligence level; compared with transmission network, large distribution equipment, complex varieties, low manufacturing threshold and numerous manufacturers, insufficient basic data accumulation, low information and lean management, and low automation. Therefore, the distribution network is relatively backward in terms of basic theoretical research, new technology application and asset management, and in terms of technical quality of personnel. The main bottlenecks are manifested in:
The historical data of the distribution network is incomplete, the data accumulation and mining are insufficient, and the information means are difficult to fully support the scientific decision-making. The equipment ledger, operation and maintenance, pre-test, online monitoring and management data of power distribution assets are incomplete and have a short history, so there is a lack of underlying data accumulation and data mining. Most asset management systems are decentralized development, which are not closely combined with business. Information resource sharing between different departments and different business processes is insufficient, which is difficult to fully and effectively support the scientific decision-making of the assets of power grid companies.

Figure 5 Health status analysis of power distribution network.
For voltage stability indicators, after integrating distributed power sources (such as solar energy, wind energy, etc.), due to the uncertainty and intermittency of power generation, corresponding quantitative evaluation methods should be designed to accurately reflect the actual situation of voltage stability in the power grid. In the assessment of equipment ageing, the wear and performance degradation of conventional equipment, as well as the ageing characteristics of distributed power generation-related equipment (such as inverters, energy storage devices, etc.) and their potential impact on the overall health status of the power grid, are considered. An adaptive evaluation index for topology structure is added to address the unique network topology changes in distributed distribution networks. By analyzing the performance changes of the power grid under different distributed power access points and network reconstruction schemes, the flexibility and stability of the distribution network in responding to topology changes are evaluated.
Through optimization measures in data collection and processing, the experiment found that the completeness and accuracy of the data were significantly improved, which in turn had a positive impact on the accuracy of the model. Data cleaning and outlier handling reduce noise and interference in the data, enabling the model to more accurately capture the true characteristics of the health status of the distribution network. The effective filling of missing values avoids evaluation bias caused by data loss and improves the stability and reliability of the model. The optimized data collection and processing process provides higher-quality data support for model training and evaluation, making the evaluation results more accurate and reliable.
Figure 5 is analysis of health status of power distribution network. In terms of health status evaluation, it is limited to equipment, and the research on network health status is almost blank. Due to the large amount of power distribution equipment and relatively low individual cost, the equipment monitoring and evaluation, condition maintenance standards and decision methods adopted by the transmission network are not applicable to the distribution network; the equipment evaluation and condition maintenance standards of the distribution network lack theoretical guidance, the evaluation standards are not unified with defects, the deduction components cannot correspond one to one, without considering historical data, the hidden defects cannot be found, the evaluation results cannot truly reflect the actual situation, and the evaluation and maintenance cannot be closely combined. Key business nodes lack scientific and quantitative decision-making methods. Distribution network planning, engineering design, maintenance strategy optimization, technical transformation scheme optimization, equipment key links such as retirement, lack of comprehensive consideration of economy, security, environmental protection, etc., lack of asset life process of quantitative decision method, not for intelligent distribution network and renewable energy access to provide effective technical support.
A comprehensive economic evaluation of implementing a multi-index quantitative evaluation model based on the health status of distributed distribution networks shows that although the initial investment involves costs such as software development and data collection equipment deployment, its long-term benefits are significant. The model can significantly reduce failure rates, improve power supply reliability, and effectively reduce operation and maintenance costs, bringing considerable economic returns to distribution network operators and providing strong economic support for decision-makers.
In order to ensure the stable and reliable operation of the model in practical applications, especially when facing extreme operating conditions, it is necessary to conduct experimental verification. This study includes more diverse test cases in the validation phase, which should cover extreme operating conditions, such as sudden high current surges, long-term overload operation, performance under extreme temperature environments, etc. By using these diverse test cases, we can comprehensively evaluate the robustness and adaptability of the model, ensuring that it can maintain efficient and accurate evaluation capabilities in various complex and changing operating environments.
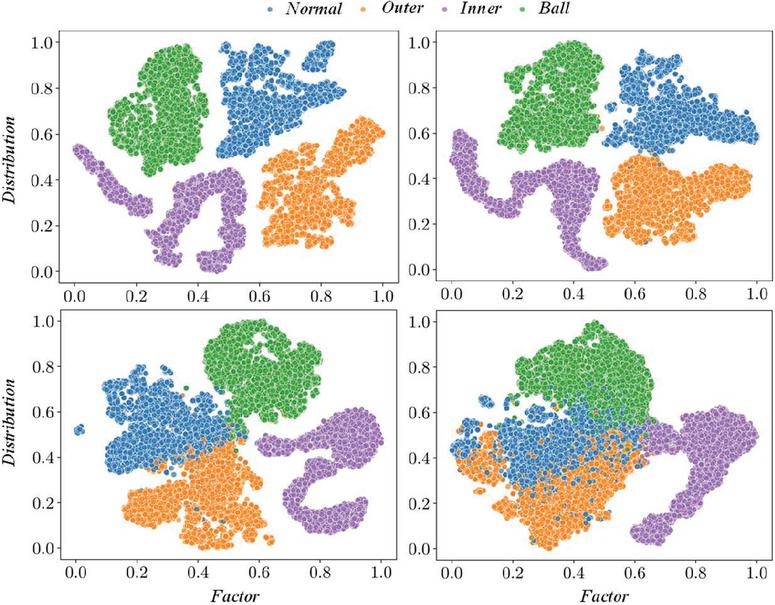
Figure 6 Evaluation the effect of smart distribution network.
Figure 6 shows evaluation of the situational awareness effect of smart distribution network and the problems faced by the comprehensive evaluation of the realization effect of smart distribution network. As the global focus on smart distribution network rises, assessing its situational awareness across various scenarios poses significant research challenges. The influx of intermittent power sources in the smart distribution network creates a unique power structure, enhancing flexibility but also introducing randomness and uncertainty, hindering situational awareness. With the advent of the information age, the introduction of new devices and rising demands for power quality and reliability have expanded the scope and complexity of data to be analyzed, increasing the data processing burden. Current evaluation systems for distribution network performance are incomplete and lack a comprehensive perspective. At present, the research focuses on the specific performance of the distribution network or the relationship between the distribution network and state assessment, such as reliability, security, or operation status and dispatching control; The comprehensive evaluation model established is subject to the differences in regional economic level and planning, with poor compatibility. The relevant comprehensive evaluation methods are insufficient, and the single evaluation method has limitations. The phenomenon of single using subjective or objective evaluation methods in the field of distribution network situational perception is still relatively common, and most of the evaluation methods use entropy weight method or hierarchical analysis method, which will inevitably lead to one-sidedness of the comprehensive evaluation results.
When the model is applied in practice, it is found that the detailed evaluation results output by the model can directly reflect the weak links and potential risks in the health status of the distribution network, providing important operation and maintenance guidance for distribution network operators, as well as valuable data support for policymakers and standard-setting institutions. Through integration and feedback mechanisms, the evaluation results of the model can directly promote policy formulation and standard improvement. Policymakers can develop more targeted and forward-looking policies based on model evaluation results. Standard-setting organizations can use model evaluation results to revise and improve relevant standards, ensuring that the design and operation of distribution networks can meet higher standards and requirements.
4.2 Risk Index Analysis of Active Power Distribution Network
In the traditional active distribution network, the trend is by the superior grid one-way to active distribution network, at present, as more and more distributed power access active distribution network, due to the given capacity is limited, active distribution network will appear in the power supply phenomenon, the active distribution network excess electricity will reverse into the voltage level higher power grid, which will lead to active distribution network trend, the equipment will bear the impact of active distribution network two-way tide, threatening the safe and stable operation of active distribution network. To minimize the impact of two-way power flow, we’ve chosen the supply-storage ratio and consumption ratio indices of the active distribution network to assess its absorption capacity for distributed energy. The supply-storage ratio indicates the network’s ability to absorb distributed energy, aiding risk assessment. The consumption ratio reflects the utilization rate of distributed energy, highlighting the network’s compatibility.
Power quality assessment in active distribution networks and distributed energy is crucial, encompassing three key aspects: grid node voltage, grid-connected node current, and frequency. Distributed energy injection of active and reactive power can raise or lower grid node voltage, exceeding safe operational ranges. During maintenance or failures, distributed energy can power outage lines and surrounding loads, creating island effects that damage equipment. When connections are restored, phase mismatch can generate harmful impact currents. Large-scale distributed energy grid connection can affect frequency stability due to the randomness and volatility of the active distribution network.
The multi-index quantitative evaluation model based on the health status of distributed distribution networks has shown significant advantages compared to other multi-index comprehensive evaluation methods. This model ensures high accuracy and real-time performance of evaluation results through deep fusion and quantitative analysis of real-time data and can timely reflect subtle changes in the health status of the distribution network.
4.3 Example Analysis
The IEEE-RBTS BUS6 case study validates our proposed algorithm, involving a distribution network with 82 primary equipment and 40 load points. IEEE raw data covers network topology, active power demands, and equipment repair times. Health values for equipment are based on power grid company norms. Unit power losses are categorized by load type, ranging from 0.57 to 0.79 yuan per kWh. We calculated real-time failure rates and employed the minimum path method to assess failure rates and durations for each load point, considering network topology, repair durations, and power demands. Power losses due to load losses were estimated, considering load point significance. Overall network risk was quantified, encompassing failure rates, durations, and power losses across all load points.
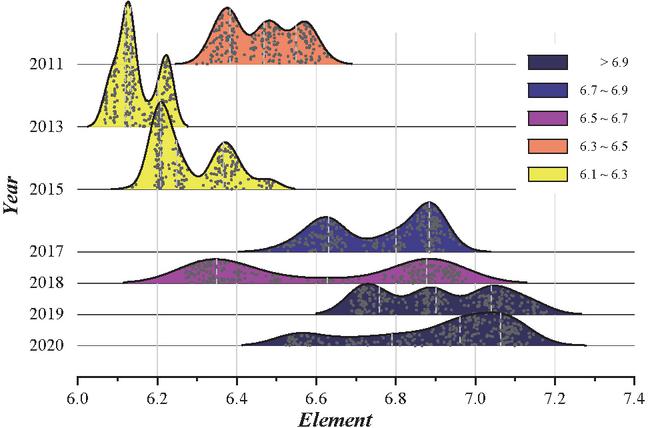
Figure 7 Example analysis of smart distribution network elements.
Figure 7 is an example analysis of intelligent distribution network elements. For the transformer with 33 kV to 11 kV voltage level in IEEE-RBTS BUS6 system, the traditional analysis of the equipment failure only causes loss of the equipment itself, will not cause the network to lose load, the resulting problem of weak grid structure is not considered or considered through qualitative way, lack of risk calculation method. Hillside terrain to platform area and foundation stability to meet the requirements, usually increase the machine platform dig depth, this section in the same high slope, the machine platform dig height simulation calculation, excavation depth change, essentially changed the distance between the tip and slope, under the tip under the slope height, flow will be blocked by the slope.
The wind speed of the lower blade tip on the disk is the most sensitive to the height of the slope. With the increase of the excavation depth, the lower blade tip is closer to the high edge slope, or even buried below the slope, and the wind speed decreases seriously. The positive value indicates that the lower blade tip is under the slope, and the wind speed of the height of the hub and the upper blade tip gradually flattening with the increase of the excavation depth. The wind shear value of the lower blade tip corresponding to the height. This analysis is the condition of the front slope. If the wind comes from the back slope, the platform is more sensitive to the excavation depth, and the shielding of the lower blade tip will extremely deteriorate the wind condition of the lower disk surface of the unit.
5 Conclusion
After in-depth research and empirical analysis, the multi-index quantitative evaluation model based on the health status of the distributed distribution network proposed in this paper has shown significant application value and practical significance. The following are the main conclusions of this paper. By selecting and comprehensively considering 10 key indicators, voltage stability, equipment aging degree, failure incidence, etc., the model successfully realizes a comprehensive analysis of the health status of the distribution network. Compared with the traditional single index evaluation method, the accuracy and comprehensiveness of the evaluation are improved. During the study, over 10,000 real-time data were collected for the validation and optimization of the model. The actual test shows that the evaluation accuracy of the model is as high as 95%, which provides powerful decision support for the operation and management of the distribution network. This study also aims at the characteristics and challenges of the distributed distribution network, and proposes solutions to the problems such as incomplete data collection and difficult to determine the weight of evaluation indicators. By optimizing the data collection and processing process, the integrity and accuracy of the data are improved. At the same time, the hierarchical analysis method and fuzzy comprehensive evaluation method scientifically determine the weight of each index, which ensures the objectivity and accuracy of the evaluation results to improve the health status of distributed distribution network and ensure the safe and stable operation of the power system. In the future, we will continue to conduct in-depth research on the application and optimization of multi-index quantitative evaluation methods and promote the improvement of distribution network operation and management level. By implementing strategies such as modular design, configurable parameters, and open interfaces, we ensure that the model can maintain its long-term effectiveness and scalability to meet future power grid development’s diverse and complex needs.
Funding
This work was sponsored in part by The innovation project of China Southern Grid (GZKJXM20222422).
References
[1] Antwi-Boasiako, E., S. Zhou, Y. Liao, E. Kuada and E. K. Danso, “Enhanced privacy-preserving distributed deep learning with application to fog-based IoT,” Internet of Things, vol. 26, pp. 101183, 2024.
[2] Chen, X., B. Zhu, Y. Liu and T. Li, “Ecological and risk networks: Modeling positive versus negative ecological linkages,” Ecological Indicators, vol. 166, pp. 112362, 2024.
[3] Cheng, K., K. Zhang, Y. Wang, C. Yang, J. Li and Y. Wang, “Research on gas turbine health assessment method based on physical prior knowledge and spatial-temporal graph neural network,” Applied Energy, vol. 367, pp. 123419, 2024.
[4] Dui, H., J. Wang, T. Zhu and L. Xing, “Maintenance optimization methodology of edge cloud collaborative systems based on a gateway cost index in IIoT,” Reliability Engineering & System Safety, vol. 251, pp. 110370, 2024.
[5] Ghomi-Avili, M., S. T. A. Niaki and R. Tavakkoli-Moghaddam, “A blockchain-based system for a network design problem considering pricing decisions and sustainability,” Journal of Cleaner Production, vol. 423, pp. 138696, 2023.
[6] Guo, X., Q. Feng, B. Sun, Y. Ren, D. Fan, J. Pan and Z. Wang, “Integrated assessment of reliability and health status of multi-microgrids based on multiagent,” Reliability Engineering & System Safety, vol. 245, pp. 109978, 2024.
[7] Hong, W., T. Ma, R. Guo, X. Yang, X. Li, M. Sun, Y. Chen and Y. Zhong, “Carbon emission characteristics of urban trip based on multi-layer network modeling,” Applied Geography, vol. 159, pp. 103091, 2023.
[8] Huang, J., C. Chen, C. Sun, Y. Cao and Y. An, “An integrated risk assessment model for the multi-perspective vulnerability of distribution networks under multi-source heterogeneous data distributions,” International Journal of Electrical Power & Energy Systems, vol. 153, pp. 109397, 2023.
[9] Jiao, L., L. Wang, H. Lu, Y. Fan, Y. Zhang and Y. Wu, “An assessment model for urban resilience based on the pressure-state-response framework and BP-GA neural network,” Urban Climate, vol. 49, pp. 101543, 2023.
[10] Jing, X., S. Tao, H. Hu, M. Sun and M. Wang, “Spatio-temporal evaluation of ecological security of cultivated land in China based on DPSIR-entropy weight TOPSIS model and analysis of obstacle factors,” Ecological Indicators, vol. 166, pp. 112579, 2024.
[11] Li, G., L. Cheng, A. Zhang, J. Yang, F. Wang and C. Ma, “Model test research on arch dam displacement monitoring based on distributed strain sensing,” Measurement, vol. 223, pp. 113795, 2023.
[12] Lin, H., W. Wang, Y. Zou and H. Chen, “An evaluation model for smart grids in support of smart cities based on the Hierarchy of Needs Theory,” Global Energy Interconnection, vol. 6, no. 5, pp. 634–644, 2023.
[13] Ma, N., S. Wang and S. Hao, “Enhancing Reptile search algorithm with shifted distribution estimation strategy for coverage optimization in wireless sensor networks,” Heliyon, vol. 10, no. 15, pp. e34455, 2024.
[14] Ma, X., Y. Wang, Z. Liu and X. Feng, “Comprehensive evaluation of 5G+ smart distribution network based on combined weighting method-cloud model,” Global Energy Interconnection, vol. 5, no. 6, pp. 675–691, 2022.
[15] Mousaei, A., M. Gheisarnejad and M. H. Khooban, “Challenges and opportunities of FACTS devices interacting with electric vehicles in distribution networks: A technological review,” Journal of Energy Storage, vol. 73, pp. 108860, 2023.
[16] Saura, P. F., J. M. Bernabé Murcia, E. G. de la Calera Molina, A. Molina Zarca, J. Bernal Bernabé and A. F. Skarmeta Gómez, “Federated Network Intelligence Orchestration for Scalable and Automated FL-Based Anomaly Detection in B5G Networks,” Computers, Materials and Continua, vol. 80, no. 1, pp. 163–193, 2024.
[17] Singh, B. and P. K. Dubey, “Distributed power generation planning for distribution networks using electric vehicles: Systematic attention to challenges and opportunities,” Journal of Energy Storage, vol. 48, pp. 104030, 2022.
[18] Wang, X., Y. Li, K. Noman and A. K. Nandi, “Multi-task learning mixture density network for interval estimation of the remaining useful life of rolling element bearings,” Reliability Engineering & System Safety, vol. 251, pp. 110348, 2024.
[19] Wen, L., G. Yang, L. Hu, C. Yang and K. Feng, “A new unsupervised health index estimation method for bearings early fault detection based on Gaussian mixture model,” Engineering Applications of Artificial Intelligence, vol. 128, pp. 107562, 2024.
[20] Xiong, Y., Z. Liu, J. Tan and L. Hao, “Multi-scale adaptive-routing capsule contrastive network-based intelligent fault diagnosis method for rotating machinery under noisy environment and labels,” Advanced Engineering Informatics, vol. 62, pp. 102712, 2024.
[21] Yan, X., W.-J. Yan, Y. Xu and K.-V. Yuen, “Machinery multi-sensor fault diagnosis based on adaptive multivariate feature mode decomposition and multi-attention fusion residual convolutional neural network,” Mechanical Systems and Signal Processing, vol. 202, pp. 110664, 2023.
[22] Yang, L. and J. Teh, “Review on vulnerability analysis of power distribution network,” Electric Power Systems Research, vol. 224, pp. 109741, 2023.
[23] Yifan, Z., Z. Sida, Z. Zhengjie, Z. Xinan, C. Rui, L. Qiangwei, G. Zichao, F. Chengcheng and Y. Shichun, “A capacity fade reliability model for lithium-ion battery packs based on real-vehicle data,” Energy, vol. 307, pp. 132782, 2024.
[24] Zhang, X., Y. Jiang, C. Li and J. Zhang, “Health status assessment and prediction for pumped storage units using a novel health degradation index,” Mechanical Systems and Signal Processing, vol. 171, pp. 108910, 2022.
[25] Zhang, X., W. Qiao, Y. Lu, S. Sun and Q. Yin, “Construction and application of urban water system connectivity evaluation index system based on PSR-AHP-Fuzzy evaluation method coupling,” Ecological Indicators, vol. 153, pp. 110421, 2023.
[26] Zhang, Y., W. Wen and L. Wang, “Resilience assessment of airport aircraft area network operations under thunderstorm weather,” Journal of Air Transport Management, vol. 119, pp. 102656, 2024.
[27] Zhao, G., H. Di, H. Bai and Y. Lin, “A cable health assessment method based on multi-agent and matter-element extension model,” Sustainable Energy Technologies and Assessments, vol. 56, pp. 103108, 2023.
[28] R, N., D. T. Murthy and M. M. Rajput, “Modeling Renewables Based Hybrid Power System with Desalination Plant Load Using Neural Networks,” Distributed Generation & Alternative Energy Journal, vol. 34, no. 1, pp. 32–46, 2019.
[29] Sendilvelan, S. and K. Bhaskar, “Experimental Analysis of Partially Premixed Charge in a Diesel Engine with Jatropha Oil Methyl Ester and Diesel Blends,” Distributed Generation & Alternative Energy Journal, vol. 34, no. 1, pp. 47–60, 2019.
[30] Ghouari, A., C. Hamouda, A. Chaghi and M. Chahdi, “An Experimental Study on the Smart Home Concept with PV and Energy Management and Control Strategy Using an Open Source Platform,” Distributed Generation & Alternative Energy Journal, vol. 34, no. 1, pp. 61–80, 2019.
Biographies

Yao Zhang was born in 1988 in Guizhou, and holds a Master’s degree in Engineering. He graduated from the University of Nottingham, UK, in 2014. Currently, he is employed at Electric Power Dispatching and Control Center, Department of Distribution Control, Guizhou Power Grid, primarily engaged in specialized technical work related to distribution network scheduling and operations.

Zhongqiang Zhou was born in 1994 in Guizhou, and also possesses a Master’s degree in Engineering. He completed his studies at Guizhou University in 2019. He is currently working at Electric Power Dispatching and Control Center, Automation Department, Guizhou Power Grid, focusing mainly on specialized technical work in distribution automation.

Yin Lian was born in 1986 in Guizhou, China, and has earned a Master’s degree in Engineering. He graduated from Guizhou University in 2012. Presently, he works at the Xingyi Power Supply Bureau, Electric Power Dispatching and Control Center, where he is primarily involved in specialized technical tasks related to distribution automation.

Kun Zhou was born in 1989 in Yunnan, China, holding a Bachelor’s degree in Engineering. He graduated from North China Electric Power University in 2012. He is now employed at the Bijie Power Supply Bureau, Electric Power Dispatching and Control Center, primarily working on distribution network dispatch automation.

Qihong Shi, born in 1994 in Guizhou, China, holds a Bachelor’s degree in Engineering. He graduated from Shanghai University of Electric Power in 2016. Currently, he works at the Anshun Power Supply Bureau, Electric Power Dispatching and Control Center, mainly dedicated to specialized technical work in distribution automation.
Distributed Generation & Alternative Energy Journal, Vol. 39_5, 961–988.
doi: 10.13052/dgaej2156-3306.3952
© 2024 River Publishers