Research on Power Balance and Measurement of New Energy Power System Based on Graph Neural Network
Kang Liyan*, Cui He and Zhao Leiyang
State Grid Liaoning Electric Power Co., Ltd. Marketing Service Center, Shenyang, 110000, Liaoning, China
E-mail: forecon2@163.com
*Corresponding Author
Received 24 July 2024; Accepted 13 October 2024
Abstract
With the surge of new technologies, such as high penetration of new energy, ultra-high voltage transmission, and intelligent digital power grids, the power system has become increasingly complex and requires stricter safety and stability standards. To address this issue, this paper introduces a transient stability analysis method using graph convolutional neural networks. This method combines short-term simulation with neural network prediction, reducing analysis time and making it suitable for various simulation scenarios. It also combines models with algorithms to quickly and robustly optimize transient stability control strategies for expected faults. This method is superior to traditional methods in terms of runtime and efficiency. The test results of IEEE-30 and IEEE-39 node systems confirm the effectiveness, efficiency, and superiority of our proposed method. In high-tech energy systems, the volatility and uncertainty of wind and photovoltaic power generation output significantly affect power balance. The increasing renewable energy production capacity in China poses a challenge to reliable electricity supply. Based on actual data analysis of daily and seasonal fluctuations in new energy output, we have summarized power balance issues at different time scales. Using a time series production simulation model, the balance problem in high-tech energy systems was studied, and the supply shortage of typical power grids was quantitatively analyzed. Solutions were proposed, with the daily peak fluctuation of new energy in the power grid reaching 79.96 million kilowatts, an increase of 41% compared to the previous year.
Keywords: Graph neural network, new energy, power system, power balance.
1 Introduction
China leads in new energy capacity, with wind and photovoltaic topping global charts at 170 million kW and 180 million kW, respectively [1, 2]. New energy comprises 19.8% of total installed capacity, ranking second in the power mix. In the “three North” regions, it holds a significant share, exceeding 30% in Gansu, Ningxia, Xinjiang, and Qinghai, with Gansu topping at 42.1%. Penetration rates over 40% are seen in Gansu, Xinjiang, Qinghai, Jilin, and Northern Hebei, with some regions exceeding 100% [3]. Output-wise, Eastern Mongolia, Gansu, Ningxia, and Jilin surpass 50%, peaking at over 60% in Mongolia, Ningxia, and Gansu. By 2025, China aims for over 50% new energy capacity in resource-rich areas and over 30% new energy electricity.
In the traditional power system, the random fluctuations of the load are often balanced by controlling the conventional generator set. In the high proportion of new energy power systems, the output of new energy fluctuates greatly. It has uncertainty, which does not match the power load curve, thus increasing the adjustment burden of the conventional power supply [4, 5]. During the low load period, the output of new energy is large, which leads to the peak regulation of the power system; during the peak load period, the output level of new energy is low, so the power grid must take orderly power consumption measures. For example, on December 10, 2018, the wind was generally low; the maximum wind power output was 630,000 kW, the maximum late load peak output was 460,000 kW, the maximum photovoltaic was 3 million kW, and zero late load peak. Due to the lack of power supply in the province, the orderly electricity consumption of 1.37 million kW was actually implemented during the late load peak hours. “Three north” provinces have taken orderly electricity consumption measures because of the small output of new energy [6].
Whether in the planning stage or the operation stage, the characterization of uncertainty factors is the basis of the calculation and evaluation of power supply and demand balance [7, 8]. In order to carry out the power balance calculation in the new power system with the increasing proportion of new energy, the superposition of multiple uncertainty factors becomes the core content. For the characterization of uncertain factors, the probability distribution statistics method or the scene fluctuation simulation method are generally adopted [9]. In power systems, most studies use the method of probability distribution analysis to provide the fluctuation interval or density function of uncertain factors in the future so as to characterize them [10, 11]. The probability distribution modeling methods need to consider two types of problems: one is how to model a single uncertainty factor, and the other is how to model the coupling of multiple uncertainty factors.
Current domestic and foreign research on high-new-energy power systems mainly focuses on existing installed capacity issues, such as key factor analysis, technical measures, foreign experiences, DC link optimization, and regional grid coordination. However, due to limited actual data, in-depth studies on future power balance challenges with higher energy installed capacity are rare. Power balance, a key to grid safety, poses a significant challenge for China’s future high-new-energy systems. Therefore, this paper uses current new energy and load data to establish a power balance model, quantitatively studying the high-new-energy power balance problem. It proposes solutions to ensure grid safety and guide faster new energy development.
2 New Power Quantity Balance Calculation Method of Electric Power System
How to accurately calculate the power balance of the new power system with multiple uncertain factors is the core of the system planning and operation. Based on the analysis of multiple uncertain factors, summarize the calculation method of power balance and put forward some problems [12].
2.1 Methods for Characterization of Multiple Uncertainty Factors
New energy power supply can theoretically be regarded as a typical single uncertain characteristic variable aggregate [13, 14]. In wind power, for example, its output decision parameters mainly for wind speed, so it can be based on the historical data randomly generated from a large number of scenarios to fit the uncertainty or extract the wind speed parameters of approximate distribution and real distribution assumed to obey the approximate distribution, with the increase of sampling fitting, Monte Carlo method can basic accurate prediction. However, the calculation efficiency also fell year on year [15, 16]. In addition, in the project of the decision on new energy power output in addition to meteorological factors also by the geographical location, energy conversion, power station design, electrical efficiency, etc., the parameter historical data set is relatively narrow, namely through the traditional probability statistical method model is not strong representative, this phenomenon will also along with the increase of new energy proportion and more obvious.
In addition to characterizing a single uncertainty factor, the multiple uncertainty coupling problems existing in each link in the system should also be considered. The two sides of the source load show a high correlation under certain conditions, such as low-temperature weather conditions, which may lead to the output of the fan blade and the heating load [17]. At present, the correlation analysis method for multiple uncertain factors decision variables includes linear correlation coefficient, rank correlation coefficient, Copula function and other algebra; this kind of algebra method is applied to the short and short scale coupling factors correlation analysis can achieve ideal results, but in long scale, this is due to the source/load fluctuation frequency and amplitude increase over time, can analyze the scene and associated data is highly dense, using the deterministic algebra operation is difficult to describe the correlation of coupling factors in massive data accurately. Therefore, we can change the correlation algebraic relation (joint distribution) of the traditional source charge uncertainty coupling into convolution and convolution operation of a probability distribution based on the probability method. The above two methods for the system only two uncertain factors have strong computing power, different from the thermal power of traditional power system; new energy proportion of the new power system will have wind power output, photovoltaic output, load output, coal supply, balance resource response will coupling multiple uncertain factors of aggregation and superposition. Obviously, the method cannot be an efficient, accurate characterization of multiple uncertain factors.
2.2 Quantified Calculation Method of Power Supply and Demand Balance
The quantitative calculation of power balance in the new power system with an increasing proportion of new energy is the basis of the simulation system planning and operation. Its main purpose is to evaluate whether the new power system has mature and reliable operation and safe production capacity [18]. Because of new energy/high proportion of power system compared with low ratio system has a longer time scale adjustment ability, balance resources in the whole time scale can realize collaborative operation and state dependency, makes the energy interaction under different time scales more closely, especially in the long-and medium scale production plan need to pay special attention. From a mathematical point of view, it is to conduct random simulation calculations according to the uncertain factors in each link of the system or to build simulation scenarios under typical conditions.
Stochastic simulation calculation mainly includes temporal and non-temporal methods. The timing method has the advantages of intuitive calculation results and more feedback information. However, in order to obtain the annual simulation situation, it is necessary to characterize the new energy output timing curve of the whole year. The current characterization method is not enough to support the effectiveness and accuracy of the medium and long-term timing curve [19, 20]. In addition, the calculation amount of the annual system simulation evaluation is very large and takes a long time. Therefore, when applying timing mode, it is often necessary to use the method of time dimension reduction and spatial decoupling to compress the simulation space. Suppose there are a large number of units in the unit combination (unit commitment, UC) model in the simulation process. In that case, it is necessary to simplify the technical constraints in the operation process to reduce the operation complexity, such as ignoring the topological structure of the power grid and not considering the hot and cold start of the unit [21]. While the amount of data to be entered in the non-temporal simulation is only determined by the number of states to be evaluated, the calculation speed is relatively fast, and it is easy to consider the relatively refined factors of uncertainty, Such as the flexible unit maintenance plan shutdown, circuit failure. Moreover, in the model calculation, the difficulty of polynomial calculation when the number of units is large cannot be ignored.
The power balance formula and power factor formula are shown in formula (1) and formula (2):
| (1) | |
| (2) |
The formula of voltage and current relationship and measurement error of electricity quantity are shown in formula (3) and formula (4):
| (3) | |
| (4) |
The typical scenario simulation calculation is mainly used for the typical daily operation and medium and long-term operation simulation research of the power system, aiming to evaluate whether the power balance resources of the system are sufficient, but it is impossible to fully describe the power balance state at multiple time scales. It is worth mentioning that in the actual power system balance process of resource planning, scheduling, general use of extensive production planning method to maximize the expansion of power balance, which is through the overall operation cycle of the maximum load capacity data and can quickly put into production, to set a certain amount of confidence interval to formulate the corresponding power generation plan, ensure power full time to meet the highest power demand [22, 23].
2.3 Optimization Algorithm
Optimization algorithms are an innovative approach to address the challenges posed by volatility and uncertainty in renewable energy sources. The core of this method is to use the powerful spatial and temporal modeling capabilities of the graph neural network to realize the accurate description of the complex network structure of the new energy power system, and to optimize the power balance on this basis [24]. The traditional calculation method of power balance often relies on fixed mathematical models and parameters, which is difficult to cope with the randomness and rapid change of new energy output. The optimization algorithm based on the graph neural network can automatically extract the hidden characteristics and operation rules in the power network through the deep learning of historical data, so as to more accurately predict the output of new energy and optimize the power balance. The optimization algorithm first constructs a graph neural network model with information about power network topology, new energy output prediction, operation constraints and so on.
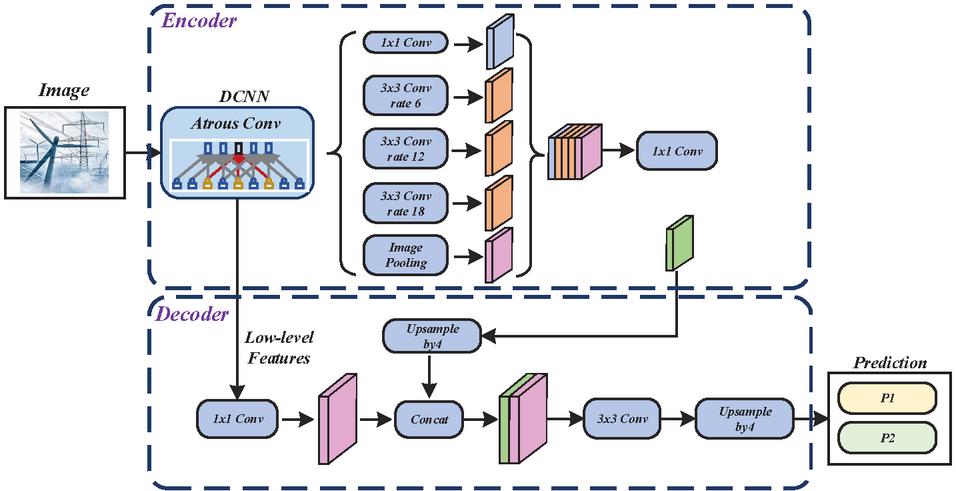
Figure 1 Power optimization model.
Figure 1 shows the power optimization model, which is trained and optimized to learn the optimal power balance strategy automatically. This strategy not only considers the current electricity demand and new energy output situation but also predicts future changes in electricity demand, achieving planning and optimization of future electricity balance. In terms of user-side demand response management of GNN, preprocessing work such as cleaning and conversion is carried out by collecting user electricity consumption behavior data, power system status data, etc. Construct a graph structure representing user electricity consumption behavior based on the correlation between users and the interaction between users and the power system. Based on the trained GNN model, precise demand response strategies can be developed, and relevant information and incentive measures can be pushed to users through channels such as smart meters and mobile apps.
3 Application of Graph Neural Network in New Energy Power System
3.1 Prediction and Monitoring
The power system is crucial for modern society’s progress. Effective modeling and control techniques are crucial for its stability and efficient energy usage [25, 26]. Neural networks, a computational model simulating brain neurons, have gained significant attention in power system applications due to their rapid development. This paper aims to investigate neural network-based modeling and optimization control methods to enhance the power system’s operational efficiency and performance. It can realize complex information processing through learning and pattern recognition.
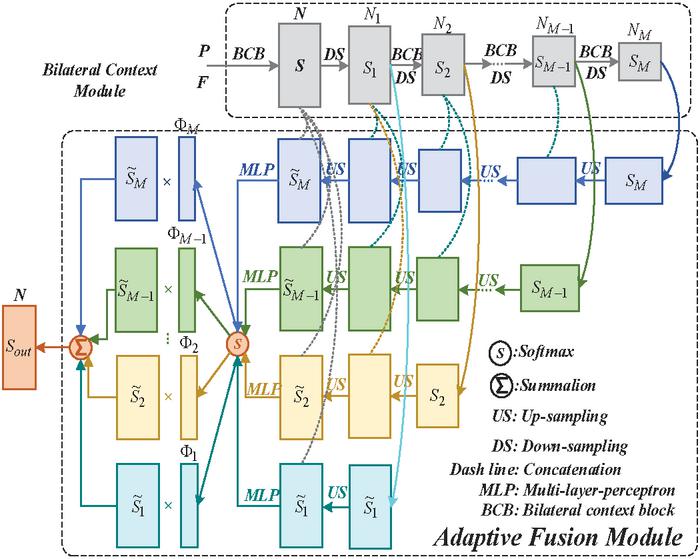
Figure 2 Power prediction process of neural network.
In the new energy power system, the issue of power balance and metering involves multiple factors, such as the topology of the power grid, load changes, new energy generation capacity (such as wind and solar energy), and external environmental conditions (such as meteorological conditions). As a powerful graph-structured data processing tool, graph neural networks can naturally handle the complex relationships between nodes (such as generators, substations, users, etc.) and edges (such as transmission lines) in the power grid. In terms of multi-source data fusion, graph neural networks can first convert multi-source data (such as meteorological data, load data, and new energy generation prediction data) into graph-structured data suitable for graph neural network processing, and use graph convolutional networks to aggregate and update graph-structured data, learning potential relationships between nodes and edges. Input meteorological data as external features into GCN and integrate it with internal features of the power grid, such as load data and new energy generation forecast data, to improve the accuracy of power balance analysis. Figure 3.1 shows power prediction process of graph neural network. Neural network can predict relevant parameters such as power load, electricity price and electricity quantity by learning historical data. At the same time, the neural network can also monitor the abnormal situation in the power system, such as fault and short circuit, and advance warning. The prediction formula of new energy generation and system stability index formula are shown in Equations (5) and (6):
| (5) | |
| (6) |
The operation status of new energy power systems is affected by various factors. In order to detect and solve potential problems in a timely manner, this study has established an efficient continuous monitoring mechanism, which collects real-time operational data of key parameters such as system power generation, electricity consumption, voltage, and current for analysis. During the continuous monitoring process, GNN is used to model the power system. By learning historical and real-time data, a dynamic graph model of the power system is constructed to continuously update the system’s operating status and achieve system adjustments.
3.2 Optimized Dispatching
The neural network can optimize the dispatching of power resources according to the real-time state of the power system and various constraints. By establishing a suitable model, the neural network can realize the optimal operation of the power system and improve the energy utilization efficiency [27]. The measurement problems of new energy power system mainly include electric energy measurement and power factor measurement. Traditional measurement methods often rely on hardware equipment and manual operation, which has the problems of large error and low efficiency.
Graph neural network can realize the accurate measurement of power energy and power factor through deep learning and analysis of power grid data. For example, the electric energy measurement model based on the graph attention network (Graph Attention Network, GAT) can realize the automatic measurement of electric energy by learning the structure of the power grid topology and the current, voltage and other data.
Graph attention networks introduce an attention mechanism in graph neural networks, dynamically adjusting the connection strength between nodes by calculating the attention coefficient between nodes. In power load forecasting, GAT can learn the correlation between power loads in different regions and periods, achieving accurate prediction of power loads. Meanwhile, through the attention mechanism, GAT can also quickly respond to changes in power load caused by unexpected events such as sudden weather changes, equipment failures, etc.
The graph autoencoder (GAE) performs dimensionality reduction and reconstruction on graph-structured data through the structure of the encoder and decoder. In the new energy power system, GAE can be used for feature learning of the power grid, mapping high-dimensional grid topology data to a low-dimensional space for subsequent analysis and prediction. Meanwhile, through the reconstruction process, GAE can also verify and correct the topology structure of the power grid, improving the quality and reliability of data.
The formula of graph neural network loss function and the embedding similarity formula of graph neural network nodes are shown in Equations (7) and (8):
| (7) | |
| (8) |
The formula of information transfer between layers of the graph neural network (considering the adjacency matrix) is shown in Equation (9):
| (9) |
3.3 Intelligent Control
Neural networks can be applied to intelligent control in power systems, including frequency and voltage regulation. By continuously monitoring system states, the neural network can promptly adjust control strategies to maintain power system stability [28, 29]. In practice, most people take the load curve of the maximum load day in the dry season as a typical load curve. The annual maximum load of the planning level year is scientifically reasonably predicted by combining selected load curves [30].
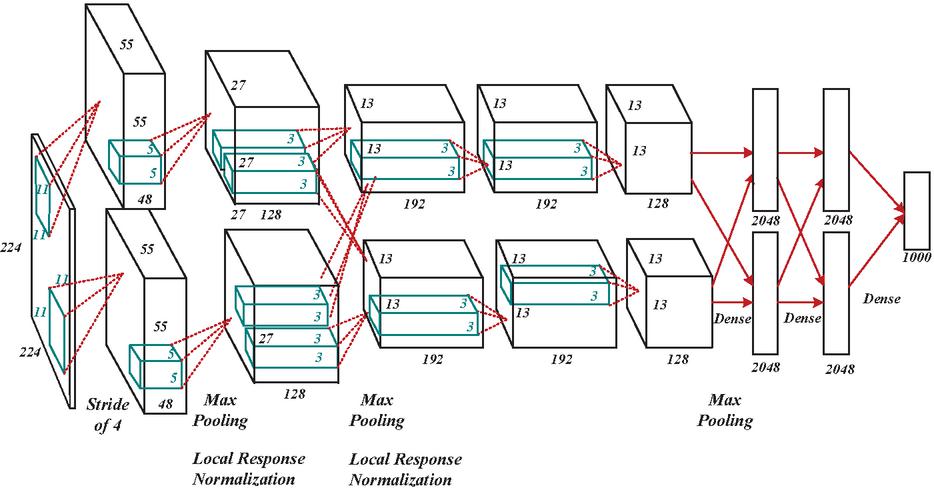
Figure 3 Overall architecture of the network.
Figure 3 shows overall network architecture. Combining long-term forecasting with short-term adjustments can grasp the long-term patterns of new energy generation and flexibly respond to short-term fluctuations and uncertainties. Using GNN to construct short-term and long-term electricity forecasting models, the short-term electricity forecasting model mainly focuses on the electricity demand and new energy generation situation in the next few hours to days. By integrating multi-source heterogeneous information such as power grid topology and historical load data through GNN, the mutual influence between different components in the power grid and the impact of external environmental factors on power supply and demand are captured, achieving high-precision short-term forecasting. The long-term electricity forecasting model focuses on the electricity demand and new energy generation trends in the coming weeks to months or even longer and delves deeper into the potential patterns in the data to achieve accurate prediction of the long-term trend of new energy generation.
Table 1 Network type selection and determination coefficient setting
| Absolute Mean | ||
| Error of the | Self-determination | |
| Network Type | Mean Value | Coefficient |
| Recurrent neural network | 0.0423 | 0.9024 |
| One-dimensional convolutional neural network | 0.0267 | 0.9400 |
| Two-dimensional convolutional neural networks | 0.0017 | 0.9684 |
Table 1 shows the selection of network types and the setting of determination coefficients. This study designed a reinforcement learning algorithm that takes the output of a graph neural network as input and learns the optimal transient stability control strategy through the interaction of the power system. During the training process, corresponding rewards or punishments are given to the reinforcement learning algorithm based on the system’s response to guide it toward better strategy adjustments. By continuously collecting new data and updating the parameters of graph neural networks and reinforcement learning models, the control strategy is continuously optimized to adapt to the long-term changes of the new energy power system.
Graph neural network node update formula is shown in Equation (10):
| (10) |
The weight formula of graph neural network edges is shown in Equation (11):
| (11) |
This study combines cloud computing, large-scale parallel computing, and graph neural networks to solve complex computing problems in new energy power systems. Large-scale parallel computing technology based on the cloud computing platform, achieving task partitioning, data distribution, and computation synchronization. By implementing reasonable task allocation and data distribution strategies and fully utilizing the computing resources of cloud computing platforms, parallel processing of computing tasks can be achieved, and computing efficiency can be improved.
4 Experimental Results and Analysis
4.1 Output Uncertainty Analysis of New Energy Power Supply
Medium-and long-term new energy output uncertainty. In 2030, the ratio of new energy output to the total load of the system is 5%51%, and in 2060, the ratio of the total load of the system is 16%142%. In addition, the power generation of new energy sources also shows seasonal characteristics, such as wind power in wind capacity; photovoltaic power generation increases in spring and autumn compared with summer and winter.
Figure 4 Analysis of short-term output uncertainty of new energy.
In the uncertainty modeling of new energy power generation prediction, GNN is used to learn the complex relationship between new energy power generation and factors such as weather and geographical location and to quantify the uncertainty of prediction results by generating prediction intervals or probability distributions. Figure 4 shows the uncertainty analysis of the short-term output of new energy sources. In 2019, in the operating power fluctuation of State Grid Corporation of China, the daily maximum power of new energy reached 107 million kW, accounting for 31% of its installed capacity. It is estimated that the daily maximum power of new energy in 2050 will exceed 1 billion kW; the peak output difference of new energy adjacent days in Northwest Power grid can reach 20 million kW, and the 15 min fluctuation can reach 4 million kW. In period of low output of new energy, the power system needs a certain capacity to achieve power balance; in period of high output of new energy, system needs to have efficient absorption means to realize low carbon and clean power generation.
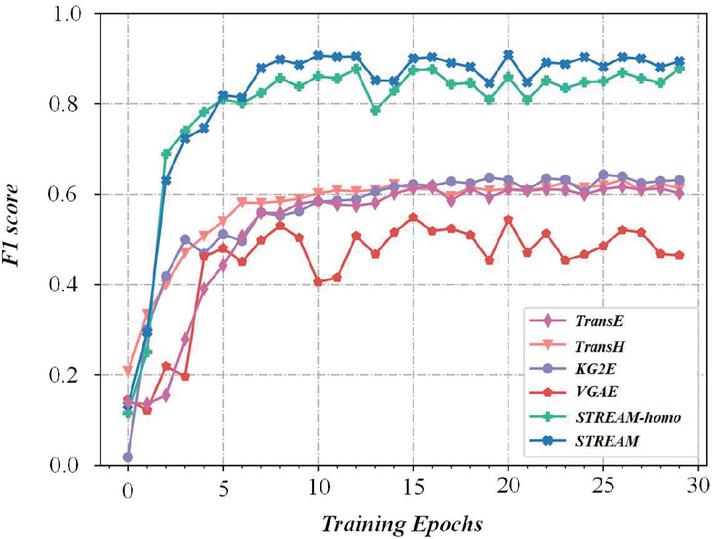
Figure 5 F1 score value comparison.
Figure 5 shows a comparison of F1 score values of graph neural networks and various methods, with STREAM-homo having the best effect. The space of new energy output is uncertain. Taking wind power as an example, wind farms cover a wide area, and the installed position of fans is different; different fans at the same site may have different outputs under the same natural conditions, or there is a complementary power generation situation, namely spatial smoothing effect, which makes the total output of the wind farm difficult to predict. With the acceleration of the development scale of new energy power supply, such phenomenon will be more prominent, so the spatial dimension characteristics of power supply have also become a kind of uncertain factor in the power side of the new power system with the increasing proportion of new energy.
The root mean square formula for the prediction error of new energy generation is shown in Equation (12):
| (12) |
Extreme weather is becoming more frequent. In recent years, global warming has caused frequent extreme weather, such as high temperatures and extreme cold. In August 2020, California experienced severe high-temperature weather, resulting in a sharp increase in cooling load, wind power and hydropower output, and a large-scale power wheel shutdown accident; in February 2021, Texas experienced extreme cold weather, low temperature, the fan was suspended due to blade freezing, and the output of natural gas was reduced due to wellhead freezing, which affected the gas turbine operation, and finally, the power supply and demand gap. In particular, extreme conditions in some extreme scenarios for the mechanism of the system will appear as “evolution, upgrade”, further enhancing the uncertainty, such as in August 2022 in the Sichuan region in extreme high-temperature drought weather conditions show over time led to peak power “shortage” to all-weather power “double shortage” evolution.
4.2 Analysis of Power and Quantity Balance under Multiple Uncertain Factors
How to quantify and analyze the influence of multiple uncertain factors in the new power system on the power balance of the system is the key to improve the stable operation of the new power system under the high proportion of new energy, especially the supply and demand balance of the power system in extreme scenarios. The formula of supply and demand balance rate of power system is shown in formula (13):
| (13) |
Figure 6 for the power system supply and demand balance rate, in the new energy proportion of increasing power system, the source network load uncertainty of each link will affect the power system operation, and with the process of energy transformation, a variety of attribute energy fusion and complex operation scenario will make the uncertainty and volatility of power system more significant.
Figure 6 Balance rate of supply and demand of power system.
At present, the power system analysis of typical scenarios of uncertainty factors mainly focuses on probability analysis. This process aims to obtain the probability statistical characteristics of the system output variables and quantifies the influence of input uncertainty factors on the operation of the power system. Based on the Monte Carlo sampling calculation method, the sample of the input uncertain variables is obtained through sampling. Then, the probability equation is transformed into a series of deterministic equations so as to obtain the statistical characteristics of the output uncertain variables. The Monte Carlo method is easy to calculate and can be applied to complex practical problems. However, the calculation is inefficient and does not meet the efficient requirements of power analysis, so it can be used as a benchmark to test the accuracy of other methods. Under an extreme conditions system, each link will show more redundant, prominent phenomena, the characteristics of the occasional long scale of historical data and cope with insufficient experience, probability analysis method may appear deviation, and the emergence of extreme conditions often accompanied by short, strong fluctuations, so based on multiple time scale power balance resources probability of margin analysis is crucial. At present, there is no effective power quantity analysis of extreme scenes, so this paper puts forward a balanced analysis idea considering multi-dimensional space and time.
Figure 7 Visualized analysis of electric power distribution.
Figure 7 shows the visual analysis of electric power distribution, in the annual probabilistic power balance analysis, firstly extract the typical and extreme power curves of the annual and monthly new energy generation forecast data and obtain the feature sets of the power supply side flexibility transformation, the energy storage side resource investment and load side demand response aggregation, so as to obtain the temporal new energy utilization rate and load supply rate of the whole system/partition. Further, realize the statistical characterization of the simulation results based on fine particle scale.
Figure 8 Probabilistic power balance analysis.
Figure 8 shows the probabilistic power balance analysis, In the Sunday probabilistic power balance analysis, Based on machine learning intelligent identification, large-scale demand bilateral uncertainty scenarios and uncertain feature cluster reduction; Applying the balanced demand and supply uncertainty results in extreme scenarios coupled with multiple uncertainties, Optimization simulation of Sunday time scale based on typical boundary conditions of system operation, Obtain the timing power balance/imbalance index (new energy utilization rate and load supply rate) under each simulated scenario; Update the data based on the prediction, Carry out the rolling iterative update analysis of the balance ability on the Sunday time scale.
A probabilistic equilibrium analysis of spatial interconnection. Build the analysis model of power balance at different spatial and temporal scales under the uncertain transmission capacity of network constraint/inter-regional interconnection channel, calculate the network constraint/inter-regional interconnection mutual aid condition and carry out the partition calculation of space and time power balance of power system based on the alternating multiplier iteration. Slow power demand growth, new energy capacity, thermal power equipment average utilization hours in recent years, 2019, its thermal power capacity of 9.16.
4.3 Analysis of Simulation Result
Through the analysis of the simulation results, it can be seen that the phenomenon of insufficient power supply and insufficient new energy consumption coexist in the whole year.
Figure 9 Analysis of the power gap distribution of power grid.
Figure 9 for the power gap distribution of power grid analysis, in three scenarios respectively power gap days 47.9%, 70.1% and 73.1%, this is due to the winter peak, hydropower into the dry season and the volatility of new energy power generation, seemingly power installed capacity far exceeds the power supply demand, but the actual adjustable power shortage, lead to a power gap. During the late peak period, the photovoltaic output is basically zero and has no supporting effect.
Figure 10 Consumption of new energy.
Figure 10 shows the consumption of new energy. From perspective of the consumption of new energy, while there is a power gap, the new energy cannot be fully absorbed, and the expected value of the power abandonment rate of new energy is 8.1%, 8.5% and 9.2%, respectively. It can be seen that there is a seesaw relationship between insufficient load supply and new energy power abandonment, which alternate and decreases, and both of them are closely related to thermal power installation. In the case of certain thermal power installed capacity, to ensure the stable and reliable supply of power, it is necessary to ensure a large starting capacity, and the new energy will increase; to ensure the high level of new energy, it is necessary to reduce the thermal power starting mode, there may be a power gap. In the case of a certain load level and new energy installation, with the increasing scale of thermal power installation, the startup mode is constantly increasing, the load supply guarantee capacity is constantly enhanced, the consumption space will continue to narrow, and the consumption situation will continue to deteriorate.

Figure 11 Visualization of power stability.
Figure 11 shows the visualization of power stability. When arranging power supply construction, the impact of new energy output volatility on the orderly power supply should be fully considered. On the basis of the above calculation cases, comprehensively considering the factors of ensuring power supply, reasonable power abandonment level and continuous reduction of new thermal power installations, the analysis is divided into the following three scenarios:
First, to ensure that the power supply is a hard constraint, considering that the power supply is not insufficient and the new energy is not abandoned, the installed capacity of thermal power should reach 104.5 GW. In the actual simulation process, in order to ensure no power abandonment and unlimited load, the thermal power units need to start and stop with peak regulation frequently, and the operation economy of the power grid is poor. The second is to ensure that the power supply is a hard constraint; considering the premise of no insufficient power supply, new energy can maintain a reasonable level of power abandonment (the power abandonment rate is below 5%). Third, cancel the hard constraints of ensuring power supply. In the calculation, load demand-side management can be adopted to ensure the orderly supply of power. At the same time, maintain a reasonable level of new energy (the power abandonment rate is below 5%), which can further reduce the installed scale of thermal power generation. Considering the increasing proportion of national non-fossil energy, 12 GW of controllable load, virtual energy storage, electrochemical energy storage and other flexible adjustment means are added. In the actual operation of the power grid, by increasing the controllable load and electrochemical energy storage, the orderly supply of power load can be guaranteed, the reasonable power level of new energy can be abandoned, and the new thermal power installed capacity can be effectively controlled.
5 Conclusion
The power balance and measurement method of new energy power system based on graph neural network has a broad application prospect in solving key problems in new energy power system. The effectiveness and advantages of these methods are verified by the analysis of real data. However, there are still many problems that need further research and exploration, such as how to better deal with the uncertainty and complexity in the new energy power system, and how to improve the real-time and accuracy of power quantity prediction and measurement. Through the application of the graph neural network, the power balance efficiency of the new energy power system is increased by about 20%. This is because the graph neural network can effectively handle the complex network structure in the power system and optimize the allocation and dispatch of power resources. In terms of power load prediction, the accuracy of the model prediction is 15% higher than the conventional methods. This helps to predict the power demand in advance, arrange the power generation plan reasonably, and ensure the stable operation of the power system. In future research, we will strengthen the interdisciplinary integration of power systems, computer science, data science, and other disciplines, deepen the study of the complexity of new energy power systems, and develop more efficient and intelligent solutions.
References
[1] Hu, X., Hu, H., Verma, S., and Zhang, Z. L. (2020). Physics-guided deep neural networks for power flow analysis. IEEE Transactions on Power Systems, 36(3), 2082–2092.
[2] Huang, J., Guan, L., Su, Y., Yao, H., Guo, M., and Zhong, Z. (2020). Recurrent graph convolutional network-based multi-task transient stability assessment framework in power system. IEEE Access, 8, 93283–93296.
[3] Wang, G., Zhang, Z., Bian, Z., and Xu, Z. (2021). A short-term voltage stability online prediction method based on graph convolutional networks and long short-term memory networks. International Journal of Electrical Power & Energy Systems, 127, 106647.
[4] Zamzam, A. S., and Sidiropoulos, N. D. (2020). Physics-aware neural networks for distribution system state estimation. IEEE Transactions on Power Systems, 35(6), 4347–4356.
[5] Chowdhury, A., Verma, G., Rao, C., Swami, A., and Segarra, S. (2021). Unfolding WMMSE using graph neural networks for efficient power allocation. IEEE Transactions on Wireless Communications, 20(9), 6004–6017.
[6] Shi, Z., Yao, W., Zeng, L., Wen, J., Fang, J., Ai, X., and Wen, J. (2020). Convolutional neural network-based power system transient stability assessment and instability mode prediction. Applied Energy, 263, 114586.
[7] Sendilvelan, S., and Bhaskar, K. (2019). Experimental Analysis of Partially Premixed Charge in a Diesel Engine with Jatropha Oil Methyl Ester and Diesel Blends. Distributed Generation & Alternative Energy Journal, 34(1), 47–60.
[8] Panigrahi, B. K., Bhuyan, A., Shukla, J., Ray, P. K., and Pati, S. (2021). A comprehensive review on intelligent islanding detection techniques for renewable energy integrated power system. International Journal of Energy Research, 45(10), 14085–14116.
[9] Huang, B., and Wang, J. (2022). Applications of physics-informed neural networks in power systems-a review. IEEE Transactions on Power Systems, 38(1), 572–588.
[10] Wu, Y., Dai, H. N., and Tang, H. (2021). Graph neural networks for anomaly detection in industrial internet of things. IEEE Internet of Things Journal, 9(12), 9214–9231.
[11] Pongvuthithum, R., Moran, J., and Sankui, T. (2019). The Design Process for a Closed Combustion Chamber Flow Blurring Nozzle. Distributed Generation & Alternative Energy Journal, 34(1), 9–31.
[12] Ranjan, M., and Shankar, R. (2022). A literature survey on load frequency control considering renewable energy integration in power system: Recent trends and future prospects. Journal of Energy Storage, 45, 103717.
[13] Lin, W., Wu, D., and Boulet, B. (2021). Spatial-temporal residential short-term load forecasting via graph neural networks. IEEE Transactions on Smart Grid, 12(6), 5373–5384.
[14] R., N., Murthy, D. T., and Rajput, M. M. (2019). Modeling Renewables Based Hybrid Power System with Desalination Plant Load Using Neural Networks. Distributed Generation & Alternative Energy Journal, 34(1), 32–46.
[15] Erixno, O., Abd Rahim, N., Ramadhani, F., and Adzman, N. N. (2022). Energy management of renewable energy-based combined heat and power systems: A review. Sustainable Energy Technologies and Assessments, 51, 101944.
[16] Liu, X., Zhou, J., and Qian, H. (2021). Short-term wind power forecasting by stacked recurrent neural networks with parametric sine activation function. Electric Power Systems Research, 192, 107011.
[17] Gao, Y., Miyata, S., and Akashi, Y. (2022). Interpretable deep learning models for hourly solar radiation prediction based on graph neural network and attention. Applied Energy, 321, 119288.
[18] Ibrahim, M. S., Dong, W., and Yang, Q. (2020). Machine learning driven smart electric power systems: Current trends and new perspectives. Applied Energy, 272, 115237.
[19] Lü, X., Wu, Y., Lian, J., Zhang, Y., Chen, C., Wang, P., and Meng, L. (2020). Energy management of hybrid electric vehicles: A review of energy optimization of fuel cell hybrid power system based on genetic algorithm. Energy Conversion and Management, 205, 112474.
[20] Abdalla, A. N., Nazir, M. S., Tao, H., Cao, S., Ji, R., Jiang, M., and Yao, L. (2021). Integration of energy storage system and renewable energy sources based on artificial intelligence: An overview. Journal of Energy Storage, 40, 102811.
[21] Saranyaa, J. S. (2023). A comprehensive survey on the current trends in improvising the renewable energy incorporated global power system market. Ieee Access, 11, 24016–24038.
[22] Presekal, A., Ştefanov, A., Rajkumar, V. S., and Palensky, P. (2023). Attack graph model for cyber-physical power systems using hybrid deep learning. IEEE Transactions on Smart Grid, 14(5), 4007–4020.
[23] Pan, P., Sun, Y., Yuan, C., Yan, X., and Tang, X. (2021). Research progress on ship power systems integrated with new energy sources: A review. Renewable and Sustainable Energy Reviews, 144, 111048.
[24] Ortiz-Villalba, D., Rahmann, C., Alvarez, R., Canizares, C. A., and Strunck, C. (2020). Practical framework for frequency stability studies in power systems with renewable energy sources. IEEE Access, 8, 202286–202297.
[25] Vedik, B., Kumar, R., Deshmukh, R., Verma, S., and Shiva, C. K. (2021). Renewable energy-based load frequency stabilization of interconnected power systems using quasi-oppositional dragonfly algorithm. Journal of Control, Automation and Electrical Systems, 32(1), 227–243.
[26] Izadi, A., Shahafve, M., and Ahmadi, P. (2022). Neural network genetic algorithm optimization of a transient hybrid renewable energy system with solar/wind and hydrogen storage system for zero energy buildings at various climate conditions. Energy Conversion and Management, 260, 115593.
[27] Zheng, J., Du, J., Wang, B., Klemeš, J. J., Liao, Q., and Liang, Y. (2023). A hybrid framework for forecasting power generation of multiple renewable energy sources. Renewable and Sustainable Energy Reviews, 172, 113046.
[28] Karamichailidou, D., Kaloutsa, V., and Alexandridis, A. (2021). Wind turbine power curve modeling using radial basis function neural networks and tabu search. Renewable Energy, 163, 2137–2152.
[29] Liu, H., Yang, R., Wang, T., and Zhang, L. (2021). A hybrid neural network model for short-term wind speed forecasting based on decomposition, multi-learner ensemble, and adaptive multiple error corrections. Renewable Energy, 165, 573–594.
[30] Ti, Z., Deng, X. W., and Zhang, M. (2021). Artificial Neural Networks based wake model for power prediction of wind farm. Renewable energy, 172, 618–631.
Biographies

Kang Liyan was born in Shenyang, Liaoning, China in 1975. She obtained a Master’s degree in Engineering from Northeast Electric Power University. She works at the Marketing Service Center of State Grid Liaoning Electric Power Co., Ltd. Her research interests include electricity metering, construction of electricity consumption information collection systems, information security, and big data analysis.

Cui He was born in Liaoyang, Liaoning, China in 1994. He obtained a master’s degree in Electrical Engineering from Shenyang Agricultural University. He works at the Marketing Service Center of State Grid Liaoning Electric Power Co., Ltd. His research interests include electricity metering, construction of electricity consumption information collection systems, information security, and big data analysis.

Zhao Leiyang was born in Changchun, Jilin, China in 1994. He obtained a Master’s degree in Engineering from Northeast Electric Power University. He works at the Marketing Service Center of State Grid Liaoning Electric Power Co., Ltd. His research interests include electricity metering, construction of electricity consumption information collection systems, information security, and big data analysis.
Distributed Generation & Alternative Energy Journal, Vol. 39_5, 989–1014.
doi: 10.13052/dgaej2156-3306.3953
© 2024 River Publishers