Improving Distributed Network Resilience with Energy Storage: An Optimal Planning Strategy Based on Subjective and Objective Weight Method
Yu Li1, Bingqiang Wang1,*, Yuzhou Chen2, Yaoxia Du2, Juan Du2, Qingxi Liao2, Yihong Wu2, Zhendong Zhou2, Qing Lu3, Liuyong Zhu3 and Yujie Lin3
1Economic and Technical Research Institute of State Grid Tibet Electric Power Co., Ltd, Lhasa, Tibet, 850015, China
2State Grid Tibet Electric Power Co., Ltd, Lhasa, Tibet, 850000, China
3Nanjing NARI New Energy Technology Co., Ltd, Nanjing, 210037, China
E-mail: WangBingqiang1024@163.com
*Corresponding Author
Received 29 August 2024; Accepted 22 October 2024
Abstract
The integration of large-scale distributed photovoltaics (PVs) has improved the conventional resilience of distribution networks to a certain extent, but it has also made the power quality problems of distribution networks more prominent under steady-state operation. At the same time, the increase in the proportion of sensitive loads has also made the impact of voltage sag events increasingly serious, resulting in equipment damage and significant economic losses on the user side due to power quality problems when the conventional resilience assessment results of distribution networks are high. Based on this, this paper proposes an optimal planning strategy for improving the resilience of distributed networks based on subject and objective weight method. Firstly, for the proposed resilience assessment indicators, the improved Analytic Hierarchy Process (AHP) is used to calculate the subjective weights of the indicators, and the entropy weight method is used to calculate the objective weights of the indicators. The optimal weight combining subjectivity and objectivity is obtained comprehensively. Secondly, by combining the proposed resilience and power quality indicators, a comprehensive resilience indicator objective function is established. Based on the second-order cone linearization method, a multi-objective energy storage (ES) optimization configuration model with the lowest daily operation cost and the optimal comprehensive resilience of the distribution network is established. Finally, based on IEEE 33 node simulation, the comparison of calculation examples shows that the proposed energy storage optimization configuration model can effectively reduce system economic costs, while improving the resilience and power quality level of the distribution network.
Keywords: Energy storage, power quality, resilience improvement, subjective and objective weight method, distributed networks.
1 Introduction
With the rapid progress of society and the flourishing development of technology, the load structure of distribution networks has undergone significant changes. Nonlinear, impulsive, and fluctuating loads are continually increasing, and the access capacity of distributed power sources is gradually rising. Consequently, the issue of power quality in distribution networks is becoming increasingly prominent. Among these changes, the increasing integration of distributed photovoltaic (PV) power generation systems into distribution networks has enhanced the network’s ability to support critical loads during extreme events. However, the power quality issues caused by PV integration, such as transient voltage dips, can damage sensitive equipment on the user side and result in significant economic losses. At the same time, Considering the advantages of fast response and bidirectional power adjustment, energy storage (ES) systems can transfer electrical energy across time and space, effectively suppress system fluctuations, and maintain system resilience. Therefore, addressing the impact of power quality issues on users in distribution networks with large-scale distributed PV access and compensating for the insufficient consideration of system operation resilience in conventional ES configuration strategies is crucial for the stable operation of distribution networks.
Existing researchers have carried out research on the evaluation and improvement of distribution network resilience. Reference [1] provides a comprehensive framework for quantifying the resilience of power systems, which introduce metrics that capture the robustness, resourcefulness, rapidity, and adaptability of the distribution networks. These metrics enable a detailed evaluation of how well a network can maintain its functions during and after disruptions. Reference [2] combines probabilistic and deterministic methods to create a comprehensive risk assessment framework, which helps in identifying critical vulnerabilities and prioritizing resilience enhancement measures. A different approach is to apply concepts such as node degree, betweenness centrality, and network efficiency to assess the structural resilience of distribution networks. These metrics help in understanding the impact of component failures and guiding the design of more resilient network topologies [3]. Reference [4] focuses on the resilience of distribution networks to natural disasters, particularly earthquakes and develop a simulation-based assessment tool that models the impact of seismic events on network performance. Reference [5] discusses the use of resilience metrics to guide the development of adaptive protection schemes and restoration strategies. Reference [6] proposes a resilience-based design approach that integrates resilience assessment into the planning process of distribution networks, and involves identifying potential threats, assessing network vulnerabilities, and implementing design modifications that improve resilience. The above research focuses on distribution network evaluation methods from multiple perspectives, covering resilience indicators, evaluation methods and actual case studies. Reference [7] discusses a rapid restoration optimization strategy for short-term global coordination and the synergistic autonomous regulation of distributed energy sources, with enhancing its resilience level. By integrating a variety of assessment frameworks, the application of different methods in identifying network vulnerability and guiding resilience improvement decisions is demonstrated. However, many resilience indicators of distribution network mostly adopt linear summation method, and the influence of indicators weight is not fully considered.
Numerous researchers have proposed various resilience enhancement technologies and ES solutions aimed at improving power quality. The significance of ES systems in stabilizing the grid and facilitating rapid recovery from disruptions has been extensively explored [8]. Reference [9] establishes power quality improvement strategy with a hybrid renewable energy sources based standalone system using neuro-fuzzy controllers. Reference [10] proposes an optimization strategy to enhance the resilience of distribution networks under extreme operating conditions by utilizing multiple microgrids and mobile ES, based on the resilience indicators framework of resilience, recovery, adaptation, and prevention. Reference [11] achieves optimal power quality compensation for ES by formulating and solving an optimal power flow problem, transforming the optimization model into a convex quadratic constrained quadratic program. In addition, reference [12] analyzes power quality disturbance recognition and classification method. And reference [13] introduces a coordinated control strategy that uses the coordination of active and reactive power of distributed generations to regulate the impedance of the point of common coupling (PCC), employing active and reactive power for transient suppression and power factor improvement at PCC. Reference [14] analyzes the impact of distributed ES on the power quality of distribution and transmission networks. Reference [15] explores the potential of using ES to reduce energy and power losses and improve the efficiency of distribution networks. This study determines the optimal charging and discharging power of ES and their positions in the distribution network through metaheuristic optimization methods using particle swarm optimization and genetic algorithms. Reference [16] proposes a method to simultaneously optimize the configuration of ES and the operation of active distribution networks by introducing a resilience evaluation system, which helps to increase the resilience of active distribution networks to withstand multiple faults. References [17] and [18] propose the optimal configuration strategy for distributed ES in distribution networks, achieving the minimization of voltage deviation, voltage flicker, line load, and power loss. Reference [19] first simulates the voltage curves of electrical components integrated with PV and ES networks, and then used an improved multi-objective particle swarm optimization algorithm to minimize the overall node voltage deviation and the energy capacity of ES. Reference [20] proposes an optimal scheduling model for distributed battery ES stations considering peak load transfer to improve voltage distribution in distribution networks These studies collectively highlight the importance of optimal configuration strategies for ES systems to enhance the resilience of distribution networks. However, most of the above literature comprehensively enhance the resilience of distributed systems with ES from conventional resilience indicators, ignoring the impact of power quality.
To address the issues mentioned above, this paper proposes a distribution network resilience evaluation system and an ES optimization configuration method based on the subjective and objective weight method. The resilience assessment is enhanced using a subjective and objective weighting approach to achieve precise weight allocation, establishing an evaluation system that more objectively and accurately reflects the comprehensive resilience level of both the power grid and the user sides. Meanwhile, considering the comprehensive resilience indicators of the distribution network and aiming to minimize the total operating cost, an ES optimization configuration model is developed to enhance the resilience of the distribution network, and the proposed strategy is demonstrated by the simulation results.
2 Subjective and Objective Weighting Method
This paper employs an improved Analytic Hierarchy Process (AHP) to calculate the subjective weights of the indicators and the entropy weight method to determine their objective weights. By combining these approaches, we obtain optimal weights that integrate both subjective and objective factors. This method addresses the inherent subjectivity of AHP and the high sample dependency of the entropy weight method. The specific steps of the subjective and objective weighting method are illustrated in Figure 1.
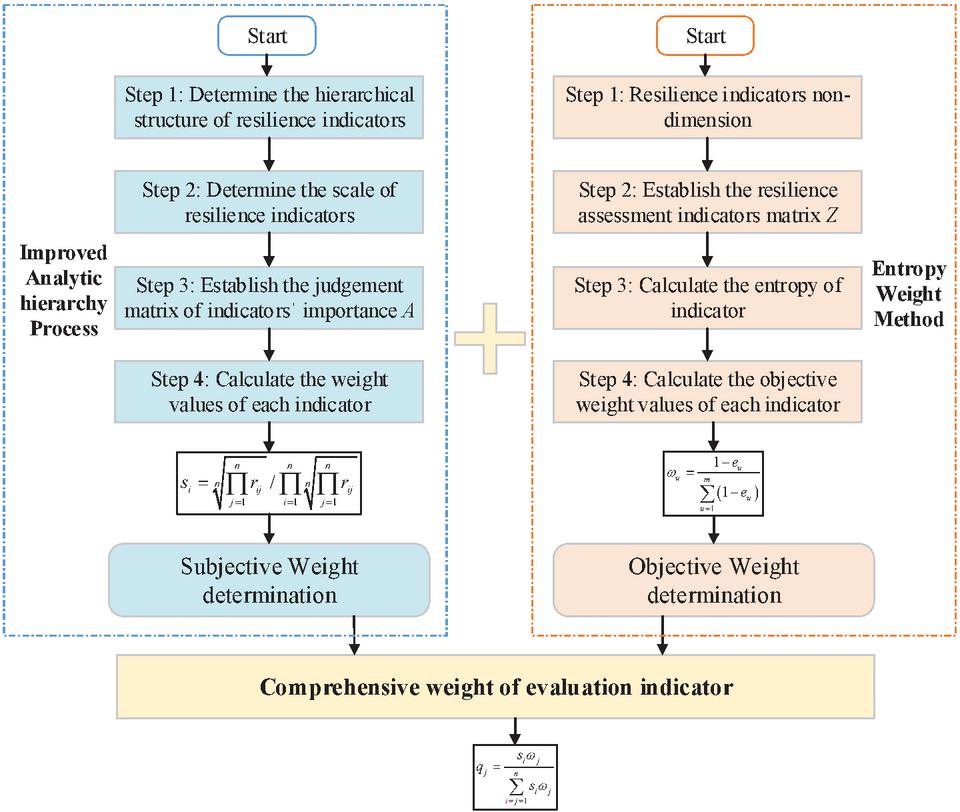
Figure 1 Process diagram of subjective and objective weighting method.
2.1 Subjective Weight Determination Based on Improved Analytic Hierarchy Process
Considering the varying operating environments and service users of different types of distributed power sources, it is crucial to consider the perspectives of users from different regions when conducting comprehensive resilience assessments. Therefore, this article adopts the improved AHP. The specific implementation steps are as follows:
Step 1: Determine the hierarchical structure of the comprehensive resilience indicators based on suggestions from all stakeholders, and rank them according to their importance.
Step 2: Compare the importance of each indicator sequentially and determine the corresponding scale rij from Table 1.
Table 1 Each scale meaning of judgment matrix
| Scale | Meaning |
| 1.0 | Compare two elements with equal importance |
| 1.2 | Comparing two elements, the first element is slightly more important than the second element |
| 1.4 | Comparing two elements, the first element is significantly more important than the second element |
| 1.6 | Comparing two elements, the first element is more important than the second element |
| 1.8 | Comparing two elements, the first element is extremely important compared to the second element |
Step 3: After determining each scale from the above equation, calculate the values of other elements based on the transitivity of the importance of each indicator and establish the following judgment matrix.
| (1) |
where A is the judgement matrix of indicator’s importance; n represents the number of indicators to be evaluated; is the indicator scale.
Step 4: Calculate the weight values of each indicator from matrix A:
| (2) |
where represents the subjective weight value corresponding to the comprehensive toughness indicators.
2.2 Objective Weight Determination Based on Entropy Weight Method
The entropy weighting method is an objective weighting method based on the principle of information entropy, used for the comprehensive evaluation of multiple indicators. The specific steps are as follows:
Step 1: Resilience indicators non-dimension. The proposed resilience indicators in this article are all positive indicators (i.e. Indicators with larger values are more optimal), which can be calculated by:
| (3) |
where is the j-th evaluation indicator in the i-th evaluation scenario after non-dimension; is the original evaluation indicators; and are the minimum and maximum values of original evaluation indicators.
Step 2: Assuming there are n evaluation scenarios and m evaluation indicators, the resulting evaluation indicator values are dimensionless, and the matrix is as follows:
| (4) |
where is the resilience assessment indicators matrix.
If the element of matrix represents the value of the -th indicator in the -th evaluation scenario, then the entropy of the -th indicator is defined as:
| (5) |
where is the entropy of proposed indicator. If , then define as 0.
Step 3: Calculate the objective weight values of each indicator:
| (6) |
where is the objective weight of proposed indicators.
2.3 The Optimal Weight for Comprehensive Subjective and Objective Weighting
Based on the subjective and objective weighting methods mentioned above, the comprehensive weight can be obtained from the following equation:
| (7) |
where is the comprehensive weight of -th evaluation indicator.
Assuming the measurement vector of the comprehensive resilience indicator is I and the weight vector is Q at time t, the comprehensive evaluation Ire result is as follows.
| (8) |
where represents the number of indicators to be evaluated.
3 The Optimal ES Configuration Model for Comprehensive Resilience of Regional Distributed Networks
The ES optimization configuration model for the distribution network is a nonlinear programming model. To facilitate its solution, it needs to be converted into a second-order cone programming (SOCP) model using (9).
| (9) |
where represents the current flowing through branch ; is the voltage magnitude at node j.
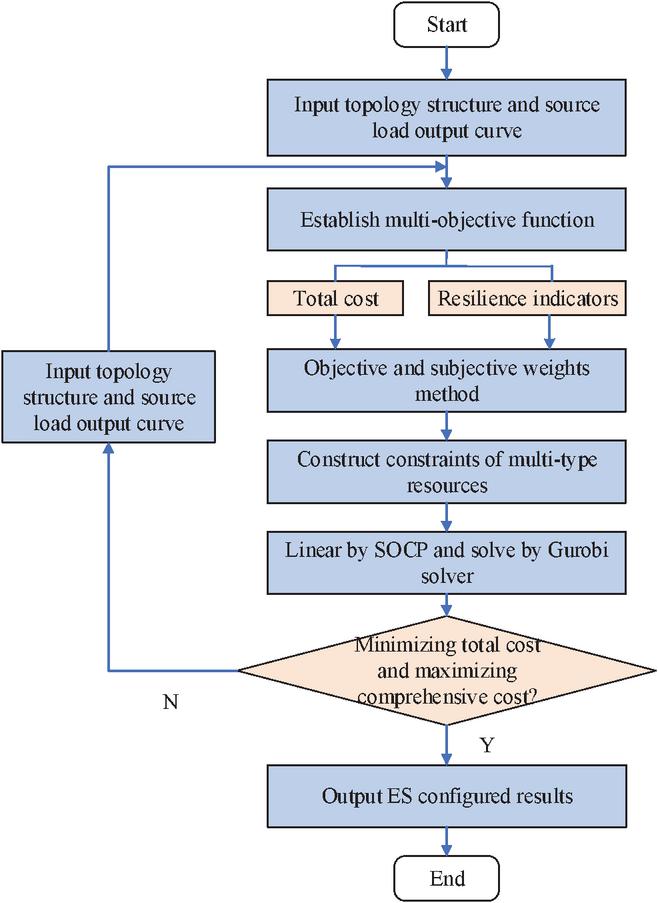
Figure 2 Flow chart of ES configuration to enhance the resilience of distribution network.
The flow chart of the ES configuration to enhance the resilience of the distribution network is shown in Figure 2. Firstly, a resilience enhancement demand model is established based on the topology and resource characteristics of the distribution network. Next, comprehensive resilience indicators are developed, considering the impact of power quality and using the aforementioned subjective and objective weighting method to achieve a reasonable allocation of multi-objective weights. Finally, taking into account the constraints of multidimensional distribution network operation and resilience indicators, an ES optimization planning model is established to enhance comprehensive resilience. The optimal ES configuration scheme is then solved using SOCP linearization and the Gurobi solver. By following these steps, the flow chart ensures a systematic approach to enhancing the resilience of the distribution network through optimized ES configuration.
3.1 Objective Function
3.1.1 Minimizing the total cost
Considering the high investment cost of ES systems, the objective of the optimization configuration process should be to minimize the total operating cost of the entire system. This includes the investment cost of the ES, operational and maintenance costs, distribution network loss costs, and user loss costs caused by voltage sag events.
| (10) |
where is the total operating cost of the distribution network, is the investment cost of the ES devices, is the annual operational and maintenance cost of the ES devices, is the network loss cost, and is the average economic loss cost to users due to voltage sag events.
3.1.2 Maximizing comprehensive resilience
Based on the conventional grid resilience indicator evaluation system, this paper further considers the impact of distributed PV access on power quality indicators and proposes the comprehensive resilience indicators that incorporates both conventional resilience indicators and power quality. The objective function is to achieve the highest comprehensive resilience of the distribution network within one operating cycle:
| (11) | |
| (12) |
where is the comprehensive resilience; is the conventional resilience indicators; is the power quality indicators.
The conventional resilience indicators include comprehensive voltage qualification rate, power supply reliability rate, load loss rate, line utilization rate, comprehensive line loss rate, distributed resources penetration rate, peak-valley ratio of load.
| (13) | |
| (14) |
where is the j-th conventional resilience indicator; is the comprehensive voltage qualification rate; is the power supply reliability; is the load loss rate; is the line utilization rate; is the comprehensive line loss; is the distributed resources penetration rate; is the peak-valley ratio of load.
The comprehensive voltage qualification rate is the ratio of the user’s actual operating voltage qualification time to the total operating time.
| (15) |
where is the total operating time; is the voltage over-limit time.
The power supply reliability refers to the ratio of the user ’s power supply time to the total operating time.
| (16) |
where is the outage time.
The load loss rate is the ratio of interrupted load to total power consumption load after system disturbance.
| (17) |
where is the interrupted load at time ; is the load power at node .
The line utilization rate is the ratio of power supply to the maximum transmission capacity of the line.
| (18) |
where is the output of power generation ; is the time interval; is the maximum transmission power.
The comprehensive line loss rate refers to the ratio of power loss to power supply in the distribution network.
| (19) |
where is the electricity of line loss.
The distributed resources penetration rate refers to the ratio of installed capacity of distributed resources to the maximum load value.
| (20) |
where is the installed capacity of distributed resources; is the maximum load power.
The peak-valley ratio of load is the ratio of the difference between high and low peak loads on a typical day to the peak load.
| (21) |
where is the minimum load power.
The power quality indicators include voltage deviation, harmonic current over-limit margin, harmonic voltage.
| (22) | |
| (23) |
where is the -th power quality indicators; is the voltage deviation; is the harmonic current over-limit margin; is harmonic voltage over-limit margin.
The voltage deviation is calculated by measuring voltage and nominal voltage:
| (24) |
where is the measuring voltage; is the nominal voltage.
The harmonic current over-limit margin is measured and limited by the total harmonic distortion rate of the current.
| (25) |
where is the m-th harmonic current; is the fundamental current.
The harmonic voltage over-limit margin is expressed by the total harmonic distortion rate of the voltage.
| (26) |
where is the m-th harmonic voltage; is the fundamental voltage.
3.2 Constraints
The general model based on the branch power flow model, after being converted into a second-order cone, includes the following constraints:
3.2.1 Power balance constraint
| (27) |
where , , and are the sets of all thermal power generation units, wind turbines, PV systems, and ESs in the distribution network, respectively, and denotes the load demand of distributed networks at time .
3.2.2 ES operation constraints
Due to the presence of nonlinear constraints in the ES operational constraint, the Big-M method is employed to obtain the following processed constraint equations:
| (29) | |
| (30) |
where is a large constant; is an auxiliary variable; is a binary variable indicating whether there is an ESS installed at node ; and are the maximum charging and discharging power of the ESS at node , respectively; is the discharging power of the ESS at node at time ; and are the remaining capacities of the ESS at node at times and , respectively; represents the state of charge of the ESS at node i at different times; and are the minimum and maximum state of charge of the ESS at node , respectively; and is the capacity of the ESS at node .
3.2.3 Node power constraints
| (31) |
where and represent the injected active and reactive power at node , respectively; and represent the active and reactive power flow in branch , respectively; and and are the conductance and susceptance of branch , respectively.
3.2.4 Ohm’s law constraints
| (32) |
3.2.5 Node voltage and branch current constraints
| (33) |
where and are the lower and upper voltage limits at node , respectively, and is the maximum allowable current limit for branch .
3.2.6 Power quality indicators constraints
To ensure the safe operation of the distribution network, the comprehensive resilience indicators should meet the constraint conditions of not exceeding the limit:
| (34) |
where is the limits of comprehensive resilience indicator.
4 Calculation Analysis
This paper employs an adjusted IEEE 33-node distribution system, as illustrated in Figure 3. The system’s reference voltage is 12.66 kV, and the reference capacity is 10 MVA. It comprises 33 nodes, with distributed PV installation points at nodes 5, 11, 13, 15, 18, 22, 23, and 29. The PV installation capacities at these points are 150 kW, 350 kW, 300 kW, 100 kW, 300 kW, 200 kW, 100 kW, and 350 kW, respectively. The basic parameters of the ES device are as follows: the investment cost per kWh is 1300.57 yuan, the annual operation and maintenance cost per kWh is 19.94 yuan, the service life is 20 years, the discount rate is 0.1%, the maximum charging and discharging power is 550 W, and the upper and lower limits of the remaining power are 80% and 20%, respectively, with an initial power level of 50%. The changes in the total system load and PV output power over a 24-hour period are illustrated in Figure 4.

Figure 3 The IEEE 33-node system.
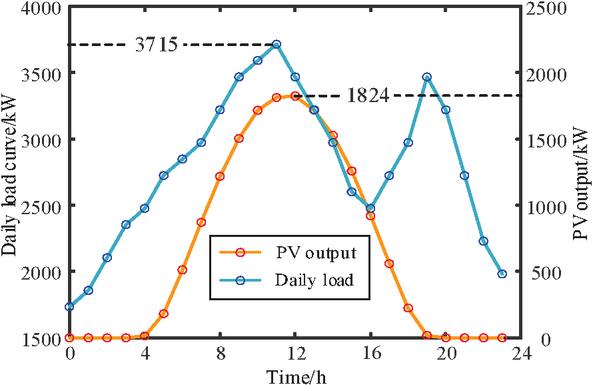
Figure 4 PV output and daily load curve.
4.1 Optimization Configuration of ES with Different Numbers of Access Points
The number of nodes allowed for ES access is set to 1, 2, 3, and 5, with the ES capacity at each node not exceeding 1000 kW. The results of the optimized ES configuration are presented in Table 2. When ES is not configured in the conventional distributed network, the daily operating cost and comprehensive resilience are the lowest among the four scenarios. This is primarily because the absence of ES avoids the additional costs associated with ES configuration, and the comprehensive resilience of the system does not benefit from the high-quality regulation provided by ES. As the number of configuration nodes increases from 1 to 3, both the daily operating cost and comprehensive resilience improve. This is due to the increased ES construction costs and the enhanced system resilience and power quality provided by ES. However, when the number of ES configuration nodes is set to 5, the daily system cost is reduced by 0.2% compared to the configuration with 3 nodes, while the comprehensive resilience of the distribution network improves by 0.12%0.
Table 2 Optimized configuration results
| System | Configured | ES | Daily | Comprehensive |
| Structure | Node | Capacity/kWh | Costs/¥ | Resilience |
| Conventional distributed network | – | – | 1761.3 | 0.738 |
| Scenario 1 | 9 | 550 | 1947.2 | 0.777 |
| Scenario 2 | 17,29 | 300, 630 | 2014.1 | 0.812 |
| Scenario 3 | 16,19,30 | 360, –, 640 | 2033.2 | 0.818 |
| Scenario 4 | 12,15,17,30,32 | –, 130, 210, 400, 240 | 2029.1 | 0.819 |

Figure 5 Voltage conditions of each node in different scenarios.
The voltage conditions at each node under different scenarios are shown in Figure 5. As the number of allowed ES access points increases, the comprehensive resilience indicators of the distribution network also improves. Comparing scenarios 3 and 4, it is evident that when ES access points are more widely distributed, the comprehensive resilience of the distribution network can be enhanced without a corresponding increase in the daily average cost.
Furthermore, to assess the effectiveness of ES and the proposed comprehensive resilience indicators, multiple system structures are established for simulation verification. The resulting power quality indicators are presented in Table 3. When neither PV systems nor ES are connected, the voltage fluctuation and total harmonic distortion rate are at their baseline levels. With the integration of PV systems into the distribution network, both voltage fluctuation and total harmonic distortion increase due to the inherent variability and intermittency of PV output. However, when both PV and ES are connected to the distribution network, the voltage deviation, voltage fluctuation, and total harmonic distortion rate are effectively mitigated. This improvement can be attributed to the fact that the comprehensive resilience indicators account for power quality, enhancing the overall stability of the distribution network.
Table 3 Comprehensive resilience indicators under different conditions
| System | Voltage | Voltage | Total Harmonic |
| Structure | Deviation/% | Fluctuation/% | Distortion rate/% |
| Without PV and ES | 7.8 | 1.140 | 0.939 |
| PV is configured without ES | 4.9 | 4.919 | 1.992 |
| PV and ES are configured (not considering resilience) | 3.6 | 3.527 | 2.773 |
| PV and ES are configured (considering resilience) | 3.4 | 2.950 | 2.642 |
4.2 Optimization Configuration of ES with Different PV Outputs
As the PV penetration rate increases, the voltage deviation in the distribution network gradually increases, as illustrated in Figure 6(a). Additionally, the low-order harmonic current output by the PV generation system contributes to a higher harmonic distortion rate of the node voltage in the system. The greater the PV access capacity and the closer the access point is to the end of the feeder line, the more severe the voltage harmonic distortion, as depicted in Figure 6(b).
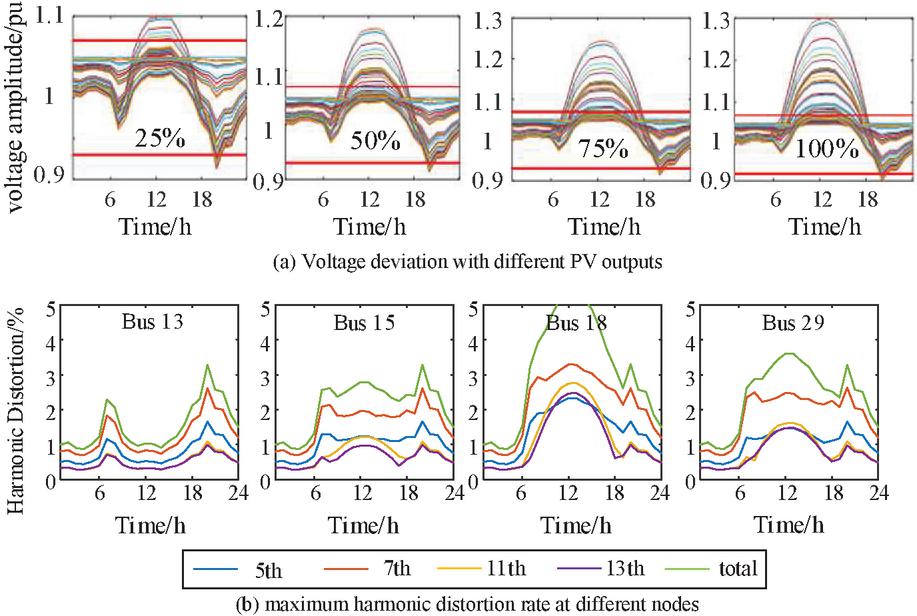
Figure 6 Voltage deviation and maximum harmonic distortion rate in the distributed networks.
The output of distributed PV systems is influenced by both the access ratio and the lighting intensity. Excessive output can lead to significant power quality issues in the distribution network, potentially reducing the network’s resilience. To investigate the impact of different distributed PV outputs on the effectiveness of ES optimization configuration schemes, this section sets the PV access ratio to 25%, 50%, 75%, and 100%. The comprehensive resilience indicators and economic impact of the distribution network are considered in the optimization results, as shown in Figure 7.
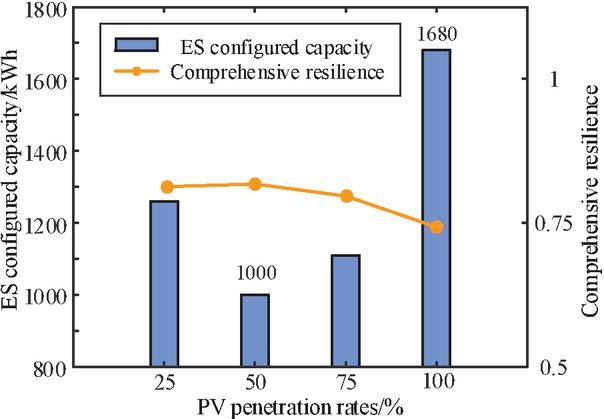
Figure 7 Optimization configuration results of ES under different PV penetration rates.
As shown in Figure 7, with the increase in the penetration rate of distributed PV, the optimization results for the resilience indicators of the regional distribution network initially increase and then decrease. Concurrently, the ES configuration capacity initially decreases and then increases. When the penetration rate of distributed PV reaches 50%, the distribution network achieves its maximum comprehensive resilience indicator of 0.818, with a minimum required ES configuration capacity of 1000 kW. This indicates that both the comprehensive resilience and economic performance of the distribution network are optimal under this condition. Therefore, from the perspective of optimizing ES configuration and efficiency, there is an optimal penetration rate for integrating distributed PV. When the PV penetration rate is below 50%, integrating distributed PV can somewhat alleviate the low voltage issues at the end nodes of the regional distribution network and reduce the load on overloaded lines. Consequently, increasing the PV penetration rate effectively improves both the comprehensive resilience indicators and the economic performance of the distribution network. However, when the penetration rate exceeds 50%, distributed PV systems can cause overvoltage problems at the access points, which adversely affects power quality indicators. The PV output peaks around 12:00, coinciding with the system’s peak load times at both 12:00 and 20:00. If the distribution network lacks sufficient capacity to consume this high PV output, it will further degrade the comprehensive resilience indicators. Therefore, increasing PV penetration rate will reduce the comprehensive resilience indicators of the distribution network while increasing economic demand.
4.3 Optimal Configuration of ES Under Fixed Costs
To analyze the ES configuration capacity across different seasons and varying PV penetration levels, while keeping the total system investment cost constant, the system is optimized under this constraint. The result is the optimal ES configuration capacity and the overall resilience indicator for the distribution network. As depicted in Figure 8, the system’s comprehensive resilience indicator reaches its maximum value under the fixed cost condition.
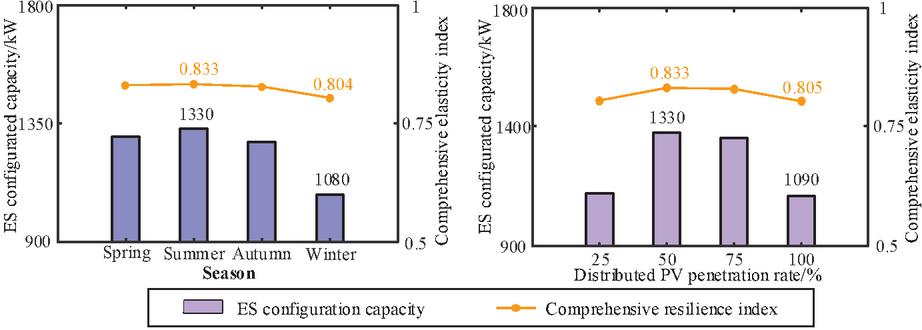
Figure 8 Optimization configuration results of ES under different PV penetration rates.
Given a fixed total daily investment cost of 2200 yuan, an analysis based on solar irradiance reveals the following:
• Summer: Due to higher solar irradiance, the contribution of distributed PV output is significant. This reduces both the distribution network line loss rate and line loss cost, allowing for a greater ES capacity of up to 1330 kW. Consequently, the comprehensive resilience indicators of the distribution network increase to 0.833.
• Winter: With weaker solar irradiance, the PV output is approximately half of that in summer, which substantially diminishes its effect on reducing line loss costs. As a result, the ES capacity that can be configured decreases to 1080 kW, and the comprehensive resilience indicators drops to 0.804.
• Spring and Autumn: The PV output in these seasons is slightly lower than in summer, leading to similar ES capacities of around 1290 kW for both seasons.
In summary, configuring ES capacity for a regional distribution network with integrated distributed PV must account for the fluctuations in PV output due to local climatic conditions. If the proportion of time with high solar irradiance is substantial, the storage capacity can be reduced to enhance economic efficiency. Conversely, if the proportion of time with low solar irradiance is large, the storage capacity should be increased to maintain a high level of the system’s comprehensive resilience indicators. From the perspective of distributed PV penetration, the resilience indicators of the regional distribution network show an initial increase with higher PV penetration rates, followed by a subsequent decrease. A similar trend is observed in the storage configuration capacity. When the PV penetration rate reaches 50%, the distribution network achieves the highest comprehensive resilience indicators of 0.833, with the maximum ES capacity at 1330 kW. This indicates that, while maintaining economic efficiency, more ES capacity can be configured to enhance the system’s comprehensive resilience indicators.
Therefore, there is an optimal PV penetration rate for maximizing ES configuration efficiency. For example, when the PV penetration rate is below 50%, integrating distributed PV can alleviate low voltage issues at the end nodes of the regional distribution network and reduce the load on heavily loaded lines. This increased PV penetration effectively improves both the comprehensive resilience indicators and the economic efficiency of the distribution network. However, when the penetration rate exceeds 50%, distributed PV can lead to overvoltage issues at connection points, which impacts power quality indicators. Additionally, PV output peaks around 12:00, while system load peaks occur around 12:00 and 20:00. The distribution network’s insufficient capacity to absorb the PV output exacerbates the comprehensive resilience indicators. Thus, increasing PV penetration beyond a certain threshold will degrade the comprehensive resilience indicators of the distribution network and increase economic demands.
5 Conclusion
To address the significant disparity between the actual perceived resilience of sensitive users in distribution networks and the evaluation outcomes produced by existing resilience assessment frameworks, we propose a comprehensive resilience evaluation system for distribution networks, along with an ES optimization configuration model. The objective is to minimize the comprehensive resilience indicators and total operating costs. The main findings are as follows:
(1) Comprehensive Resilience Evaluation: A comprehensive resilience evaluation index system was developed, employing both subjective and objective weight allocation methods to assess the resilience of regional distribution networks. This is achieved through the integration of multiple resilience indicators and their corresponding weights, providing a more nuanced and accurate evaluation of network resilience.
(2) ES Optimization Configuration: An optimized ES configuration strategy is proposed to enhance the overall resilience of the distribution network. The strategy includes provisions to prevent power quality indicators from exceeding permissible limits, particularly after the integration of distributed PV systems. By improving the network’s ability to withstand disturbances, this approach significantly strengthens its anti-interference capabilities.
(3) Impact of Distributed PV Systems: The effects of distributed PV systems on regional distribution networks are analyzed based on varying light intensities and penetration rates. From an ES optimization perspective, the optimal PV penetration rate is identified. Under these conditions, a reduced ES capacity can lead to significant improvements in the network’s comprehensive resilience.
Acknowledgment
This work was supported in part by the National Key Research and Development Program of China (No. 2021YFB1507205).
References
[1] Panteli, M., Mancarella, P., Trakas, D. N., Kyriakides, E., and Hatziargyriou, N. D, “Metrics and quantification of operational and infrastructure resilience in power systems [J]” IEEE Transactions on Power Systems, vol. 32, pp. 4732–4742, November 2017.
[2] Li, Y., and Zhang, N., “A comprehensive risk assessment framework for power distribution networks [J]” International Journal of Electrical Power & Energy Systems, vol. 100, pp. 40–48, 2018.
[3] Ouyang, M., amd Dueñas-Osorio, L., “Multi-dimensional hurricane resilience assessment of electric power systems [J]” Structural Safety, vol. 48, pp. 15–24, May 2014.
[4] Alex, A.J., and Rodrigo, M., “Seismic-resilient electric power distribution systems: harnessing the mobility of power sources [J]” IEEE Transactions on Industry Applications, vol. 56, pp. 2304–2313, February 2020.
[5] García, M. P., Díez, R. A., and de la Torre, S., “Smart grid technologies for the resilience of the power grid [J]” Renewable and Sustainable Energy Reviews, vol. 101, pp. 181–191, April 2019.
[6] Cai, H., Lam, N. S. N., Zou, L., and Qiang, Y., “Assessing community resilience to coastal hazards in the Lower Mississippi River Basin [J]”. Water, vol. 8, pp. 46, Febuary 2016.
[7] Li, H., Hao, T., Li, Z., Zhao, E., Wang, C., and Xu, L. “Research on a self-coordinated optimization method for distributed energy resources targeting risk mitigation [J]”. Distributed Generation and Alternative Energy Journal, Vol. 39, no. 3, pp. 659–690, July 2024.
[8] S. Qi, X. Wang, X. Li, T. Qian, and Q. Zhang, “Enhancing integrated energy distribution system resilience through a hierarchical management strategy in district multi-energy systems [J]” Sustainability, vol. 11, pp. 4048, July 2019.
[9] Deepak, K., Mandal, R. K., and Verma, V. “Power quality improvement of a hybrid renewable energy sources based standalone system using neuro-fuzzy controllers [J]”. Distributed Generation and Alternative Energy Journal, vol. 38, no. 6, pp. 1815–1838, August 2023.
[10] Dillip Kumar Mishra, Mojtaba Jabbari Ghadi, Li Li, Jiangfeng Zhang, M.J. Hossain, “Active distribution system resilience quantification and enhancement through multi-microgrid and mobile energy storage [J]” Applied Energy, vol. 311, April 2022.
[11] X. Xiao, Z. Li, Y. Wang, Y. Zhou and K. Liu, “Optimal Power Quality Compensation of Energy Storage System in Distribution Networks Based on Unified Multi-Phase OPF Model [J]” IEEE Transactions on Smart Grid, vol. 13, no. 3, pp. 1873–1887, May 2022.
[12] Long, F., Liu, F., Peng, X., Yu, Z. Y., Huan, X. H., Xu, H. X., and Li, J. L. “Power quality disturbance identification and optimization based on machine learning [J]” Distributed Generation and Alternative Energy Journal, vol. 37, no. 2, pp. 159–174, October 2021.
[13] Shah Fahad, Arman Goudarzi, Yanjun Li, Ji Xiang, “A coordination control strategy for power quality enhancement of an active distribution network [J]” Energy Reports, vol. 8, pp. 5455–5471, November 2022.
[14] Adewumi, Olurotimi Babatunde, Georgios Fotis, Vasiliki Vita, Daniel Nankoo, and Lambros Ekonomou. “The Impact of Distributed Energy Storage on Distribution and Transmission Networks’ Power Quality [J],” Applied Sciences, vol. 12, no. 13, pp. 6466, May 2022.
[15] N. Krstić, “Reduction of Energy and Power Losses in Distribution Network Using Energy Storage Systems [C]” 2020 55th International Scientific Conference on Information, Communication and Energy Systems and Technologies (ICEST), Niš, Serbia, pp. 127–130, September 2020.
[16] Lei Chen, Yuqi Jiang, Shencong Zheng, Xinyi Deng, Hongkun Chen, Md. Rabiul Islam, “A two-layer optimal configuration approach of energy storage systems for resilience enhancement of active distribution networks [J]” Applied Energy, vol. 350, 121720, November 2023.
[17] Choton K. Das, Octavian Bass, Thair S. Mahmoud, Ganesh Kothapalli, Navid Mousavi, Daryoush Habibi, Mohammad A.S. Masoum, “Optimal allocation of distributed energy storage systems to improve performance and power quality of distribution networks [J]” Applied Energy, vol. 252, 113468, October 2019.
[18] Das, C.K., Bass, O., Mahmoud, T.S., Kothapalli, G., Masoum, M.A.S., Mousavi, N., “An optimal allocation and sizing strategy of distributed energy storage systems to improve performance of distribution networks [J]” Journal of Energy Storage, vol. 26, 100847, December 2019.
[19] Li, Q., Zhou, F., Guo, F., Fan, F., Huang, Z., “Optimized Energy Storage System Configuration for Voltage Regulation of Distribution Network With PV Access [J]” Frontiers in Energy Research vol. 9, April 2021.
[20] X. Li, R. Ma, W. Gan and S. Yan, “Optimal Dispatch for Battery Energy Storage Station in Distribution Network Considering Voltage Distribution Improvement and Peak Load Shifting [J]” Journal of Modern Power Systems and Clean Energy, vol. 10, no. 1, pp. 131–139, January 2022.
Biographies

Yu Li received the B.S. degree from Tibet University, Lhasa, China, in July 2011. She has worked at the Electric Power Dispatch and Communication Bureau of Tibet Autonomous Region since August 2002, and has been with the State Grid Tibet Electric Power Co., Ltd. headquarters since 2009. His research interests include power system studies.

Bingqiang Wang received the M.S. degree from Qingdao University, Qingdao, China, in June 2010. His main research areas include power system planning and design, as well as research on new power systems.

Yuzhou Chen received the B.S. degree in engineering from Harbin Institute of Technology, Harbin, China, in 2014. He has worked at the Economic and Technical Research Institute of State Grid Tibet Electric Power Co., Ltd. since 2014. His research interests focus on power grid planning, substation design, and power grid project evaluation.

Yaoxia Du received the B.S. degree from Panzhihua University, Panzhihua, China, in 2017. He has worked at the Economic and Technical Research Institute of State Grid Tibet Electric Power Co., Ltd. since 2017, with a research focus on power systems.

Juan Du received the B.S. degree from Tibet Nationalities University, Xianyang, China, in 2014. Since 2014, she has worked at the Tibet Economic Research Institute, focusing on science and technology project and contract management.

Qingxi Liao received the B.S. degree in engineering from Lanzhou University of Technology, Lanzhou, China, in 2023. He has worked at the Economic and Technical Research Institute of State Grid Tibet Electric Power Co., Ltd. since 2023, with research interests in distribution networks.

Yihong Wu received the B.S. degree from Chongqing Three Gorges University, Chongqing, China, in 2016. Since 2016, he has worked at the Economic and Technical Research Institute of State Grid Tibet Electric Power Co., Ltd., focusing on transmission line design.

Zhendong Zhou received the B.S. degree from Tibet University, Lhasa, China, in 2018. He has worked at the Economic and Technical Research Institute of State Grid Tibet Electric Power Co., Ltd. since 2014. His research interests include project management, technical economics, and cost management.

Qing Lu received the B.S. degree from Jiangsu University of Science and Technology Nanzhou College, Zhenjiang, China, in 2012, and is expected to receive the M.S. degree from Jiangsu University of Science and Technology in 2026. He has worked at Nanjing Nari New Energy Technology Co., Ltd. since 2016, with research interests in photovoltaic inverters and energy storage converters.

Liuyong Zhu received the B.S. degree from Nanjing Institute of Technology, Nanjing, China, in 2017. Since 2017, he has worked at Nanjing Nari New Energy Technology Co., Ltd., focusing on research and development of photovoltaic inverters and energy storage converters.

Yujie Lin received the B.S. degree from Huaiyin Institute of Technology, Huai’an, China, in 2020, and the M.S. degree from Shanghai University of Electric Power, Shanghai, China, in 2023. Since 2023, he has worked at Nanjing Nari New Energy Technology Co., Ltd., with research interests in photovoltaic inverters and energy storage converters.
Distributed Generation & Alternative Energy Journal, Vol. 39_5, 1015–1044.
doi: 10.13052/dgaej2156-3306.3954
© 2024 River Publishers