Assessment of the Distributed Generation Carrying Capacity in New-Type Distribution Networks Based on Different Load Levels
Zongluo Zhao1, Yabo Li1, Qicheng Sun2, Ruifeng Li2, Zhenxu Ma2, Dongbo Guo2,*
1State Grid Zhejiang Hangzhou Electric Power Co., Ltd., Hangzhou Zhejiang, 311499, China
2School of Electrical Engineering, Northeast Electric Power University, Jilin, Jilin, 132012, China
E-mail: 1847094008@qq.com
*Corresponding Author
Received 09 September 2024; Accepted 29 October 2024
Abstract
Currently, the large-scale grid connection of distributed generation, represented by wind electricity and photovoltaics, into distribution networks has become a trend. However, this massive integration can lead to a series of problems including grid frequency and voltage fluctuations, power system instability, equipment failures, power outages or interruptions, and a decline in power quality. This paper presents a way for assessing the carrying capacity of distributed generation under different load levels. Considering various factors influencing the carrying capacity, a comprehensive evaluation method is proposed by utilizing a multi-time scale factor matrix, an improved entropy weight method, and the Analytic Hierarchy Process (AHP) combined with a comprehensive weight way. Based on the thermal stability limit, the maximum DG injection is calculated using the reverse load ratio, and the carrying capacity of the distributed generation system is determined by gradually decreasing it at each voltage level to meet the specified criteria, considering the actual operating conditions and safety boundaries. Finally, through a case study analysis of a distribution network model in Zhejiang province, the carrying capacity of distributed generation in that region is obtained.
Keywords: Distribution network, distributed generation, combination of subjective and objective weighting, capacity assessment.
1 Introduction
With the advancement of economy, the need for electricity in human society is on the rise. Given the non-renewable nature of fossil fuels and the environmental pressures they cause, new energy production technologies are receiving increasing attention around the world. After distributed power supply connects to the distribution network, it is utilized more efficiently. Therefore, it can reduce the loss in the process of power transmission and improve economic benefits. Distributed power supply connected to the distribution network will increase the number of power supplies in the grid, enhance the dependability of electric supply, but also complicate the structure of the grid, affect the voltage distribution, power flow direction and relay protection in the grid in [1]. As the penetration rate of wind power continues to increase, the fluctuation of wind power output, caused by the stochastic and uncertain nature of wind speed, can impact the security of the power grid [2, 3]. Wind power output is primarily determined by wind speed [4]. Bayesian comprehensive optimization method is used to evaluate the connectable capacity of distributed wind power generation in power grid in [5] and accurate wind speed forecasting can guide the design of efficient wind power control strategies, thereby mitigating adverse effects on the power grid [6]. However, due to the wide geographical distribution of wind turbines within a wind farm, the wind speed at each turbine varies in [7]. If the local wind speed of each turbine within a wind farm can be accurately predicted, it can provide more comprehensive information for wind farm control, thereby enhancing the flexibility and optimality of wind farm control in [8]. The impacts of distributed photovoltaics are closely related to the connection location and grid capacity. Photovoltaic integration not only affects the current distribution in the distribution network but also influences line losses [9]. Scholars have conducted research on the impact of photovoltaic grid integration on static voltage stability and proposed a quantitative index for bidirectional static voltage stability margin [10]. Under different load patterns, photovoltaic grid integration can cause active power losses in the distribution network [11]. Direct current injection is also one of the important issues to be addressed in photovoltaic grid integration [12]. The intense random fluctuations in photovoltaic output can lead to voltage fluctuations, flicker, and other issues. Some scholars have used subjective evaluation methods to assess power quality but have overlooked the influence of objective facts and the fluctuation characteristics of the indicators, and their weighting coefficients do not change [13]. A proposed evaluation index system based on commutation for unbalanced treatment assesses the impact of three-phase unbalance treatment through a combination of analytic hierarchy process and an enhanced entropy weight way [14].
In [15], the analysis and solution of photovoltaic integration capacity with energy storage system in distribution networks were conducted using the stochastic scenario method. Reference [16] proposed an evaluation method based on multiple operational scenario simulations to assess the grid connection capacity of wind power. Reference [17] established a new energy integration capacity evaluation system for distribution networks, considering both regional and local indicators. Reference [18] developed a system evaluation index framework for distributed power generation integration, taking into account network losses, reliability, quality, environmental impact, and network upgrade deferral, with the evaluation results obtained through weighted summation of the indicators’ weights. In [19], an evaluation method for renewable energy hosting capacity was proposed under frequency stability constraints, although the accuracy needs improvement due to simplified equivalent of synchronous units. Reference [20] presented a linear programming model for assessing renewable energy hosting capacity, but the impact of harmonics on the grid was not considered.
Literature [24] proposed a simple random scenario simulation method to evaluate the impact of DG access at different locations with different capacities on the distribution network. Literature [25] uses random scenario method to analyze and solve the photovoltaic absorption capacity of distribution network with energy storage system. Literature [26] proposes a method based on multi-operation scenario simulation to evaluate the grid-connected capacity of wind power. Literature [27] established the new energy acceptance capacity evaluation system of distribution network from two aspects of regional and local indicators.
In engineering practice, the assessment of the grid-connected capacity of distributed power generation often requires iterative calculations based on production simulation results, resulting in a complex process and relatively rough assessment outcomes. However, high-capacity distribution substations play a significant role as the main scenario and form for demand-side participation in comprehensive demand response in the future, making them highly significant. Therefore, it is necessary to approach this issue from the perspective of multi-energy complementarity, considering the actual production conditions of high-capacity enterprises in China. This approach aims to explore the mechanisms of demand response that include various types of adjustable loads (such as time-shiftable loads and controllable loads) as well as distributed photovoltaic power generation. The evaluation research on the hosting capacity of distributed photovoltaic (PV) integration into the grid has been initiated since 2001, yielding significant research achievements. Currently, the evaluation methods for the hosting capacity of distributed PV integration can be primarily categorized into two types. The first type is dynamic simulation, which involves the utilization of power system simulation software such as PSCAD, MATLAB, and OPENDSS to construct grid models and perform real-time simulation calculations for verifying the secure and stable operation of the grid. This method offers the advantage of real-time validation and relatively straightforward principles. However, it necessitates repetitive calculations, trial and error, and substantial simulation efforts. The second type is mathematical optimization, which aims to maximize the installation capacity of distributed PV integration while considering multiple types of constraints related to secure and stable operation. Different optimization algorithms are employed to obtain optimal solutions based on clear mathematical computation approaches. This method offers the advantages of well-defined computational strategies and more reliable results. Nevertheless, the current solving methods generally encounter challenges such as complex constraint conditions, extensive computational requirements, and lengthy solving times.
Given the limitations mentioned above, we propose a method based on thermal stability, utilizing multiple criteria weighting methods such as AHP, improved entropy method, and comprehensive weighting method. By applying weighting methods to obtain constrained weights, we calculate the numerical value of distributed power integration capacity. Additionally, taking into account varying capacities at different voltage levels, we establish corresponding capacity specifications.
The paper is structured as follows. Section 2 presents the Analysis of Distributed Power Generation Integration Impact on Power Quality. Section 3 critical indicators are chosen through the application of various weighting methods. Section 4 explains that according to the key indicators obtained in the previous section, the grid-connected capacity of distributed generation is analyzed and calculated in detail. Section 5 explains an in-depth analysis is conducted utilizing electrical grid data from a specific location in Zhejiang Province. The paper concludes by presenting several key findings and summarizing the main points discussed throughout the study in Section 6.
2 Analysis of Factors Affecting the Capacity of Distributed Generation
The “New Distribution Grid” refers to a modernized distribution network developed based on advanced technologies and intelligent systems to address the emerging electricity demands of new energy sources, distributed energy, and electric vehicles.
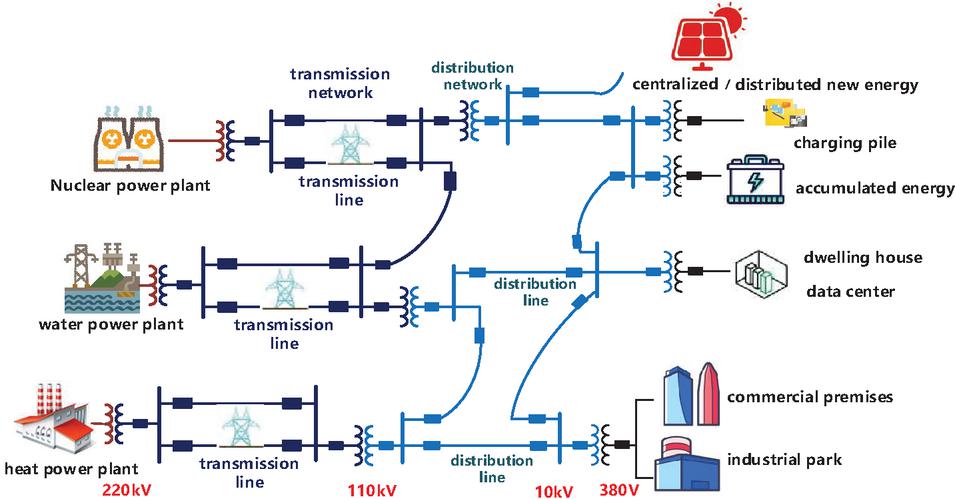
Figure 1 Advanced distribution network.
2.1 Thermal Stability of Equipment and Circuits
Thermal stability of equipment and circuits refers to the ability of the circuits to withstand the flow of current without generating excessive heat during equipment operation, thereby ensuring normal operation and safety. Overheating of equipment and circuits can lead to shortened lifespan, performance degradation, or even damage, thereby affecting the reliability and stability of the power grid. Circuit exceeding the limits of thermal stability can result in increased energy losses and decreased energy conversion efficiency. This means that the power system requires more energy to meet the load demand, thereby increasing energy consumption and costs. Moreover, circuits exceeding the limits of thermal stability can also pose safety risks such as electric shock, posing a threat to human life. Currently, certain regions in China have a high penetration rate of distributed photovoltaic in the distribution network. Under low load levels and strong solar radiation, the output of distributed photovoltaic exceeds the electrical load, resulting in reverse power flow at the upstream transformer and lines, exceeding the limits of thermal stability. Therefore, the thermal stability margin of equipment and circuits in the distribution network is a key factor affecting the capacity of distributed generation.
2.2 Voltage Deviation
Voltage deviation reflects the relative difference between the actual operating voltage and the nominal system voltage, expressed as a percentage. In the absence of distributed photovoltaic grid integration, the flow of feeder voltage is monotonous, meaning the voltage gradually decreases from the starting point. However, when distributed photovoltaic grid integration is implemented, it increases the node voltage. The larger the capacity of photovoltaic grid integration, the greater the impact on node voltage. When the capacity of photovoltaic grid integration is excessive, the voltage difference between adjacent nodes becomes positive, thereby altering the original monotonicity of voltage distribution in the distribution network. Node voltage deviation is not only related to its grid integration capacity but also to its connection point location and impedance value. The closer it is to the end of the distribution network, the greater the voltage deviation. Generally, if the distribution network’s voltage regulation capacity is insufficient, the node voltage will be excessively high, and in the most severe cases, it can lead to power outages. Therefore, the permissible voltage deviation range in the distribution network is also a limiting factor for the impact of distributed power capacity.
2.3 Short-circuit Current
The short-circuit current is a critical parameter that affects the operation of the power grid and the safety of equipment. The larger the capacity of distributed power sources, the greater the short-circuit current. As the distributed capacity increases, the distribution network evolves from a single-source radial network structure to a multi-source grid structure, thereby changing the magnitude, direction, and duration of the short-circuit current in the power grid. The connection of distributed power sources increases the sources of short-circuit current in the power grid, thereby increasing the overall amount of short-circuit current. Therefore, the short-circuit current is also a limiting factor for the carrying capacity of distributed power sources.
2.4 Power Quality
Voltage quality standards primarily include voltage deviation, voltage fluctuation, three-phase imbalance, and power supply continuity. The output of solar and wind power generation systems is closely related to weather conditions, so voltage fluctuations may occur in cases of severe weather changes. The larger the short-circuit capacity of the distribution network, the smaller the impact of photovoltaics on voltage fluctuations. When connecting distributed photovoltaics to a low-voltage distribution network, the limited short-circuit capacity of the grid can cause significant impacts on voltage fluctuations caused by photovoltaic grid integration. Distributed photovoltaic grid integration can also cause harmonic pollution. On the one hand, the photovoltaic power source itself acts as a harmonic source, and its harmonic characteristics are influenced by factors such as grid integration location, connection method, distribution network structure, and system short-circuit capacity. On the other hand, background harmonics in the distribution network can exacerbate harmonic distortion. The distribution network contains a significant amount of unbalanced loads, and the line parameters can exhibit three-phase imbalance. When the distribution network operates under three-phase imbalance conditions, negative sequence components can be present in the voltage, leading to increased equipment losses. Considering that many residents choose single-phase connections and there is distributed photovoltaic single-phase grid integration, this exacerbates the issue of three-phase imbalance in low-voltage distribution networks. Therefore, power quality in distribution networks is also a limiting factor for the carrying capacity of distributed power sources.
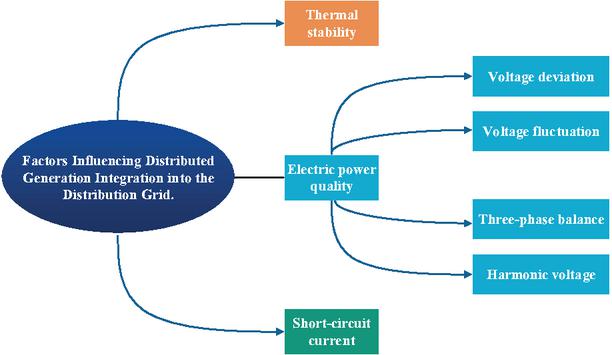
Figure 2 Evaluation factors.
Taking into consideration the factors mentioned above, this study selects voltage deviation, voltage fluctuation, harmonic voltage, short-circuit current, and three-phase imbalance as evaluation metrics. Voltage deviation reflects the variance between actual and nominal voltages, serving as a critical indicator of system health; voltage fluctuation reveals system stability under varying loads; harmonic voltage assesses the impact of non-desired frequencies on the system; short-circuit current is crucial for system fault handling capability; three-phase imbalance reflects uneven load distribution. By integrating these metrics, the aim is to deeply analyze the operational characteristics of power systems, provide a more comprehensive basis for decision-making, and enhance system reliability and performance.
3 Selection of Key Performance Indicators
This article selects the subjective weighting Analytic Hierarchy Process (AHP), the objective weighting improved entropy method, and a comprehensive weighting method that combines both, to select the key indicators of distributed power generation.
3.1 The Subjective Weighting Method Based on the Analytic Hierarchy Process (AHP)
AHP is a multi-objective evaluation method that combines qualitative and quantitative aspects, proposed by American scholar Saaty. It determines the relative importance of each indicator through hierarchical comparisons, and derives the weights of the indicators in the evaluation scheme.
(1) Analyse the relationships between various indicators and establish a hierarchical structure.
(2) Evaluate the importance of indicators based on expert judgment using a proportional scale table, resulting in the formation of matrix A.
Table 1 Proportional scale chart
| Factor i is Compared to Factor j | Quantitative Value |
| The two indicators hold equal importance | 1 |
| One indicator is marginally more significant than another indicator | 3 |
| One indicator is relatively more significant than another indicator | 5 |
| One indicator is highly prioritized over the other indicator | 7 |
| One indicator is of utmost importance compared to the other indicator | 9 |
| the midpoint between two closely related indicators | 2,4,6,8 |
| If indicator i is relatively more important than indicator j with a degree of importance a, then indicator j is relatively more important than indicator i with a degree of importance aji. | inverse |
(3) Construct judgment matrices to calculate the corresponding weights.
(a) Normalize the judgment matrix to obtain matrix , where the elements are calculated as follows:
| (1) |
(b) Sum the rows of the normalized matrix to obtain vector , where the elements of matrix are calculated as follows:
| (2) |
(c) Normalize the matrix to obtain the indicator weight coefficients , which are the eigenvectors of the maximum eigenvalue:
| (3) |
(d) Calculate the maximum eigenvalue of the judgment matrix:
| (4) |
(4) Perform consistency check on the judgment matrix.
| (5) |
Table 2 Random consistency index
| 1 | 2 | 3 | 4 | 5 | 6 | 7 | 8 | 9 | |
| 0 | 0 | 0.58 | 0.9 | 1.12 | 1.24 | 1.32 | 1.41 | 1.45 |
The consistency ratio (CR) is defined as CR CI/RI, where CI represents the consistency index and RI represents the random index. When CR 0.1, it indicates that the consistency test is satisfactory. A smaller value indicates better consistency.
3.2 The Objective Weighting Method Utilizing the Enhanced Entropy Weight Approach
The entropy weighting method is a commonly used objective weighting method. Unlike the subjective weighting of the Analytic Hierarchy Process that requires the evaluator to construct a judgment matrix for weight calculation, The entropy weighting method computes weights exclusively from the information entropy of the indicator data. A higher information entropy value results in a lower weight for an indicator; conversely, the smaller the information entropy value, the larger its weight. Regarding the power quality issues caused by distributed power generation, it is believed that indicators with higher volatility should have higher weights.
The power quality standards are divided into five levels: unqualified, qualified, moderate, good, and excellent. The indicator evaluation levels are shown in Table 1.
Table 3 Distributed generation grid-connected power quality indicator levels
| Voltage | Short-circuit | Harmonic | Voltage | Three-phase | |
| Grade | Deviation | Current | Voltage | Fluctuation | Imbalance |
| 1 | i7% | i60% | i5% | i2% | i2% |
| 2 | i5% | i40% | i3.5% | i1.5% | i1.5% |
| 3 | i3% | i30% | i2.5% | i1% | i1% |
| 4 | i1.5% | i10% | i1.5% | i0.5% | i0.5% |
| 5 | i1.5% | i10% | i1.5% | i0.5% | i0.5% |
To analyze the operational data of distributed power generation with point-of-common-coupling monitoring, assuming the total measurement time is T, and y1y5 represent the five power quality indicators from Table 1, the matrix representing the measurement data of power quality indicators at the grid point can be represented as:
In the equation, i represents different measurement points for the indicators, j represents the power quality indicators, and k represents the cycle number divided by the total monitoring time.
Based on the classification criteria of power quality indicators in Table 1, let t represent the statistical duration of the indicator detection value y at each level. The resulting probability-time distribution matrix for the combined indicators is as follows:
In the equation, t to t respectively represent the statistical duration of the first indicator within the 1st to rth levels.
(1) Based on the evaluation indicators, construct an indicator matrix (2).
(2) Normalize and shift the matrix indicators:
| (6) |
(3) Normalize the data to obtain
| (7) |
(4) Calculate the entropy values for each indicator:
| (8) |
(5) Calculate the differentiation coefficient ().
| (9) |
(6) Calculate the objective weights of the indicators based on the differentiation coefficient.
| (10) |
(7) However, the traditional entropy weight method mentioned above has some limitations. When e approaches 1, even slight changes in the entropy value of an indicator can result in a significant increase in its weight. Therefore, it is possible to make adjustments to the traditional entropy weight method by adding a corrective term to address these limitations. The improved objective weights of the indicators can be calculated as follows:
| (11) |
The adjustment term is a small value. The smaller the value, the closer it is to the weights obtained from the traditional entropy weight method. Considering the analysis above,
3.3 Subjective and Objective Integrated Weighting Method
Combining the Analytic Hierarchy Process (AHP) with the Improved Entropy Method integrates the strengths of both methods, creating a powerful decision-making tool. AHP excels in handling subjective factors and complex judgment matrices, aiding decision-makers in establishing hierarchy structures, calculating weights, and providing a clear decision framework. On the other hand, the Improved Entropy Method considers the interrelationships between indicators, objectively reflecting their importance and overcoming the limitations of traditional entropy methods. By using these two methods together, a comprehensive consideration of subjective and objective factors is achieved, enhancing the accuracy of weight calculations, reducing decision risks, and improving the stability of decision outcomes. Through mutual validation and supplementation, decision-makers can evaluate decision options more comprehensively, reducing subjective biases and making the decision-making process more scientific, rational, and reliable. This approach not only enhances the quality and efficiency of decision-making but also provides robust support for complex decision problems, making it a recommended and valuable decision-making strategy.
Weighted combination methods such as geometric mean method, minimum deviation combination method, multiplication synthesis method, mathematical programming method, etc., are currently used to combine weights in the assessment of distributed energy resource power quality indicators. The weighting method is as follows:
| (12) |
represents the weights obtained from the subjective weighting method, represents the weights obtained from the objective weighting method, and represents the weights obtained from the integrated weighting method.

Figure 3 Key indicators selection comprehensive evaluation algorithm process.
4 Distributed Power Generation Capacity Assessment
The unregulated integration of distributed power generation into the grid can lead to a series of issues, including overloading of grid equipment and lines, exceeding busbar and line voltage limits, substandard power quality, and ineffective protection. Therefore, when assessing the capacity of distributed power generation, it is essential to ensure the safety and stability of the operational grid as a prerequisite. The thermal stability of grid equipment and lines is a key factor that needs to be evaluated, ensuring that the integration of distributed power generation does not cause currents in the grid equipment and lines to exceed their thermal stability limits and result in overloads. To mitigate issues such as voltage limits, excessive short-circuit currents, and power quality problems, measures can be taken, including adjusting the taps of on-load tap changers, installing reactive power compensation devices, utilizing the power factor regulation capability of photovoltaic inverters, adjusting operating modes, and adding energy storage devices. However, the addition or modification of equipment will incur additional investment costs. Therefore, before undertaking corresponding grid modifications, calculations based on thermal stability assessments should be conducted for voltage deviations, short-circuit currents, harmonics, and other indicators to meet relevant standard requirements.
4.1 Data Preparation
Conduct analysis based on data related to distributed power generation grid connection, grid equipment parameters, and extreme data for safe grid operation.
(1) Distribution network data: The primary network topology diagram of the distribution network to be evaluated, equivalent impedance parameter values, operating modes of busbars for different voltage levels, and their short-circuit impedances.
(2) Rated operating data for equipment: Rated parameters of distribution network equipment and specified operating limits. The rated parameters of distribution network equipment primarily include the applicable voltage levels and the current limits that can flow under operating conditions. It also includes the power factor regulation range of distributed power generation inverters.
(3) Operating data: Operating data for normal operation of busbars, as well as power source operating data for the distribution network under normal operating conditions. This includes historical load time series data for transformers, historical load time series data for lines, historical output time series data for each power source, historical time series data for busbar voltages, and measured values from power quality monitoring points, including harmonic current and interharmonic voltage distortion rates.
(4) Extreme data: This includes limits for busbar voltage deviations, short-circuit current limits, permissible harmonic current values, interharmonic voltage distortion rate limits, voltage fluctuation limits, and frequency limits.
4.2 Calculation Method
4.2.1 Thermal stability assessment
Thermal stability assessment refers to the evaluation of the maximum capacity at which distributed power generation can be integrated based on the historical load profiles of transformers and lines, ensuring that the thermal limits of transformers or lines are not exceeded.
| (13) |
In the equation: represents the active power output of distributed power generation within the supply range of the line at time, represents the active power output of other power sources at time, represents the electricity load at time, where it is typically 5 minutes or 15 minutes.
According to the standard regulations on reverse load rate , I will use to calculate .
In the equation, represents the maximum capacity at which distributed power generation can be integrated.
4.2.2 Short-circuit current verification
The short-circuit current verification relies on the principle that the short-circuit currents of all levels of busbars in the system, before and after the integration of distributed photovoltaics, do not exceed the short-circuit current limits.
| (14) | |
| (15) |
In the equation, represents the actual value of the original short-circuit current, represents the short-circuit current proportionality factor, and represent the allowable short-circuit current limits for the distribution network.
4.2.3 Voltage deviation verification
Voltage deviation verification is based on nominal voltage, actual voltage measurements, voltage deviation calculations, standards and regulations, and corresponding measures and adjustments. By verifying voltage deviations, it ensures that the voltage in the power system is within an appropriate range to meet the requirements of equipment and loads, and ensures the safe and stable operation of the power system. The voltage deviation verification is conducted based on the principles of reactive power on-site balance and ensuring that the voltage remains within limits before and after the integration of distributed power generation into the grid.
| (16) | |
| (17) | |
| (18) |
In the equation, and represent the resistance and reactance of the grid, and represent the active and reactive power output of the distributed power generation, represents the rated voltage of the busbar in the distribution network, and represent the horizontal and vertical components of the voltage deviation, and and represent the maximum positive and negative deviation values.
4.2.4 Voltage fluctuation verification
Voltage fluctuation is measured using the voltage variation value (d), which is expressed as a percentage of the voltage difference between adjacent peak values on the root mean square (RMS) voltage curve divided by the nominal voltage (Un).
| (19) | ||
| (20) |
In the equation, represents the rated voltage, represents the change in injected power from the distributed generation (DG), represents the short-circuit capacity at the DG connection point, represents the voltage at the DG connection point, represents the equivalent impedance of with its impedance angle, and represents the power factor angle of the DG.
4.2.5 Harmonic Verification
Due to the use of power electronic devices for power conversion in distributed energy resources, the nonlinear characteristics of these devices introduce harmonic currents and voltages, which can have an impact on the power system. The total harmonic distortion of voltage and the limit of inter harmonic voltage distortion rate are considered to assess the compliance with harmonic requirements.
| (21) | |
| (22) |
In the equation, represents the voltage magnitude of all harmonic components, represents the voltage magnitude of the fundamental harmonic component, and represents the limit of the total harmonic distortion rate of the current.
4.2.6 Three-phase balance verification
Due to the different distribution and connection methods of distributed power generation, it can lead to an imbalance in the three-phase voltage and current in the power system. The voltage balance ratio is commonly used to verify the balance.
| (23) |
In the equation, represents the threshold for the degree of three-phase voltage imbalance, represents the effective average value of the three-phase line voltage at the node, and represent the effective values of the three-phase line voltage.
4.2.7 Evaluation Process
(1) Select key indicators and determine voltage levels.
(2) Measure whether reverse power supply is required. If reverse power supply is present, do not consider adding distributed power generation capacity.
(3) Determine the reverse load rate and calculate .
(4) Evaluate each voltage level in descending order (e.g., 220 kV, 110 kV, 35 kV, 10 kV). Assess whether the three indicators exceed the limits for each level. If they do, gradually decrease the allowable capacity for additional distributed power generation (). If not, determine the capacity for accommodating distributed power generation ().
(5) After completing the calculation for the current voltage level, compare the results with the previous voltage level based on the topological connection. Choose the smaller value as the evaluation result for the current level. Then, decrease the voltage level gradually and repeat step (4) until all voltage levels in the network under evaluation have been assessed.
(6) Based on the maximum capacity of distributed power generation that can be injected according to each voltage level, draw the distribution power generation capacity map for the area based on the grid topology. Determine the capacity level of the area according to Table 4.
Table 4 Power quality indicator levels distributed generation capacity rating classification
| Evaluation | ||
| Level | Judgment Basis | Implication |
| Light Capacity | Poor on-site absorption capacity of distributed power generation. Electrical equipment may exhibit reverse load and poor thermal stability. | |
| Medium Capacity | Good on-site absorption capacity of distributed power generation. Electrical equipment exhibits good thermal stability. | |
| Heavy Capacity | Excellent on-site absorption capacity of distributed power generation. Electrical equipment exhibits excellent thermal stability. |
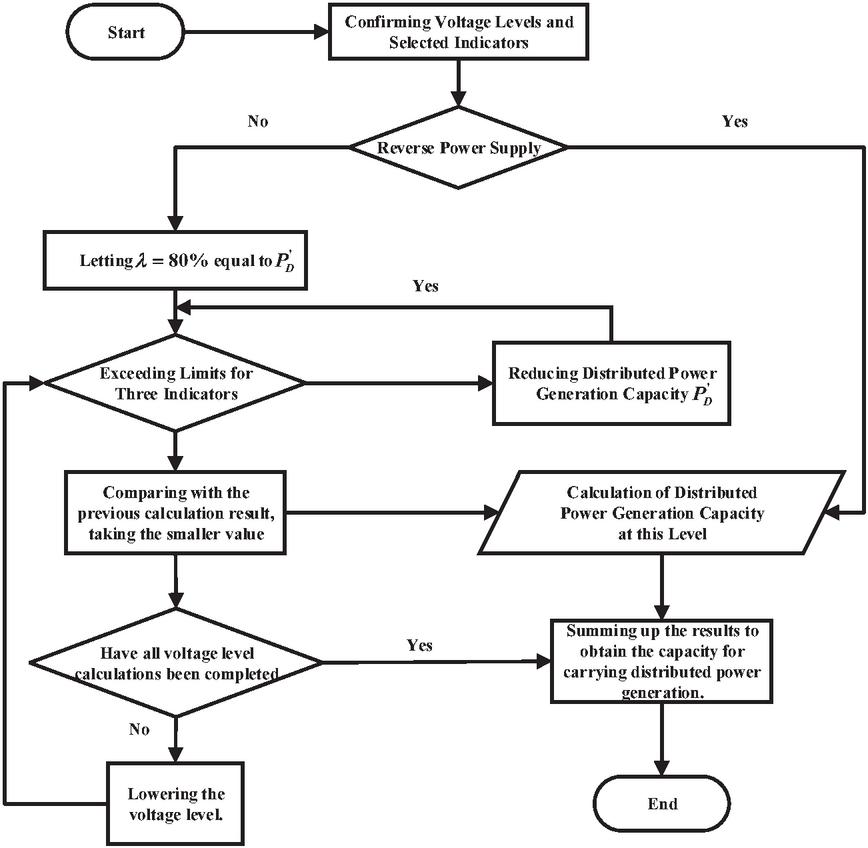
Figure 4 Distributed power supply capacity process.
5 Case Study
5.1 Calculation Example System
Based on the data from the user-side distributed energy archives, according to the proposed assessment method, three random days were selected to collect data from the distributed power source grid connection points. The probability-time distribution matrix is obtained by preprocessing and correcting the data. The selected assessment indicators for the distributed power source carrying capacity in the distribution network are voltage deviation (), three-phase imbalance (), voltage harmonic distortion rate (), voltage fluctuation (), and short-circuit current ().
After expert analysis and research, the judgment matrix was obtained based on the rules presented in Table 2.
The Improved Entropy Weighting Method
The objective weights are calculated by processing and analyzing the matrices , , and .
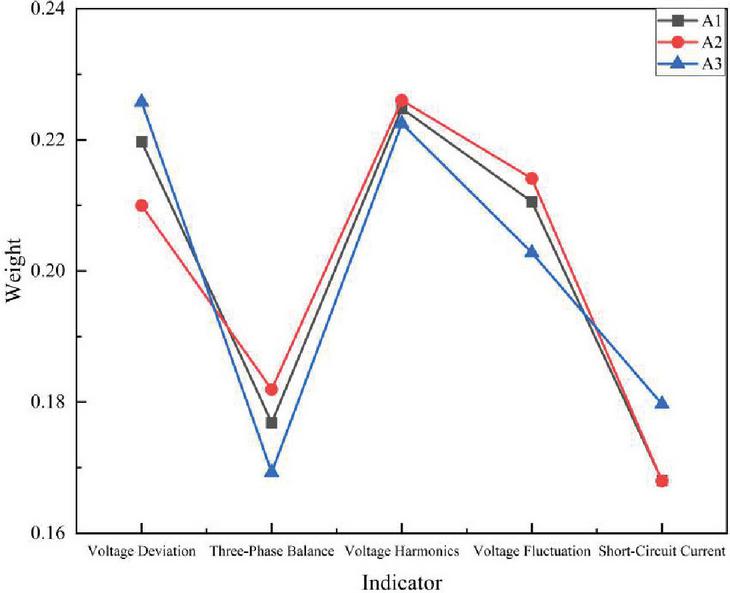
Figure 5 Objective weighting of distributed power source indicators.
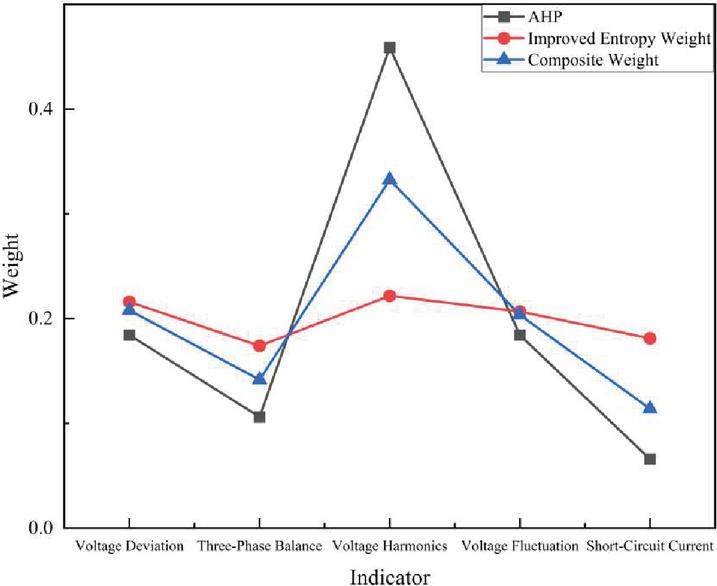
Figure 6 Weight allocation for distributed power source indicators.
Thus, a comprehensive evaluation is conducted on each influencing factor, and they are prioritized based on the evaluation values. Through the research, it is concluded that voltage deviation, voltage harmonic distortion rate, and voltage fluctuation have the highest weightage. Therefore, these three factors are selected for further assessment of the dispersed power source carrying capacity within the distribution network. This selection yields significant results while reducing the number of iterations and accelerating the computation speed.
In this study, a specific city’s distribution network in Zhejiang Province, China, is taken as an example. The evaluation focuses on the 220 kV power supply network. Various factors such as the output level of distributed power sources and the load level are considered, and a historical typical day is selected as the reference for evaluation.
Table 5 Weight allocation for distributed power source indicators
| AHP | Improved | Composite | |
| Indicator | Weight | Entropy Weight | Weight |
| Voltage Deviation | 0.1844 | 0.2160 | 0.2080 |
| Three-Phase Balance | 0.1063 | 0.1740 | 0.1418 |
| Voltage Harmonics | 0.4589 | 0.2219 | 0.3326 |
| Voltage Fluctuation | 0.1844 | 0.2068 | 0.2036 |
| Short-Circuit Current | 0.0660 | 0.1813 | 0.1140 |
The scope of evaluation includes one 220 kV transformer, two 110 kV transformers, and two 35 kV transformers, with no centralized power source access.
The evaluation process, as depicted in Figure 2, is applied to calculate the distributed power source carrying capacity of the case study’s electrical network. Based on the thermal stability of the voltage level lines and equipment, and considering the national standard , the capacity of injectable distributed power sources is determined. After applying constraints based on the hierarchical topology, voltage deviation, voltage harmonic distortion rate, and voltage fluctuation, the distributed power source carrying capacity results for each level of the bus are obtained, ensuring compliance with all safety constraints.
The distributed power source carrying capacity within the supply range of the high-voltage bus of the 220 kV main transformer is determined to be 35.86 MW. This value represents the total capacity of distributed power sources planned for construction in the area in the short term. It is important to ensure that the cumulative capacity of all lower-level buses does not exceed this value. Please refer to the accompanying figure for the specific numerical values.
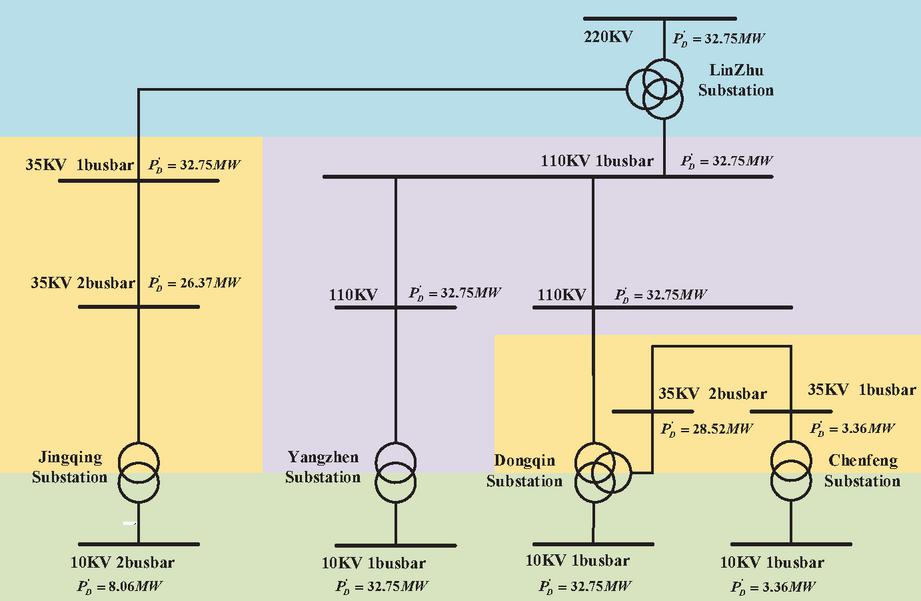
Figure 7 Grid topology of example.
Table 6 Voltage level capacity assessment
| Voltage Level | Carrying Capacity Level |
| 220 kv | Medium carrying capacity |
| 110 kv | Heavy-duty carrying capacity |
| 35 kv | Medium carrying capacity |
| 10 kv | Medium carrying capacity |
6 Conclusion
This article focuses on the connection of large-scale distributed power sources and establishes a model for key impact indicators at multiple time scales. It proposes a comprehensive weighted indicator selection method and a distributed power source carrying capacity assessment method. The main innovations are as follows:
(1) Drawing upon current fluctuation data and key factors aligned with real safety standards, this article leverages big data inference techniques, ensuring comprehensive coverage with minimal data input requirements.
(2) In order to accurately and efficiently assess the carrying capacity of distributed power sources in a distribution network, this study provides numerical values for the distributed power source carrying capacity of various voltage levels in the distribution network. This assessment helps in the planning of the power grid and the development of renewable energy sources, and it avoids a series of issues such as power system instability, equipment failures, blackouts or power outages, and a decline in power quality.
In conclusion, assessing the capacity for distributed power sources is of significant importance in enhancing the reliability of power systems, promoting the utilization of clean energy, enhancing grid flexibility, and reducing energy losses. It serves as a crucial element in driving the sustainable development of the power industry and energy transition.
This article has achieved good results in the assessment of distributed power source carrying capacity. However, the dynamic changes on the load side have not been fully considered. It is recommended to promptly construct an actual model of the local distribution network in Zhejiang Province and perform real-time analysis online to address this limitation.
Acknowledgements
This research paper is funded by the Science and Technology Project of State Grid Zhejiang Hangzhou Electric Power Co., Ltd. The project is focused on the development of key technologies and systems for the novel distribution network’s edge collaborative voltage flexible control. The project is identified by the project number B311HZ230001. We sincerely appreciate their support and contribution.
References
[1] A. Soroudi, M. Ehsan, R. Caire and N. Hadjsaid, “Possibilistic Evaluation of Distributed Generations Impacts on Distribution Networks,” in IEEE Transactions on Power Systems, vol. 26, no. 4, pp. 2293–2301, Nov. 2011.
[2] C. Zhu, Y. Peng, Y. Yu and P. Ju, “Research on Voltage Fluctuation of Power System Considering Wind Power Connection,” 2020 12th IEEE PES Asia-Pacific Power and Energy Engineering Conference (APPEEC), Nanjing, China, 2020, pp. 1–5.
[3] N. Çiçek and H. Deliç, “Demand Response Management for Smart Grids With Wind Power,” in IEEE Transactions on Sustainable Energy, vol. 6, no. 2, pp. 625–634, April 2015.
[4] C. Lin et al., “The influence of wind farm containing DFIG on power system stability,” 2015 5th International Conference on Electric Utility Deregulation and Restructuring and Power Technologies (DRPT), Changsha, China, 2015, pp. 1416–1421.
[5] S. Chen, Y. Xiang, W. Sun and J. Liu, “Evaluating Connectable Capacity of Distributed Wind Generation in Distribution Networks Through a Bayesian Integrated Optimization Method,” in IEEE Systems Journal, vol. 16, no. 2, pp. 2110–2120, June 2022.
[6] Y. Li, X. Tian, J. Hu, C. Liu, C. Wang and Y. Xiao, “The Key Issue of Control Strategy For Large-scale Wind Power Grid Integration,” 2020 IEEE 4th Conference on Energy Internet and Energy System Integration (EI2), Wuhan, China, 2020, pp. 1589–1592.
[7] Y. Sun et al., “Model predictive control and improved low-pass filtering strategies based on wind power fluctuation mitigation,” in Journal of Modern Power Systems and Clean Energy, vol. 7, no. 3, pp. 512–524, May 2019.
[8] A. Basit, A. D. Hansen, M. Altin, P. E. Sørensen and M. Gamst, “Compensating active power imbalances in power system with large-scale wind power penetration,” in Journal of Modern Power Systems and Clean Energy, vol. 4, no. 2, pp. 229–237, April 2016.
[9] Z. Zhang, K. Wang, Q. Zhao, Y. Tian and L. Li, “Positive Sequence Current Phase-Based Improved Reverse-Power Protection and a PV Hosting Capacity Assessment Method for Spot Networks,” in IEEE Access, vol. 8, pp. 42529–42539, 2020.
[10] Y. Song, D. J. Hill and T. Liu, “Static Voltage Stability Analysis of Distribution Systems Based on Network-Load Admittance Ratio,” in IEEE Transactions on Power Systems, vol. 34, no. 3, pp. 2270–2280, May 2019.
[11] P. Wang et al., “Impact of the PV Location in Distribution Networks on Network Power Losses and Voltage Fluctuations with PSO Analysis,” in CSEE Journal of Power and Energy Systems, vol. 8, no. 2, pp. 523–534, March 2022.
[12] C. Karasala, R. R. Lekkala, H. Myneni and S. K. Ganjikunta, “PV Grid-Connected Inverter With DC Voltage Regulation in CCM and VCM Operation to Reduce Switching Losses,” in IEEE Transactions on Industrial Electronics, vol. 70, no. 11, pp. 11262–11275, Nov. 2023.
[13] S. Wu, J. Xie, X. Liu, B. He, M. Yang and Z. Li, “Marginal optimization method to improve the inconsistent comparison matrix in the analytic hierarchy process,” in Journal of Systems Engineering and Electronics, vol. 28, no. 6, pp. 1141–1151, Dec. 2017.
[14] J. Chen, F. Zhou, L. Gu, H. Yin, L. Zhang and C. Gao, “Evaluation Index and Evaluation Method of Three-Phase Imbalance Treatment Effect Based on Commutation,” in IEEE Access, vol. 10, pp. 101913–101921, 2022.
[15] S. Hashemi, J. Østergaard and G. Yang, “A Scenario-Based Approach for Energy Storage Capacity Determination in LV Grids With High PV Penetration,” in IEEE Transactions on Smart Grid, vol. 5, no. 3, pp. 1514–1522, May 2014
[16] Wenbo Hao, Chengzhi Sun and Zhao Leilei, “The research on adaptability evaluation of wind power integration capacity in power grid considering wind-solar hybrid complementary characteristics and flexible loads interference,” 2016 IEEE PES Asia-Pacific Power and Energy Engineering Conference (APPEEC), Xi’an, 2016, pp. 1856–1860.
[17] H. Wang, Z. Shan, G. Ying, B. Zhang, G. Zou and B. He, “Evaluation method of node importance for power grid considering inflow and outflow power,” in Journal of Modern Power Systems and Clean Energy, vol. 5, no. 5, pp. 696–703, September 2017.
[18] Z. Zhang and Z. Yu, “Construction and measurement of evaluation index system of distributed power carrying capacity in distribution network,” 2021 IEEE 4th Advanced Information Management, Communicates, Electronic and Automation Control Conference (IMCEC), Chongqing, China, 2021, pp. 570–573.
[19] J. Ma, Z. Yu, Y. Wei, H. Li, G. Lu and B. Tian, “Renewable Energy Integrated HVDC Power System Modeling for Transient Frequency Stability Online Assessment,” 2022 7th International Conference on Power and Renewable Energy (ICPRE), Shanghai, China, 2022, pp. 1–5.
[20] A. Soroudi, M. Ehsan, R. Caire and N. Hadjsaid, “Possibilistic Evaluation of Distributed Generations Impacts on Distribution Networks,” in IEEE Transactions on Power Systems, vol. 26, no. 4, pp. 2293–2301, Nov. 2011.
[21] D. Zhu, Z. Wang, J. Hu, X. Zou, Y. Kang and J. M. Guerrero, “Rethinking Fault Ride-Through Control of DFIG-Based Wind Turbines from New Perspective of Rotor-Port Impedance Characteristics,” IEEE Trans. Sustain. Energy, vol. 15, no. 3, pp. 2050–2062, Jul. 2024.
[22] G. Chen, B. Li, J. Wu, R. Deng, L. Guo and J. Yi, “Assessment of the Large-Scale Low-Pressure Distributed Energy Cluster Response Potential Based on the Combination of Subjective and Objective Methods,” 2023 International Conference on Power Energy Systems and Applications (ICoPESA), Nanjing, China, 2023, pp. 660–666.
[23] M. Wang, H. Wu and B. Hu, “Load Supply Capability Evaluation of Distribution Network with Distributed Generation Based on Evidence Theory,” 2021 IEEE 4th International Electrical and Energy Conference (CIEEC), Wuhan, China, 2021, pp. 1–6.
[24] M. Rylander, J. Smith and W. Sunderman, “Streamlined Method for Determining Distribution System Hosting Capacity,” in IEEE Transactions on Industry Applications, vol. 52, no. 1, pp. 105–111.
[25] Zhao B, Wei L, Xu Z, et al. Photovoltaic accommodation capacity determination of actual feeder based on stochastic scenarios analysis with storage system considered[J]. Automation of Electric power systems, 2015, 39(9): 34–40.
[26] Q. Xu et al., “A Probabilistic Method for Determining Grid-Accommodable Wind Power Capacity Based on Multiscenario System Operation Simulation,” in IEEE Transactions on Smart Grid, vol. 7, no. 1, pp. 400–409.
[27] H. Yu et al., “Evaluation Method of Distributed Photovoltaic Carrying Capacity in Distribution Network Based on Voltage Sensitivity Ranking,” 2022 IEEE 5th International Electrical and Energy Conference (CIEEC), Nangjing, China, 2022, pp. 238–243.
[28] Mishra, S., Das, D., and Paul, S. (2010). Active Loss Allocation Systems in Radial Distribution Systems. Cogeneration & Distributed Generation Journal, 25(3), 26–43.
[29] Ramana, T., Ganesh, V., and Sivanagaraju, S. (2010). Distributed Generator Placement And Sizing in Unbalanced Radial Distribution System. Cogeneration & Distributed Generation Journal, 25(1), 52–71.
[30] Kong, X., Zhang, Z., and Yin, X. (2015). Fault Current Study of Inverter Interfaced Distributed Generators. Distributed Generation & Alternative Energy Journal, 30(3), 6–26.
Biographies
Zhao Zongluo, female, Her research interests include revenue allocation of coupled systems within the power market.
Yabo Li, Male. His research interests include revenue allocation of coupled systems within the power market.
Qicheng Sun, male, is currently a master’s degree candidate in Electrical Engineering at Northeast Electric Power University. His research focuses on electricity markets and low-carbon optimization operation of power systems.
Ruifeng Li, male, is currently a master’s degree candidate in Electrical Engineering at Northeast Electric Power University. His research focuses on electricity markets and low-carbon optimization operation of power systems.
Zhenxu Ma, male, obtained a master’s degree in Power System and Automation from Tsinghua University in 2000. His main research interests include planning, preliminary work, and investment in primary distribution networks.
Dongbo Guo, Ph.D. His main research direction is power systems and their automation.
Distributed Generation & Alternative Energy Journal, Vol. 39_5, 1069–1096.
doi: 10.13052/dgaej2156-3306.3956
© 2024 River Publishers