Deterioration Trend Prediction Model of Hydropower Unit Based on Improved SVM-GRU
Tengbin Liu1, Lihua Li1, Xiong Gao1, Xuan Zheng1, Yuguo Zhou1, Dianlong Chen1, Tingwei Wu2 and Xueli An2,*
1China Yangtze Power Co., Ltd., Yichang 443002, China
2China Institute of Water Resources and Hydropower Research, Beijing 100048, China
E-mail: an_xueli@163.com
*Corresponding Author
Received 24 September 2024; Accepted 22 October 2024
Abstract
Under the background of ’double carbon’ goal and ’building a new power system with new energy as the main body’ large-scale new energy access, due to the strong volatility of new energy, makes hydropower units frequently start and stop and carry out power regulation. However, frequent start-stop and power regulation will adversely affect the operating state and life of hydropower units. With the long-term operation of hydropower units, the problem of unit deterioration is becoming more and more serious. In order to accurately evaluate the health state of the unit and predict the deterioration trend of the unit, a prediction model of the deterioration trend of the hydropower unit based on improved support vector machine (SVM), variational mode decomposition (VMD) and gate recurrent neural network is proposed. The model is based on improved support vector machine algorithm and field test data to establish the unit health state model. Secondly, the trend sequence of unit deterioration degree is calculated according to the health state model. Thirdly, the deterioration degree trend sequence is input into the variational mode decomposition algorithm for decomposition, and the gate-cycle neural network is used to predict the trend of the decomposition modes. Finally, the forecast sequence of unit deterioration trend is obtained by integrating the result of trend prediction. The results of example analysis show that the method can fit the health state of the unit well and make reasonable and accurate prediction of deterioration trend.
Keywords: Health state model, deterioration trend prediction, SVM-AdaBoost, VMD, GRU.
1 Introduction
With the increase of the service life of the unit, the components of the unit are deteriorating [1, 2]. How to make a reasonable judgment on the deterioration state according to the situation reflected on the unit site and construct an effective deterioration trend of hydropower units is an important issue in the health diagnosis of hydropower units [3, 4]. Liu et al. [3] introduced an advanced fault detection system for hydropower units, leveraging pattern recognition techniques applied to the axis orbit data. Their study involved examining real-world data from a hydroelectric facility to assess how factors like the quantity of training samples and the dimensions of the axis orbit images impact the effectiveness of their approach. Additionally, they explored the importance of implementing noise reduction processes in enhancing method performance. To address the misidentification problem of signals containing unknown faults for hydropower units, Chen et al. [4] designed a progressive fault diagnosis system using intrinsic mode function (IMF) and bidirectional long short-term memory neural network (BiLSTMNN).
In recent years, the research on the prediction of equipment deterioration trend has been gradually carried out, but it is still in its infancy [5–8]. Ran et al. [5] introduced a deep latent variable-driven state space degradation model for bearing degradation prediction, leveraging the robust nonlinear modeling capabilities of deep learning to broaden the application scope of state space equations. This approach not only retains the strengths of traditional state space models (SSMs) but also systematically addresses uncertainties. Additionally, by incorporating differential pre-transformation, the model’s long-term prediction accuracy was enhanced. Yu et al. [6] introduced a degradation trend prediction algorithm guided by principal features, which is grounded in the gear fault dynamics model. They developed a high-fidelity dynamic model for faulty gears by examining the degradation mechanisms across various failure modes. This model serves as a valuable resource for generating comprehensive failure data, thereby facilitating accurate long-term remaining useful life (RUL) predictions for faulty gears. To enhance the precision of predicting the performance degradation trend in proton exchange membrane fuel cells (PEMFCs), Zhao et al. [7] devised a temporal convolutional network (TCN) model optimized through genetic algorithms (GA). They utilized the PEMFC stack degradation dataset from the IEEE PHM 2014 Data Challenge to validate their model, comparing it against backpropagation neural networks, long short-term memory models, and traditional TCN models. The findings indicate that their proposed method outperforms these alternatives in terms of accuracy for predicting performance degradation trends. Zhou et al. [8] proposed a prediction framework based on factor analysis and Multiple Penalty Mechanisms (MPM) loss function, to settle the problem that current prediction techniques do not consider the practicality of the prediction results.
The accuracy of the standard health state model of the unit can greatly affect the quality of the deterioration trend prediction. Therefore, it is necessary to consider the use of accurate and effective methods to construct a unit health model that is appropriate to the actual data [9].
For the fitting problem of the model, scholars have proposed a series of methods [10–13]. As a classical machine learning theory, support vector machine (SVM) has good performance in nonlinear and unstable sequence fitting problems, and can effectively avoid the problems of overfitting and underfitting. Freund proposed AdaBoost ensemble method. This method breaks through the limitation that the difference of each sub-learner needs to be large in ensemble learning because it only needs a single weak learner to integrate. The ensemble learner based on AdaBoost algorithm shows good performance in practical application. Therefore, the application of Ada-Boost algorithm can enhance the classification effect of SVM, and SVM-based classifier significantly improves the accuracy of diagnosis [14].
Artificial neural network is widely used in data processing [15–17]. Nagaraj et al. [15] proposed a model based on artificial neural networks that facilitates the estimation of total kilowatt-hours per year for specific combinations of solar photovoltaic systems, wind generators, and battery storage. Semero et al. [16] proposed a hybrid neural network modeling technique for forecasting wind power generation, utilizing an integrated algorithm that combines genetic algorithms (GA) and particle swarm optimization (PSO). Manas [17] designed and optimized a multi-objective function modeled on variables related to distributed generators, specifically those based on photovoltaic systems, wind energy, and biogas-powered internal combustion engines for a community smart DC microgrid using particle swarm optimization.
Gated recurrent unit (GRU), proposed by Cho et al. in 2014 [18–21], is a variant of recurrent neural networks (RNN) and is particularly good at dealing with long-term dependencies. Compared with the standard RNN, GRU solves the problem of gradient disappearance and gradient explosion by introducing a gating mechanism, so that it performs better in processing long sequence data [22]. Compared with recurrent neural networks, GRU has fewer parameters and lower computational complexity, but it performs fairly or even better on many tasks. Through the gating mechanism, GRU can deal with long-term dependencies more effectively, improve training efficiency and model performance [23].
This paper leverages comprehensive field test data from the hydropower unit and combines the monitoring data to predict the deterioration trend of the hydropower unit. Firstly, the health state model of hydropower unit is established based on SVM-AdaBoost algorithm. Secondly, the operating condition data of the unit is input into the health state model, and the deterioration trend of the unit is obtained by combining the condition monitoring data of the unit. Then, the variational mode decomposition (VMD) method is used to decompose the complex degradation trend into simple modal components. Using GRU’s powerful feature extraction ability and nonlinear expression ability, the trend of each modal component is predicted. Finally, the modal decomposition prediction results are combined to obtain the prediction results of the deterioration trend of hydropower units.
2 Basic Principle
2.1 SVM Algorithm
The main function of the SVM algorithm is to classify the data. According to the structural risk minimization theory, it is separated in different types of sample data structures, and finally an optimal separation plane is found. Given a linearly separable data set:
In the sample space, an optimal plane can be found to make it farthest from the sample, and in the case of sample data fluctuations, the distance to the plane is also minimal. The optimal plane defined in this way has the best generalization ability and the resulting classification results are more robust. The optimal plane can be represented by the following formula:
| (1) |
where is the distance vector, perpendicular to the optimal plane, and () denotes the optimal plane, then the distance from any point to the plane is:
| (2) |
When the optimal plane classifies the sample data, there are:
| (3) |
Select several data points closest to the optimal plane, and these data points need to meet the conditions that the distance to the optimal plane is the same. Such data points are called support vectors, and the distance between two support vectors is called interval, which is expressed by Formula (4):
| (4) |
Therefore, in order to obtain the optimal plane in the sample space, it is necessary to find the maximum interval in the support vector, which is described by Formula (5):
| (5) |
Perform Lagrange transformation on formula (5), the Formula (6) can be obtained.
| (6) |
where . By calculating the partial derivative of (b,a) and making it equal to 0, Formula (7) can be obtained:
| (7) |
Substituting Formula (7) into Formula (5), the dual form of the formula can be obtained.
| (8) |
After obtaining a, the (,b) can be obtained, it can describe the optimal plane.
| (9) |
Corresponding to Formula (3), the conditions needs to satisfy are:
| (10) |
From the above inequality, it can be deduced that for the optimal plane, only the boundary of the data point at the maximum interval will have an impact on it, that is, when the data point itself is the support vector, it will have an impact on it. Therefore, when learning with SVM, a large number of data samples will not be retained, and the performance of the model is only related to the support vector, so SVM can deal with the small sample problem well.
However, since the SVM model only relies on a small number of data points, it is prone to data misclassification during classification, resulting in abnormal results. This paper introduces the AdaBooat integration algorithm to reduce the impact of abnormal data on segmentation by increasing the attention to abnormal data, thereby improving the performance of the algorithm.
2.2 AdaBoost Ensemble Algorithm
As an important branch of Boost algorithm, Adaboost algorithm is widely used with excellent performance. Its main advantage is that it can be adaptively enhanced for the training process. When using the algorithm to start model training, multiple classifiers can be used for serial calculation. After each classifier completes the training results, the results are integrated. In this process, the next base classifier will process the training results of the previous base classifier, judge the wrong classification data according to the preset threshold, and then change the training weight parameters, and repeat the process until the correct rate or the preset number of iterations is reached. The algorithm flow is shown in Figure 1.
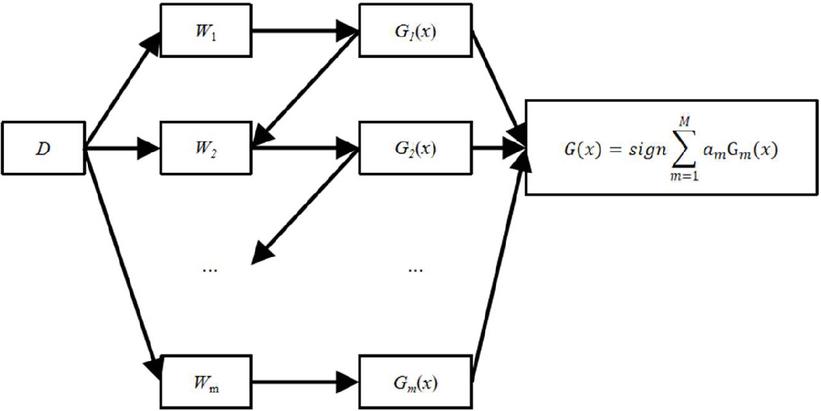
Figure 1 Algorithm flow chart.
The steps of Adaboost algorithm are as follows:
Step 1: select the base classifier of the Adaboost algorithm, use the data set with the total number of samples N to train the algorithm model, assign a 1/N weight to each sample, and determine the number of iterations M. Set as the weighted value at the m-th iteration of training, Wmi is the weighted value of the i-th data in the training sample at the m-th iteration.
Step 2: After determining the weight value, the error of each training result of the base classifier Gm(x) is calculated.
| (11) |
where is the type of sample data.
Step 3: Iterative weight:
| (12) |
Calculate the weights of different data classes, constantly update the new weights and apply them to the next base classifier, and define a new generation of sample weights .
| (13) |
where is the normalized parameter, and can be modified as a probability distribution.
Step 4: Integrate the base classifier to get the final result.
| (14) |
2.3 CNN-GRU Model
In the CNN-GRU model, the reset gate can filter the iterative information that can be retained according to the input data of this iteration and the hidden state of the last iteration, and enter the ratio of the historical data to the current data in the hidden state. The update gate control discards the data and updates the data to ensure that the proportion of updated input data and historical data in the hidden state is within a reasonable range.
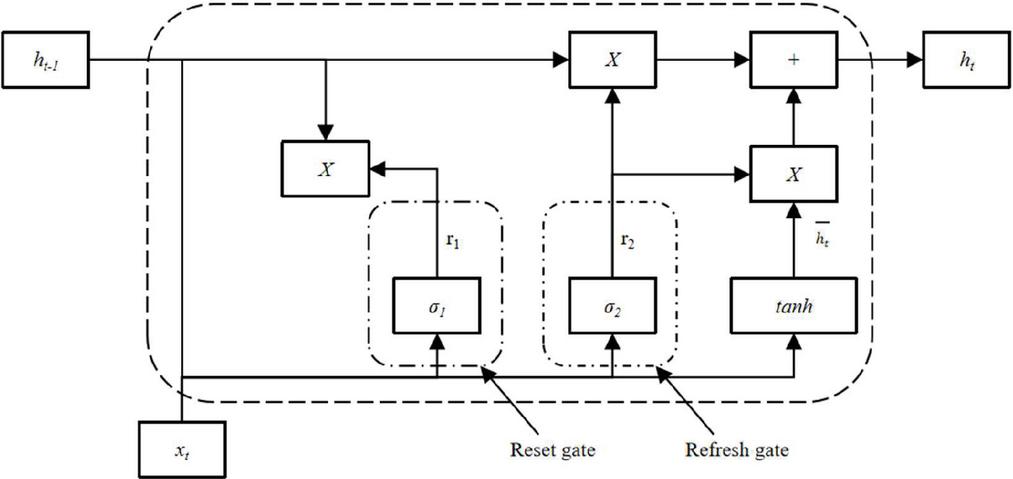
Figure 2 Structure of gated recurrent unit.
The specific calculation formula is as follows:
| (15) |
where represents the input at time ; and respectively represent the weight parameters corresponding to the input unit and hidden unit at the previous moment; represents resetting the bias of the gate unit.
The candidate state at the current moment is represented by formula (16)
| (16) |
where and respectively represent the weight parameters of the network; bh represents the bias of the network.
Under the action of the sigmoid activation function, the update gate tz is determined by the output ht-1 of the hidden unit at the previous time and the input xt at the current time to determine the threshold height of the loop gate. The specific function formula is as follows:
| (17) |
where and respectively represent the weight parameters of the update gate; represents the bias of the update gate.
The output unit at the final moment is represented by formula (18).
| (18) |
It can be seen that the higher the threshold height of the update gate, the greater the impact of the previous output on the current output, and the smaller the impact of candidate state variables on the output.
3 Degradation Trend Prediction Based on Improved SVM-VMD
In the CNN-GRU model, the reset gate can filter the iteration information that can be retained based on the input data of this iteration and the hidden state in the previous iteration, and determine the ratio of historical data to current data in the hidden state; Update the gate to control the amount of data discarded and updated, ensuring that the proportion of updated input data and historical data in the hidden state is within a reasonable range.
Analyze the on-site test data of hydropower units under different water head and output, and establish a health status model for hydropower units based on SVM AdaBoost. The specific steps are as follows:
(1) Establish a health status model for hydropower units.
Selecting feature quantities such as water head and active power that characterize different operating states of hydropower units under healthy conditions as model inputs, and using the corresponding unit vibration signal F(t) as the model output, a health state model of hydropower units is constructed. Use formula (19) to represent the mapping relationship between the operating parameters H(t), P(t) of the unit and the vibration parameters of the unit:
| (19) |
where is the running time.
(2) Establish the degradation level of hydropower units.
After long-term operation of the unit, the components gradually deteriorate, and it is necessary to quantitatively analyze the degree of deterioration of the unit equipment. We propose the degree of deterioration to measure the degree of deviation of the unit from a healthy state. Substitute the current operating data of the unit into the unit health state model based on SVM AdaBoost, output the healthy vibration parameter value F(t) in the current state, and compare it with the monitoring value V(t), which is the current state degradation degree D(t). The definition of degradation degree is shown in formula (20).
| (20) |
Due to the instability and nonlinearity of the unit operation, the corresponding degradation trend is also difficult to stabilize, making it difficult to predict it using simple methods. This paper uses gate recurrent neural network combined with variational mode decomposition method to predict the degradation sequence. Taking the current degradation sequence of the unit as input, the changes in degradation trend are predicted. The specific steps are as follows:
(1) Decompose the original degraded sequence into multiple vectors through variational mode decomposition. VMD is used to decompose complex signals into several simple modal components with finite bandwidth and corresponding frequency centers.
The VMD algorithm is based on variational problems. Firstly, the signal is decomposed into low-frequency and high-frequency parts to obtain several components. Then, the objective function is to minimize the estimated broadband sum of the components. The model expression is:
| (21) |
where u represents the component obtained by decomposing the signal through the VMD algorithm; is the frequency at the center position corresponding to each component.
(2) Input the decomposed modal sequence into a convolutional neural network for feature extraction, use a single convolutional layer for data organization, and apply a max pooling layer to process the convolved data. Input the results into the gate recurrent neural network for reset update iteration, and finally obtain the prediction results of different modal sequences.
(3) Overlay these predicted sequences to obtain the predicted trend of degradation of hydropower units.
4 Example analysis
4.1 Monitoring Data Analysis
Considering that the operation status of hydropower units will be directly reflected in the vibration signal, the X-directional swing data of the water guide of a certain power station is selected to reflect the status of the unit. The relationship between unit water head, active power, and unit vibration is shown in Figure 3.

Figure 3 Unit output and vibration relationship diagram.
4.2 Establishing a Unit Health Model
Based on the SVM-AdaBoost algorithm, a health status model of the unit was established, and 378 data samples obtained from field experiments were selected to fit the mapping relationship between the unit operating conditions data, namely water head and active power, and vibration monitoring data, namely water guide deflection. To ensure that the unit health model can effectively reflect the operating status of the unit, the selected data includes all possible head and active power ranges of the unit operation. Randomly select 310 data points as training samples for the model and 68 data points as testing samples. The model parameters are shown in Table 1. The fitting results are shown in Figure 4.
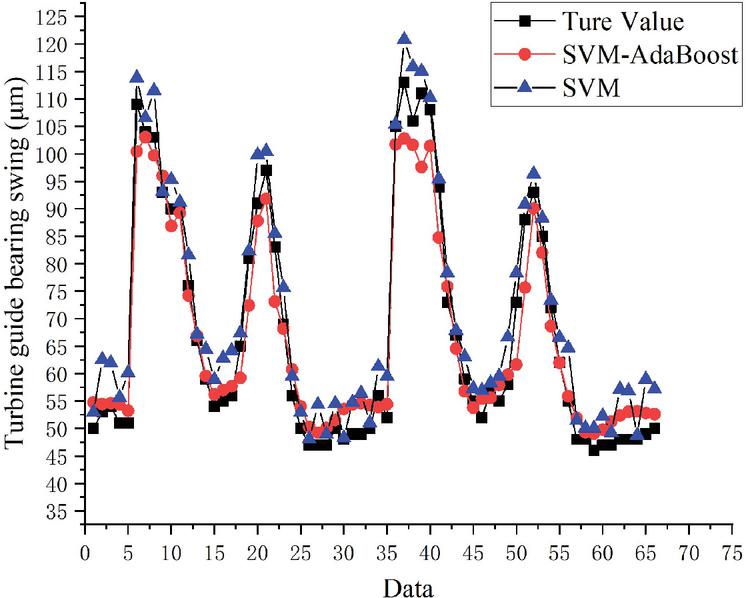
Figure 4 SVM-AdaBoost fitting results.
Table 1 SVM-AdaBoost parameters
| Parameter | Value |
| Delay step | 10 |
| Time-span step | 1 |
| Enhanced Learning Rate | 0.01 |
| Number of reinforcement learning | 190 |
| Number of weak regressors | 10 |
To demonstrate the accuracy of the model results, this paper uses root mean square error (RMSE), mean absolute error (MAE), mean absolute percentage error (MAPE), and symmetric mean absolute percentage error (SMAPE) to characterize them, and provides a histogram of the testing machine data error. The expression is delineated in formulas (22), (23), (24) and (25). Specifically, represents the true values – predicted values on the dataset. The evaluation indicators of the model are shown in Table 2.
| (22) | |
| (23) | |
| (24) | |
| (25) |
Table 2 Model evaluation index
| Value | ||
| Evaluation Index | SVM-AdaBoost | SVM |
| RMSE/m | 12.338 | 15.733 |
| MAE/m | 7.067 | 10.628 |
| MSE/m | 8.56 | 10.43 |
| MAPE/% | 9.85 | 12.38 |
From the above results, it can be seen that the fitting error of the health status model based on SVM-AdaBoost is small, and the deviation between the calculated values and the actual values is small. This indicates that the health status model based on SVM-AdaBoost can well characterize the operation of the hydropower unit under healthy conditions.
4.3 Construction of Unit Degradation Trend
This paper constructs a degradation trend sequence based on data samples of the unit from September 1, 2023 to October 1, 2023. Input the monitoring data obtained during this period into the established unit health model to obtain the healthy vibration parameter value F(t). According to the degradation degree calculation formula, the degradation trend sequence is shown in Figure 5.
From this figure, it can be seen that the overall deterioration of unit operation is on the rise, and the deterioration trend cannot be stabilized at a lower level. It can indicate that the unit has already shown a trend of deterioration at this time, but the fluctuation is large, which cannot accurately describe the deterioration situation of the unit.
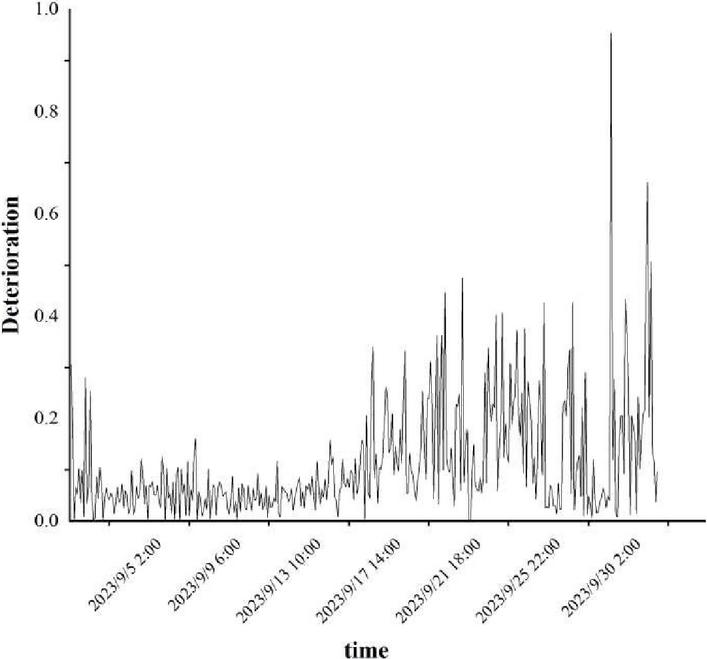
Figure 5 Unit deterioration trend.
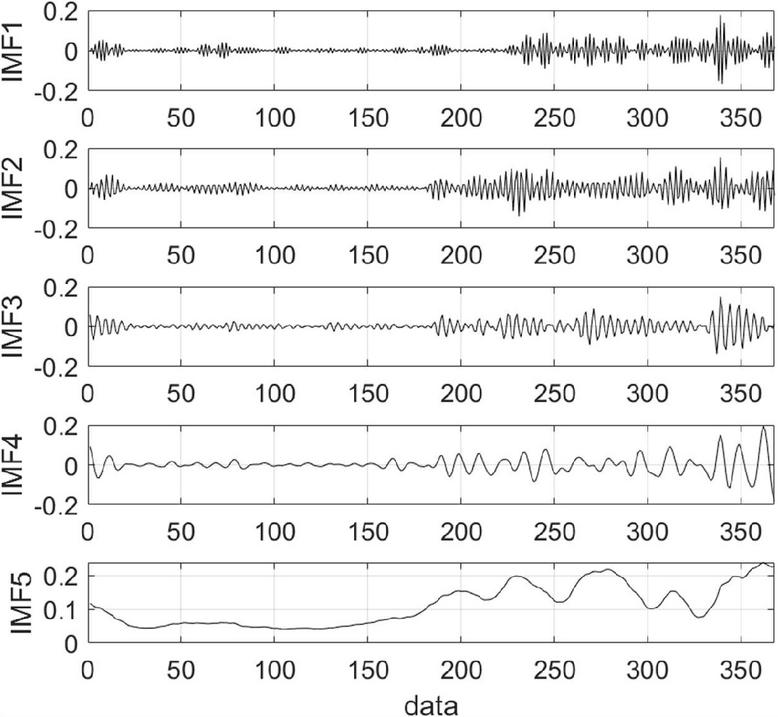
Figure 6 VMD decomposition results.
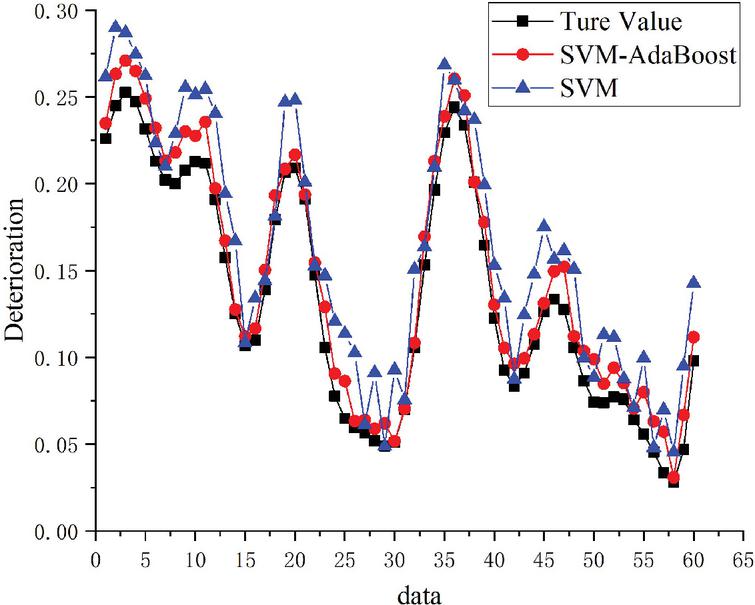
Figure 7 Deterioration trend prediction.
4.4 Deterioration Trend Assessment
In order to accurately describe the degradation status of the unit and further predict the degradation trend, variational mode decomposition of the unit degradation sequence was adopted. The VMD decomposition results are shown in Figure 6. It can be seen from the figure that the decomposition results clearly reflect the degradation status of the unit. Components 1 to 4 reflect the gradually unstable operating state of the unit during this time period, and component 5 reflects the gradually increasing degree of unit degradation. Clear modal sequences can better predict future sequences.
After decomposition, input each component into the corresponding GRU model for prediction. Set the output feature dimension to 10, the feature extraction level to 32, the reset gate level to 128, and the update gate level to 32. During the training process, set the number of samples to 24, the maximum number of iterations to 30, and the learning rate to 0.005.
The results obtained are shown in Figure 7, from which it can be seen that the difference between the predicted values of the model and the actual values is very small, which can well reflect the actual situation of the unit after degradation. When the degradation degree fluctuates, the corresponding trend can also be well fitted, which verifies the effectiveness of the proposed model in predicting the degradation trend of the unit.
5 Conclusion
Given the significant fluctuations in the degradation trend and insufficient stability of hydropower units, this paper analyses the complex interaction between water head, active power, and unit vibration characteristics based on the actual engineering situation. A standard health state model based on the integrated algorithm of support vector machine (SVM) and AdaBoost was constructed using the rich experimental data accumulated on site by the unit.
After establishing the standard health model, the degradation trend sequence of the hydropower units is effectively extracted by using the data collected in the real-time monitoring system. In order to further improve the prediction accuracy, a unit degradation trend prediction model based on improved SVM-GRU is proposed by integrating the excellent performance of gate controlled cyclic units in time series prediction with the powerful ability of variational mode decomposition in nonlinear signal decomposition. The accuracy of prediction is significantly improved.
Through example verification, the proposed method in this paper can accurately capture the changes in the degradation trend of hydropower units, achieve precise prediction of the health status of the units, and provide decision-making basis for the operation and maintenance management of hydropower stations.
Acknowledgment
This work was supported by the Scientific research project of China Three Gorges Group Co., Ltd. (Z532202007) and the IWHR Research & Development Support Program (TJ0145B022021).
References
[1] X. Lu, C. Li and D. Liu, et al. “Comprehensive stability analysis of complex hydropower system under flexible operating conditions based on a fast stability domain solving method[J]”, Energy, 2023, 274: 127368.
[2] S. Sangal, M. Singhal and R. Saini, et al. “Hydro-abrasive erosion modelling in Francis turbine at different silt conditions[J]”. Sustainable Energy Technologies and Assessments, 2022, 53(B): 102616.
[3] W. Liu, Y. Zheng and Z. Ma, et al. “An intelligent fault diagnosis scheme for hydropower units based on the pattern recognition of axis orbits[J]”. Measurement Science and Technology, 2023, 34(2): 5104.
[4] J. Chen, Y. Zheng and X. Deng, et al. “Design of a progressive fault diagnosis system for hydropower units considering unknown faults[J]”, Measurement Science and Technology. 2024, 35(1): 5904.
[5] B. Ran, Y. Peng and Y. Wang. “Bearing degradation prediction based on deep latent variable state space model with differential transformation[J]”. Mechanical Systems and Signal Processing, 2024, 220: 111636.
[6] R. Yu, B. He and M. Ma. “Principal-feature-guided degradation trend prediction algorithm based on gear fault dynamics model[J]”. Engineering Failure Analysis, 2024, 163(PA): 108455.
[7] Z. Zhao, S. Shen and Z. Wang. “Performance degradation trend prediction of proton exchange membrane fuel cell based on GA-TCN[J]”. Measurement Science and Technology, 2024, 35(7): 6007.
[8] Z. Zhou, W. Zhang and P. Yao, et al. “More realistic degradation trend prediction for gas turbine based on factor analysis and multiple penalty mechanism loss function[J]”. Reliability Engineering and System Safety, 2024, 247:110097.
[9] J. Lan, Y. Zhou and Z. Gao, et al. “Prediction model of deterioration trend of hydropower units based on machine learning[J]”. Journal of Hydroelectric Power, 2022, 41(12): 135–144.
[10] B. Bencsik, I. Reményi and M. Szemenyei, et al. “Designing an embedded feature selection algorithm for a drowsiness detector model based on electroencephalogram data[J]”. Sensors, 2023, 23(4): 1874–1874.
[11] I. Omar, M. Khan and A. Starr. “Suitability analysis of machine learning algorithms for crack growth prediction based on dynamic response data[J]”. Sensors, 2023, 23(3): 1074–1074.
[12] S. Raubitzek and T. Neubauer. “An exploratory study on the complexity and machine learning predictability of stock market data[J]”. Entropy, 2022, 24(3): 332–332.
[13] N. Wei, L. Yin and C. Li, et al. “Forecasting the daily natural gas consumption with an accurate white-box model[J]”. Energy, 2021, 232: 121036.
[14] H. Cao, S. Gao and P. Xue. “Aero engine fault diagnosis based on multi-classification AdaBoost[J]”. Journal of Beijing University of Aeronautics and Astronautics, 2018, 44(09): 1818–1825.
[15] R. Nagaraj, D. Murthy and M. Rajput. “Modeling renewables based hybrid power system with desalination plant load using neural networks[J]”. Distributed Generation & Alternative Energy Journal, 2019, 34(1), 32–46.
[16] Y. Semero, J. Zhang, D. Zheng, and D. Wei. “A GA-PSO hybrid algorithm based neural network modeling technique for short-term wind power forecasting[J]”. Distributed Generation & Alternative Energy Journal, 2018, 33(4), 26–43.
[17] M. Manas. “Optimization of distributed generation based hybrid renewable energy system for a DC Micro-Grid using particle swarm optimization[J]”. Distributed Generation & Alternative Energy Journal, 2018, 33(4), 7–25.
[18] Y. Fan, X. Liu and C. Zhang, et al. “Dynamic prediction of boiler NOx emission with graph convolutional gated recurrent unit model optimized by genetic algorithm[J]”. Energy, 2024, 294: 130957.
[19] Q. Zhang, H. Guo and F. Shen, et al. “A predictive method for impedance estimation of triboelectric nanogenerators based on a gated recurrent unit model[J]”. Nano Energy, 2024, 124: 109458.
[20] C. Zhao, Y. Wen and J. Zhu, et al. “Localization of surface dent deformation and inter-laminated damage in CFRP laminates under low-velocity impact behavior based on multi-channel one-dimensional convolutional gated recurrent unit[J]”. Measurement, 2023, 221: 113503.
[21] X. Xu, S. Hu and H. Shao, et al. “A spatio-temporal forecasting model using optimally weighted graph convolutional network and gated recurrent unit for wind speed of different sites distributed in an offshore wind farm[J]”. Energy, 2023, 284: 128565.
[22] Y. Bi, B. Zheng and Y. Zhang, et al. “Prediction of vibration trend of hydropower units based on MIC and BiGRU[J]”. Journal of Hydraulic Engineering, 2021, 52(05): 612–621.
[23] Y. Jiang, W. Wang and L. Zou, et al. “Dynamic prediction model of landslide displacement based on particle swarm variational mode decomposition[J]”, nonlinear autoregressive neural network and gated cycle unit. Rock and Soil Mechanics, 2022, 43(S1): 601–612.
Biographies

Tengbin Liu received the B.S. and M.S. degrees in Material Processing Engineering from Hohai University, Nanjing, China, in 2003 and 2006. He has worked in China Yangtze Power Co., Ltd. since 2006, and has been a senior engineer, since 2015. His research interests include the operation and maintenance technology of hydropower generating units, as well as unit stability testing.

Lihua Li received the B.S. degree in July 1990. He has been engaged in the production operation and technical management of hydropower stations for a long time, and his main interests include the exploration of the operation law of electromechanical equipment of hydropower stations and the research of operation and maintenance technology.

Xiong Gao received the B.S. degree in Energy Power System and Automation from Wuhan University in 2012. He has been engaged in the operation and maintenance of hydropower generating units at China Yangtze Power Co., Ltd., since 2012.

Xuan Zheng received the B.S. and M.S. degrees in Thermal Energy and Power Engineering from Xi’an University of Technology in 2008 and 2013,respectively. He has worked in China Yangtze Power Co., Ltd. since 2013 and has been serving as a senior engineer since 2021. He is mainly engaged in the maintenance and overhaul of hydropower generating units.

Yuguo Zhou received the B.S. degree in Thermal Energy and Power Engineering from Hohai University, Nanjing, China, in 2007 and the M.S. degree in Water Resources and Hydropower Engineering from Wuhan University in 2009. He has worked in China Yangtze Power Co., Ltd. since 2009, and has been a senior engineer, since 2019. His research interests include the operation and maintenance technology of hydropower generating units, as well as unit stability testing.

Dianlong Chen received the B.S. degree in Mechanical Engineering and Automation from Kunming University of Science and Technology in 2012. He has worked in China Yangtze.

Tingwei Wu received the B.S. degree in energy and power engineering from China Agricultural University in 2022. He is mainly engaged in the operation and maintenance technology of hydropower generating units, as well as unit stability testing.

Xueli An received PhD degree from School of Hydropower and Information Engineering, Huazhong University of Science and Technology, Wuhan, China, in 2009. Now he works at China Institute of Water Resources and Hydropower Research. His current research interests include condition monitoring and fault diagnosis.
Distributed Generation & Alternative Energy Journal, Vol. 39_5, 1045–1068.
doi: 10.13052/dgaej2156-3306.3955
© 2024 River Publishers