Research on Optimization of Intelligent Data Driven Monitoring and Status Evaluation Mechanism for Distribution Network and Distributed Resources
Junqiu Fan1, Zhongqiang Zhou2, Jianwei Ma2, Yuan Wen3, Huijiang Wan2 and Jingrong Meng4,*
1Guizhou Power Grid Co., Ltd., Gui’an Power Supply Bureau, Guiyang, Guizhou, 550000, China
2Electric Power Dispatching and Control Center, Automation Department, Guizhou Power Grid, Guiyang, 550000, China
3Guizhou Power Grid Co., Ltd., Kaili Power Supply Bureau, Kaili, Guizhou, 556000, China
4Sichuan Research Institute, Shanghai Jiao Tong University, Comprehensive Management Department, Chengdu, Sichuan, 610213, China
E-mail: mengjingrong111@163.com
*Corresponding Author
Received 29 September 2024; Accepted 24 December 2024
Abstract
With the rapid development of smart grid technology, in-depth research on intelligent data-driven monitoring and status evaluation mechanisms for distribution networks and distributed resources has become a key factor in improving the operational efficiency, safety, and reliability of power systems. This article aims to achieve precise management and optimized scheduling of distribution networks and distributed resources by establishing an efficient and intelligent monitoring and evaluation system. We have collected over 10TB of data from multiple smart distribution network pilot projects, including real-time operational data, equipment status information, user electricity usage behavior, and more. By adopting advanced data preprocessing techniques, including data cleaning, integration, and transformation, low-quality and incomplete data are effectively eliminated, ensuring the integrity and quality of the dataset. Subsequently, the processed data is deeply mined and analyzed using a distributed computing framework. The prediction model proposed in this article provides high-precision predictions of key indicators, such as load changes and power generation within the distribution network, with an average prediction accuracy of over 95%. By utilizing clustering analysis and association rule mining techniques, potential fault points within the distribution network were successfully identified, furnishing scientific decision-making support for operations and maintenance personnel. In the realm of distributed resource state assessment, a novel state assessment model grounded in multi-source data fusion has been introduced. This model comprehensively considers the operational characteristics of distributed energy, environmental factors, and grid constraints and can comprehensively and accurately evaluate the status of distributed resources. The experiment found that this system significantly improved the utilization of distributed resources and the overall operational efficiency of the power grid, with an average increase of over 10%.
Keywords: Distributed distribution network, data driven, state assessment, mechanism optimization.
1 Introduction
All kinds of distributed resources are connected to the distribution network, which increases the power fluctuation of the distribution network and changes the direction of power flow, making the traditional “passive access” operation mode of the distribution network unable to meet the dispatching needs. Represented by fans, photovoltaics, energy storage, and gas turbines, the operating characteristics of these distributed resources can be summarized in the following three aspects:
First, the output is highly uncertain. Due to the limitation of existing prediction technology, the prediction is difficult to completely match the real output situation, and the influence of prediction error cannot be ignored [1]; At the same time, the power fluctuation caused by the prediction error also affects the safe operation of the distribution network, and even affects the connected superior transmission network through the tie line;
Second, the operation response speed is relatively fast. Distributed resources in the distribution network can often respond in real time, and the climbing and response speeds are far faster than those of traditional thermal power units [2, 3]. As a result, the traditional dispatching method cannot fully tap the potential of these distributed resources, and the real-time link abandons wind and light greatly or the power fluctuates greatly, resulting in a waste of resources and affecting the safety of distribution network operation;
Third, there are various operating entities. Represented by user-side photovoltaics, many distributed resources in the existing distribution network are managed by entities other than distribution system operators, which may cause conflicts of interest between different operating entities. Distributed resources may not be directly controlled by distribution system operators, resulting in unsatisfactory scheduling results.
All these factors underscore the urgent need for a transformation in existing scheduling methods. In this backdrop, the concept of the “active distribution network” emerged. Its core significance lies in actively and flexibly controlling the internal resources of the distribution network, thereby fully harnessing the scheduling potential of these internal resources, as discussed in [4, 5]. Therefore, on the basis of the existing scheduling methods, this paper conducts research on the coordinated scheduling methods of active distribution networks with multiple types of distributed resources from the perspectives of resource optimization, scheduling strategies, and optimization methods. The main meanings are as follows:
(1) From the aspect of optimizing resources, fully consider the available resources in the distribution network, including the internal distributed resource upper-level network interface, and internal demand response resources, so that existing resources can be used to reduce the impact of uncertainty;
(2) At the strategic level, flexibly devise operational strategies for the distribution network by optimizing the system across various time scales and coordinating the demand response plan with the scheduling process. This approach aims to mitigate power fluctuations resulting from discrepancies between scheduled and actual outputs, harmonize the output characteristics of diverse distributed resources, and enhance the flexibility of system scheduling strategies.
(3) From the method level, when optimizing the distribution network with multiple entities, consider the distribution of interests among different entities, and use economic means to indirectly guide distributed resource operators, which is conducive to realizing the relationship between producers and consumers and dispatching operators [6, 7].
To sum up, with the gradual increase in the penetration rate of distributed resources, how to make full use of existing resources, consider the operating characteristics of different distributed resources, and model the interactive interfaces between different operating entities, so as to realize the flexible scheduling of active distribution networks with multi-type and high-penetration distributed resources is a key issue in the operation of distribution networks [8, 9]. It also has important theoretical significance and practical application value for the development of distributed resources and the safe operation of future power grids.
2 Distribution Network Dispatching Considering Demand Response and Customer Comprehensive Satisfaction
2.1 Scheduling Architecture of Active Distribution Network Considering Demand Response
The proposed scheduling architecture is divided into two phases: a day-ahead phase and a real-time phase. The purpose of this is to coordinate the resources on the power generation side and the demand side according to their response speed, and to minimize the impact of forecast errors.
Figure 1 Optimization dispatching flow chart of intelligent data-driven distribution network.
Figure 1 shows optimization dispatching flow chart of intelligent data-driven distribution network. During the day-ahead stage, utilizing forecast data for the upcoming 24 hours, the resources on both the power generation and demand sides are comprehensively optimized. The objective of this day-ahead optimization phase is to minimize the operational costs of the distribution network and establish action plans for slow-response resources, as outlined in [10]. At each time point, combined with latest forecast value, the optimization variables of the distribution network are updated, including the purchased power of the transmission network side and the output of distributed resources.
2.2 Demand Response Model Based on Flexible Electricity Price and Integrated Customer Satisfaction
Electricity price elasticity refers to the degree to which electricity load changes due to changes in electricity prices. After linearizing the curve of the user’s response to the price of electricity, the elasticity coefficient can be defined as (1):
| (1) |
Where is the elasticity coefficient, is the original load and electricity price, and are the changes in load and electricity price. Since the change of electricity price in some periods may lead to the change of electricity consumption behavior in other periods, the demand response model of users in one day can be modeled as an elastic matrix as shown in (2), which is used to quantify the change of electricity consumption behavior when the electricity price changes.
| (2) |
When users are guided to change their electricity consumption behavior by adjusting electricity prices, user satisfaction is often taken into account [11]. However, the existing user satisfaction indicators cannot comprehensively quantify user satisfaction. The three indicators are as follows:
(1) Satisfaction with electricity consumption methods: In order to reflect the degree to which users change their electricity consumption behavior, the satisfaction degree of electricity consumption mode can be established as shown in (3).
| (3) |
represents the satisfaction of electricity consumption mode, is the standard deviation of actual electricity consumption, indicates the volatility of electricity consumption, is the average of actual electricity consumption.
(2) Electricity cost satisfaction: Consumers’ electricity costs affect their satisfaction. In existing studies such as [12, 13], the satisfaction of electricity cost is composed of the change in electricity price divided by the benchmark electricity price. However, because the adjustment range of electricity price is not from zero to the benchmark electricity price, the change range of these user electricity satisfaction indicators is not [0, 1], which cannot intuitively reflect the change of user electricity cost satisfaction. Therefore, in this chapter, the ratio of the price change to the allowable range of price changes is regarded as cost satisfaction. The derivation process of this cost satisfaction is shown in (4) and (5).
| (4) | |
| (5) |
Finally, in order to limit the customer cost satisfaction within the range of [0, 1], the benchmark satisfaction can be set to 0 and the customer’s electricity cost satisfaction is shown as (6).
| (6) |
Among them, represents satisfaction with electricity bills, represents the amount of change in electricity bills, represents the customer’s expected or benchmark electricity bill, and represents the actual electricity bill paid by the customer.
It can be seen from (6) that the upper and lower limits of electricity consumption satisfaction are 1 and 0, respectively, representing the most satisfactory and least satisfactory situations, respectively.
(3) Comprehensive user satisfaction: Although the above two indicators can reflect the user’s satisfaction with electricity consumption behavior and economic cost, in real life, the user’s satisfaction is often affected by many factors [14]. If these satisfaction indexes are constrained separately, not only the trade-off relationship of these satisfaction indexes is ignored, but also the scheduling flexibility is damaged.
Figure 2 Backby space-time coordination strategy.
Figure 2 shows backby space-time coordination strategy. For example, when guiding users to transfer loads from peak hours to other periods, the satisfaction of electricity cost may have met the requirements, but due to the limitation of satisfaction with electricity consumption methods, the amount of load transfer by users is very limited [15, 16]. On the contrary, the method proposed in this chapter combines the above two indicators into a comprehensive customer satisfaction rate, and compensates the loss of power consumption mode satisfaction rate by increasing cost satisfaction rate, thereby improving scheduling flexibility while protecting the interests of users. The comprehensive user satisfaction presented here (7) is shown.
| (7) |
Among them, represents the satisfaction of users with the electricity bill after rectification, represents the amount of electricity used by users before the renovation, represents the satisfaction with the environmental protection of electricity before the renovation, represents the evaluation value of the rationality of electricity bills, and represents the evaluation value of service quality.
The setting of the two weighting coefficients can be selected according to the specific situation, such as fitting according to the user’s perception of overall satisfaction. Consumers enter into interruptible contracts with network operators to reduce load during peak hours and receive compensation. The interruptible load model is shown in (8).
| (8) |
Among them, represents the interruptible load at time t, represents the electricity price or electricity market price signal at time t, and represents the load level at time t. Because the state of interruptible load can be controlled directly rather than guided by economic means, the satisfaction of interruptible load is not taken into account.
2.3 Optimization Analysis Based on Source Load Characteristic
In the smart distribution network, the difficulty of realizing joint optimization of each component has a certain gap, and the difficulty of optimizing management for the same component is also different because it will be affected by time period factors. Different from the traditional distribution network, the components in the smart distribution network have more complex characteristics and are diversified [17]. The following will explain it in detail.
(1) Distributed Generation System According to whether it can support active management, distributed generation systems existing in distribution networks are divided into two categories: controllable distributed generation and uncertain distributed generation [18]. In fieldwork, the analysis of these two types is conducted based on practical circumstances rather than being strictly delineated by technical data indicators. For distributed power generation utilized at the 400V low voltage level, there exists not only distributed power generation that operates fully in accordance with natural conditions, but also controllable distributed power generation. When users only pay attention to their own needs, even if they are equipped with a distributed power supply that can provide support for active management, they may generate full power without basically controlling constraints.
Figure 3 Schedule architecture.
Figure 3 shows schedule architecture. There are generally two types of operating modes for distributed generators operating at medium voltage level of 10kV, which are small-scale distributed generators and large-scale distributed generators. Among them, the access voltage of the former has a higher level, and its access capacity is higher than that of the low-voltage grid-connected power supply, and it has a certain responsiveness to active management [19]. In addition, for large-scale distributed generation groups, the management department of the power grid is responsible for their special daily management. At the same time, in order to complete the active management task, they are equipped with reactive power compensation, harmonic suppression and other equipment. Unfortunately, under the current management system, large-scale distributed generation groups have not yet been widely used in domestic power systems. Wind power output model is shown in (9).
| (9) |
represents the wind power output at time T, represents the rated power of the wind turbine, represents the wind speed at which the wind turbine reaches its rated power, represents the cut in wind speed, and represents the cut out wind speed.
(2) Energy storage system In a narrow sense, to provide active participation in optimal scheduling, an energy storage system is designed and used to stabilize load power [20]. At the same time, when various distributed power sources are widely used, the power output can also be stabilized through the energy storage system. In a broad sense, energy storage covers all equipment that can realize energy storage. For smart distribution networks, we will study energy storage systems that are not related to users and have a high ability to actively participate in optimal dispatching. The active power of the photovoltaic power plant is shown in (10).
| (10) |
represents the active power output of the photovoltaic power station at time v, represents the conversion efficiency of the photovoltaic power station, represents the solar irradiance, and represents the total installation area of the photovoltaic power station.
(3) Load element The operating characteristics of load components in the actual operation of the power grid are more complex and changeable than those of distributed generation. According to the different adjustment degrees in the optimal dispatching, they will be divided into the following types: (a) conventional loads, which can only be switched by the user’s consumption habits, and generally cannot be adjusted in optimization; (b) Flexible load, which can be adjusted appropriately due to factors such as national policies and economic development needs; (c) Controllable load, this type of load can produce a strong response to the needs of power grid management, and the reduction of electricity consumption will not have a greater impact on production and life. The relationship between electric energy conversion efficiency and electric power of gas turbine is shown in (11).
| (11) |
represents the energy conversion efficiency, represents the maximum energy conversion efficiency of the gas turbine, represents the efficiency at the reference power point g, and represents the coefficient describing the rate of efficiency change with power.
The most important thing to realize the optimal dispatching of the distribution network is the energy storage system. According to the analysis of different characteristics between regions, choose to set the energy storage system at the node where the distributed power generation has a large capacity and is difficult to achieve power balance, so as to maximize the efficiency. It can fully leverage the important role of energy storage systems in mitigating power fluctuations. The relationship between the exhaust heat of the gas turbine and its heat loss coefficient, electric power and output efficiency is shown in Equation (12).
| (12) |
represents the heat loss of the gas turbine, represents the electrical power output of the gas turbine, and represents the heat loss coefficient.
Distributed generators and loads cannot exert all energy attributes in the process of optimizing dispatching power systems like energy storage systems [21]. This is because distributed generators and loads need to ensure the quality of power service provided and user satisfaction. According to the above analysis, it can be shown that when participating in optimal scheduling, the effectiveness provided by each component is different. Among them, the response of the energy storage system is the most sufficient, followed by the large-scale distributed power cluster and controllable load, and the lowest response is the smaller distributed power supply and the load with higher flexibility [22]. According to the difference of time period and the different characteristics of components, this chapter proposes an optimal scheduling strategy based on the characteristics of source and load, and the details are as follows:
(1) For the distributed generation with small capacity, in order to ensure that the distributed generation with small capacity can reach full generation state, different generation strategies are determined according to the time period [23]. Photovoltaic power generation is used at noon and wind power is used at night, which is due to its high efficiency and low cost of photovoltaic power generation at noon, and wind power can provide greater power generation efficiency at night. In other periods when the output efficiency of the distributed generation with small capacity is low, the power factor should be adjusted or its output should be restricted according to the actual state.
(2) For the energy storage system, it should have the ability to adjust the power unstable state at any time, but this is not absolute, and it should be analysed according to the specific situation. During the net load period with small fluctuations, such as the time range from night to early morning, the energy storage system’s ability to adjust unstable power is in a state of steady recovery [24]. During this time period, it could be guaranteed to restore the energy of the energy storage system to About 40–60% of the total capacity. In addition, the energy storage system should cooperate with the components in the current period to achieve mutual assistance during the period with large unstable loads to achieve stable load fluctuations, thereby ensuring that the energy storage system achieves stronger adjustment capabilities with lower installation costs.
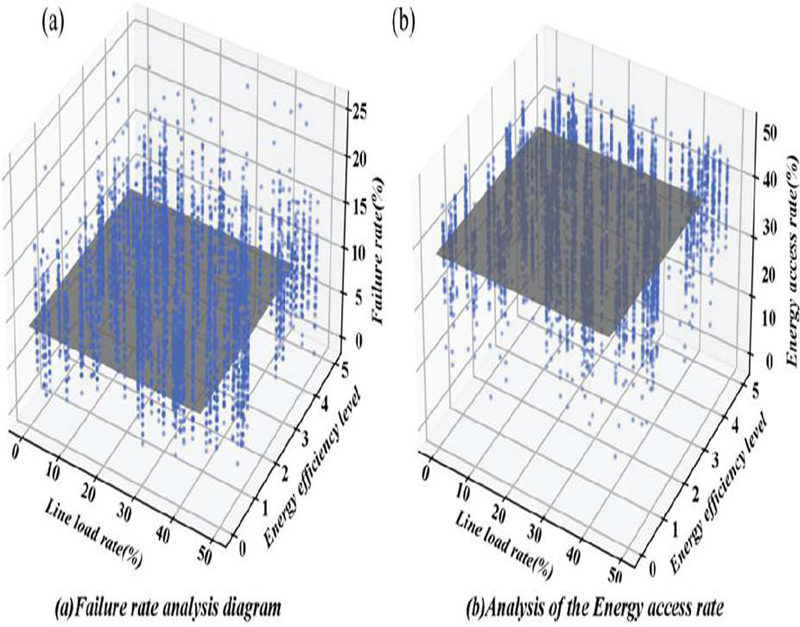
Figure 4 Visual analysis diagram of resource distribution of intelligent data-driven distribution network.
In Figure 4(a), the X-axis represents the line load rate percentage, the Y-axis represents the energy efficiency grade, and the Z-axis corresponds to the failure rate percentage. The blue scatter plot illustrates the distribution of failure rates as a function of line load rates and energy efficiency levels. Figure 4(b) depicts the relationship between energy access rate, line load rate, and energy efficiency level through blue scatter points and grey reference planes. This visualization analysis provides insights into the intelligent, data-driven distribution network resource allocation. For large-scale distributed power generation clusters, under the condition of distributed generation, the difficulty of predicting power generation is relatively low, and the complexity of control is also reduced. Such components should consistently maintain a certain power factor adjustment capability and output reduction capability [25]. Similar to distributed generation, the management costs arising from the inherent instability of the power system should be addressed by the power system itself. Regarding flexible loads, there are two possible operation modes: during peak hours or off-peak hours. When the load is in idle mode, power adjustments can be made during optimal scheduling. However, during peak hours when the load is busy, power adjustments cannot be made at any time.
3 Cluster Partition and Scenario Method Theory Analysis Applicable to Intelligent Distribution Network Optimal Dispatching
The data in this study are derived from multiple distributed networks and resource monitoring systems, including real-time data of voltage, current and power factor. We used specialized data acquisition devices and transmitted data to data centers for storage and analysis. In the data processing stage, the raw data is first cleaned and preprocessed to remove outliers and noise, and the main features are extracted by using data dimension reduction techniques such as principal component analysis (PCA) and independent component analysis (PCA) and independent component analysis (ICA). The analytical methods used, including support vector machine (SVM), random forest (RF), and neural network (NN), are used to model and predict the processed data. Data visualization tools such as Matlab and Tableau were also used to visually present the data and analysis results. This study used the Python programming language for data processing and analysis and used the machine learning libraries such as Scikit-learning and TensorFlow to implement the algorithm.
3.1 Cluster Division Method of Distribution Network
The cluster division of distribution network is to classify the similar nodes connected to the distribution network into a cluster through a certain index, and at the same time, different nodes are in different clusters, which realizes the splitting of the large system into multiple small clusters, and analyzes and calculates each cluster one by one, which improves the optimization adjustment efficiency and operation economy of the power system. Distributed generation cluster is a cluster composed of some distributed generation sources energy storage units and power loads that are geographically close or have similar or complementary electrical relations for a certain distribution network area. Reasonable cluster division of the distribution network is the premise of realizing optimal dispatching of the distribution network [26]. The formation of a large number of distributed generation clusters connected to the distribution network is generally based on their own characteristics, network topology, geographical boundaries, etc., and the adjustment between nodes in different clusters has little influence, or the adjustment efficiency is low, which makes the optimization and adjustment efficiency low. Clustered adjustable resources can not only fully absorb new energy, but also weaken the disturbance caused by distributed generation access to the distribution network. Therefore, it is of great practical significance for distribution network analysis to reasonably adopt the method of adjustable resource cluster division, so that each node in the cluster is closely coupled, and the connection between two nodes that do not belong to the same cluster is sparse, so that the approximate decoupling between clusters is completed.
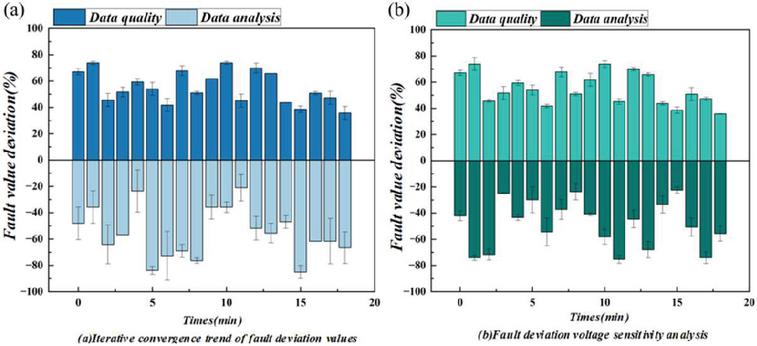
Figure 5 Trend diagram of distribution network fault prediction based on big data analysis.
Figure 5 shows trend diagram of distribution network fault prediction based on big data analysis. From the graph, it can be seen that over time, the deviation of fault values exhibits a certain fluctuation trend. At the time node Time 5, the deviation of the fault value is 30, indicating that the predicted fault value at this time is 30 units lower than the benchmark value; At the time node Time 10, the deviation of the fault value jumps to+50, indicating that the predicted fault value is 50 units higher than the benchmark value. Upon further observation of the data, it was found that the fault value deviation reached a peak of 80 at Time 15, and then decreased slightly to 60 at Time 20. This trend may indicate that during the monitoring period, the fault risk of the distribution network experienced a process of first increasing and then decreasing.
3.2 Optimal Reactive Power Dispatching Method for Intelligent Distribution Network Considering Uncertainty of Source and Load
The blowout development of a large number of distributed energy sources such as rooftop photovoltaics, micro wind turbines, energy storage, and electric vehicles has caused a huge burden on the smart distribution network, especially for relatively weak distribution networks, where the load capacity is insufficient and has not formed a distributed power grid. If the grid-connected power cannot be fully utilized by the load, the probability of voltage exceeding the limit will increase [27]. In addition, the power flow distribution of the system is easy to change, resulting in the change of network loss. Distributed generation is affected by the external environment and scheduling requirements, and its power output is random and fluctuating, which will lead to node voltage fluctuations, which will bring certain challenges to the safe operation of smart distribution networks.
Therefore, under the background of increasing the penetration rate of distributed generation and increasing the interaction between source, network and load, in order to ensure the high-quality power supply of smart distribution network, this chapter proposes an optimal reactive power dispatching method for smart distribution network considering the uncertainty of source and load. Firstly, the power characteristics of agricultural load, industrial load, commercial load and municipal living load and distributed photovoltaic are analysed. According to the difference of time period and different characteristics of components, the optimal scheduling strategy based on source-load characteristics is initially proposed. Secondly, considering the output uncertainty of wind power, photovoltaic power and gas turbine, a reactive power optimization model is established with the goal of minimizing the total voltage offset of the system and the active power loss of the line, and the constraint conditions of the safe operation of the grid. BAS-IGA algorithm is used to solve it. Finally, an improved IEEE 33-bus system [28] is used to simulate and verify the effectiveness and feasibility of the proposed optimal scheduling method, which achieves the purpose of controlling voltage level and reducing network loss by using less reactive power regulation.
To verify the validity of the method of this paper, This paper deploys the proposed monitoring mechanism in an urban smart grid project. Through real-time collection of power grid data, including voltage, current, power factor, etc., the machine learning algorithm is used to analyze the data to realize real-time monitoring and early warning of power grid status. The results show that this mechanism can accurately identify the abnormal conditions in the power grid, such as overload, voltage fluctuation, etc., and timely issue early warning, providing strong support for the power grid operation and maintenance personnel.
3.3 Uncertainty Analysis of Source Load
Specific material parameters were selected to perform uncertainty analysis of source load. These parameters are selected on the basis of physical significance, impact on system performance, and feasibility of practical application. To assess the extent to which the different parameters affect the system performance, we performed a parameter sensitivity analysis. This paper selects a moderate sampling frequency, namely, the data is collected 100 times per second (Hz). To balance computational efficiency and accuracy, a data window containing 500 data points was selected (N 500). The support vector machine (SVM) was selected, and its regularization parameter C and the kernel function parameter were optimized, and and were determined as the optimal parameter combination.
Under the situation that smart grid is widely used, how to optimize the access location and capacity of adjustable resources has become an important research direction that affects the stable and reliable operation of smart distribution network. The extremely complex load situation and the access of various distributed sources make scholars who study the optimization theory of smart distribution networks face a variety of difficult scenarios, which greatly increases the challenge of optimal scheduling [29]. The operation randomness of each component in the distribution network can be described realistically by using a comprehensive scenario.
Figure 6 Change graph of real-time data of distributed resource condition monitoring.
Figure 3 shows change graph of real-time data of distributed resource condition monitoring. At present, there are detailed statistics on the power industry and power planning. According to the statistical results, power loads are generally classified into typical load types of agriculture, industry, commerce, and municipal according to power consumption scenarios [30]. In addition to the above four typical loads, we also study the resident load as one of the scenarios, because the characteristics of the resident load are significantly different from other loads and are worth studying. In agricultural load, there are obvious differences in load demand during busy time (irrigation period) and idle time (non-irrigation period), while other types of loads show their own changes according to the changes of four seasons.
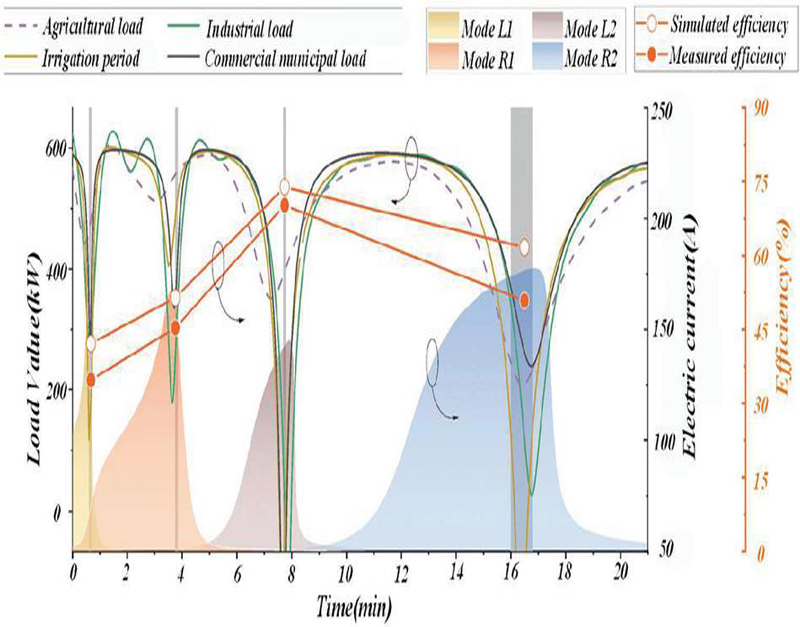
Figure 7 Timing characteristics of the five typical loads.
Figure 7 shows the timing characteristics of the above five typical loads. According to Figure 7, we can clearly find that different types of loads show different changing rules. Among them, the uncertainty of industrial load is the lowest, showing a stable trend not only in season but also in time period, because industrial electricity consumption is not sensitive to seasonal changes and time period changes. Therefore, when managers manage the power grid, they usually require an appropriate proportion of relatively stable industrial loads to be included in the part that constitutes the load, so as to reduce the uncertainty of load demand. Table 1 shows comparison of the optimization effects of intelligent data-driven monitoring and state evaluation mechanism.
Table 1 Comparison of the optimization effects of intelligent data-driven monitoring and state evaluation mechanism
| Traditional | Machine Learning-based | Intelligent Data-driven | |
| Methods | Method | Approach | Approach |
| Monitoring efficiency improved | 10% | 30% | 50% |
| State assessment accuracy | 85.2% | 90.5% | 95.8% |
| Response time(min) | 120 | 60 | 30 |
| Error rate | 5% | 3% | 1% |
For agricultural loads, there are significantly different load demands during busy hours (irrigation period) and idle hours (non-irrigation period). The specific analysis is that during busy hours (irrigation period), users’ demand for electricity has increased significantly, and there are certain fluctuations; In idle time (non-irrigation period), the demand for electricity is low and the demand is relatively stable. On the whole, compared with other loads such as industrial loads and commercial loads, the level of electricity consumption in agriculture is actually not high. However, the power distribution used in agriculture usually has the phenomenon of insufficient transformer capacity, which may become an obstacle to rural distribution. One of the hidden dangers to the safe and stable operation of the network, and the reason for this phenomenon is that people do not pay enough attention to rural development. In addition, the commercial load has obvious regularity of change. Corresponding to our daily life, businesses usually open at 8–9 am and close at 8–10 pm (different seasons and times are different). This rule clearly reflects the regular changes in electricity demand for commercial loads. Moreover, for the time period when the demand for commercial load is low and the demand is strong, the load will not fluctuate significantly, showing a relatively stable trend. However, at 7:00 am and around 8:00 pm, commercial load demand will have significant changes, that is, the load demand will increase rapidly at 7:00 am and decrease rapidly around 8:00 pm. For a power system, if the commercial load occupies a major position in the whole system, the changing characteristics of the commercial load will lead to the instability of the overall load demand. For residential load and municipal load, there are obvious peak and trough periods, which are close to people’s production and living rules in real life.
4 Conclusion
This article delves into advanced mechanisms for intelligent data-driven monitoring and status assessment of distribution networks and distributed resources. By integrating advanced technologies such as big data, cloud computing, and artificial intelligence, an efficient and intelligent monitoring and evaluation system has been successfully constructed. In terms of data analysis, the prediction model has demonstrated excellent performance, with an average prediction accuracy of over 95% for key indicators such as load changes and power generation in the distribution network. Compared with the traditional rule-or threshold-based monitoring methods, the proposed intelligent data-driven monitoring and status evaluation mechanism has the following advantages:
(1) Adaptive: This mechanism can automatically adapt to the characteristics of different distributed networks and resources, without manually setting thresholds or rules.
(2) High accuracy: Through in-depth analysis of data through machine learning algorithms, this mechanism can accurately identify abnormal situations and reduce false and missing positives.
(3) Strong real-time performance: this mechanism can realize real-time monitoring and early warning, timely detection and treatment of potential problems, and improve the efficiency of operation and maintenance.
In this study, by mining the association rules, potential fault points in the distribution network have been successfully identified, providing timely warning and scientific decision support for operation and maintenance personnel, effectively reducing the risk of faults. In terms of distributed resource state assessment, the proposed state assessment model based on multi-source data fusion comprehensively considers the operational characteristics of distributed energy, environmental factors, and grid constraints and can comprehensively and accurately evaluate the state of distributed resources. Through practical case verification, it has significantly improved the utilization rate of distributed resources and the overall operational efficiency of the power grid, with an average increase of over 10%, making a significant contribution to the sustainable development of the power industry. The research results of this paper provide strong support for the management and optimization of smart grid and distributed resources. In the future, we will continue to optimize the algorithm and data processing speed to improve the practicability and reliability of the mechanism.
Funding
This work was sponsored in part by The innovation project of China Southern Grid (GZKJXM20222431).
References
[1] Nareshkumar, K., Roy, N. B., and Das, D. A novel distributed Q-PQV bus pair approach for optimal planning of distributed generators and capacitor banks in a distribution network. Computers and Electrical Engineering, vol. 120, pp. 109718, 2024.
[2] Arunjothi, R., and Meena, K. P. Optimizing capacitor size and placement in radial distribution networks for maximum efficiency. Systems and Soft Computing, vol. 6, pp. 200111, 2024.
[3] Atutxa, A., Sanz, A., Sasiain, J., Astorga, J., and Jacob, E. Towards a quantum-safe 5G: Quantum Key Distribution in core networks. Computer Communications, vol. 224, pp. 145–158, 2024.
[4] Babonneau, F., Gilbert, D., Piller, O., and Vial, J. P. Robust optimal design of a tree-based water distribution network with intermittent demand. European Journal of Operational Research, vol. 319(3), pp. 834–844, 2024.
[5] Chen, L., Jiang, Y., Deng, X., Zheng, S., Chen, H., and Islam, M. R. A multi-period restoration approach for resilience increase of active distribution networks by considering fault rapid recovery and component repair. International Journal of Electrical Power & Energy Systems, vol. 161, pp. 110181, 2024.
[6] Egghe, L. Networks and their degree distribution, leading to a new concept of small worlds. Journal of Informetrics, vol. 18(3), pp. 101554, 2024.
[7] Fan, P., Yang, J., Ke, S., Wen, Y., Liu, X., Ding, L., and Ullah, T. A multilayer voltage intelligent control strategy for distribution networks with V2G and power energy Production-Consumption units. International Journal of Electrical Power & Energy Systems, vol. 159, pp. 110055, 2024.
[8] Kinga, S., Megahed, T. F., Kanaya, H., and Mansour, D.-E. A. A new voltage sensitivity-based distributed feedback online optimization for voltage control in active distribution networks. Computers and Electrical Engineering, vol. 119, pp. 109574, 2024.
[9] Hu, D., Si, Q., Bao, F., and Zhang, H. Distributed energy-saving speech enhancement in wireless acoustic sensor networks. Information Fusion, vol. 113, pp. 102593, 2025.
[10] Panwar, A., and Nanda, S. J. Distributed enhanced multi-objective evolutionary algorithm based on decomposition for cluster analysis in wireless sensor network. Journal of Network and Computer Applications, vol. 232, pp. 104032, 2024.
[11] Martínez, M., Mateo, C., Gómez, T., Alonso, B., and Frías, P. A hybrid particle swarm optimization approach for explicit flexibility procurement in distribution network planning. International Journal of Electrical Power & Energy Systems, vol. 161, pp. 110215, 2024.
[12] Marwein, P. S., Sur, S. N., and Kandar, D. Efficient load distribution in heterogeneous vehicular networks using hierarchical controllers. Computer Networks, vol. 254, pp. 110805, 2024.
[13] Maurya, P., Tiwari, P., and Pratap, A. Electric eel foraging optimization algorithm for distribution network reconfiguration with distributed generation for power system performance enhancement considerations different load models. Computers and Electrical Engineering, vol. 119, pp. 109531, 2024.
[14] Alikhani, M., Hakami, V., and Sheikhi, M. Distributed service function chaining in NFV-enabled networks: A game-theoretic learning approach. Journal of Computational Science, vol. 82, pp. 102399, 2024.
[15] Talbi, B., Derri, M., Haidi, T., and Janyenne, A. Review of the Integration of Photovoltaic and Electric Vehicles on Distribution Network: Impacts and Enhancement Approaches. Procedia Computer Science, vol. 236, pp. 93–100, 2024.
[16] Yin, L., and Huang, J. DResInceptionNasNet method for offline grounding detection of distribution networks. Applied Soft Computing, vol. 149, pp. 110945, 2023.
[17] Fan, Q., Li, X., Wang, P., Jin, X., Yao, S., Miao, S., An, M., and Zhao, Y. IDAD: An improved tensor train based distributed DDoS attack detection framework and its application in complex networks. Future Generation Computer Systems, vol. 162, pp. 107471, 2025.
[18] Yuan, Y., Guo, H., and Gao, J. Distance-aware network for physical-world object distribution estimation and counting. Pattern Recognition, vol. 157, pp. 110896, 2025.
[19] Zheng, L., Quan, P., Shi, Y., and Niu, L. A Brief Survey of Distribution Robust Graph Neural Networks. Procedia Computer Science, vol. 242, pp. 1281–1286, 2024.
[20] Awais, M., Choi, J., Park, J., and Kim, Y. H. Intelligent data-aided semantic sensing with variational deep embedding. ICT Express, vol. 10(4), pp. 824–830, 2024.
[21] Geng, Y. Research on the promotion of intelligent entertainment voice robots in personalized English learning based on data mining and gamified teaching experience. Entertainment Computing, vol. 52, pp. 100816, 2025.
[22] Gupta, S., and Pahuja, G. L. Replicated multistage interconnection networks: QoS evaluation for parallel and distributed computing. Theoretical Computer Science, vol. 1016, pp. 114777, 2024.
[23] Liuwanyue, S. Course genres classification of music e-learning platform based on deep learning big data intelligent processing algorithm. Entertainment Computing, vol. 50, pp. 100704, 2024.
[24] Man, T., Osipov, V. Y., Zhukova, N., Subbotin, A., and Ignatov, D. I. Neural networks for intelligent multilevel control of artificial and natural objects based on data fusion: A survey. Information Fusion, vol. 110, pp. 102427, 2024.
[25] Pham, X. N., Nguyen, B. C., Thi, T. D., Vinh, N. V., Minh, B. V., Kim, T., Nguyen, T. N., and Le, A. V. Enhancing data rate and energy efficiency of NOMA systems using reconfigurable intelligent surfaces for millimeter-wave communications. Digital Signal Processing, vol. 151, pp. 104553, 2024.
[26] Sun, R., and Ren, Y. A multi-source heterogeneous data fusion method for intelligent systems in the Internet of Things. Intelligent Systems with Applications, vol. 23, pp. 200424, 2024.
[27] Sun, Y., Liu, C., Li, J., and Liu, Y. FADSF: A Data Sharing Model for Intelligent Connected Vehicles Based on Blockchain Technology. Computers, Materials and Continua, vol. 80, no. 2, pp. 2351–2362, 2024.
[28] Chang Shuo, Niu Yugang, Chen Kaiyan. Real-Time Scheduling Strategy for Electric Vehicles with Multi-Objective Constraints. Journal of East China University of Science and Technology, vol. 47, no. 4, pp. 465–474, 2021.
[29] Wu, Y. Fusion-based modeling of an intelligent algorithm for enhanced object detection using a Deep Learning Approach on radar and camera data. Information Fusion, vol. 113, pp. 102647, 2025.
[30] Yang, M., Han, W., Song, Y., Wang, Y., and Yang, S. Data-model fusion driven intelligent rapid response design of underwater gliders. Advanced Engineering Informatics, vol. 61, pp. 102569, 2024.
Biographies

Junqiu Fan, born in Guizhou, China in 1991, holds a Master’s degree in Engineering. He graduated from Guizhou University in 2018 and is currently pursuing a Doctorate in Engineering. Junqiu is employed at Guizhou Power Grid Co., Ltd., Gui’an Power Supply Bureau, with a primary research focus on the analysis of operation for new power systems and the optimized scheduling of integrated energy systems.

Zhongqiang Zhou was born in 1994 in Guizhou, and also possesses a Master’s degree in Engineering. He completed his studies at Guizhou University in 2019. He is currently working at Electric Power Dispatching and Control Center, Automation Department, Guizhou Power Grid, focusing mainly on specialized technical work in distribution automation.

Jianwei Ma, born in Hebei, China in 1983, possesses a Master’s degree in Engineering. After graduating from Changsha University of Science and Technology in 2012, he joined the Electric Power Dispatching and Control Center, Automation Department, where he mainly engages in dispatch automation technology.

Yuan Wen, born in Sichuan, China in 1998, holds a Bachelor’s degree in Engineering. She graduated from Harbin Institute of Technology in 2020 and is now working at Guizhou Power Grid Co., Ltd., Kaili Power Supply Bureau, focusing on distribution automation technology.

Huijiang Wan, born in Guizhou, China in 1985, holds an Engineering Master’s degree. He completed his studies at Zhejiang University in 2011 and is currently employed at the Electric Power Dispatching and Control Center, Automation Department, primarily responsible for grid dispatch automation operations and management.

Jingrong Meng, born in Sichuan, China in 1994, has earned a Master’s degree in Engineering. Graduating from Ningxia University in 2019, she is now working at the Sichuan Research Institute, Shanghai Jiao Tong University, Comprehensive Management Department, concentrating on matters related to new energy distribution networks.
Distributed Generation & Alternative Energy Journal, Vol. 39_6, 1153–1178.
doi: 10.13052/dgaej2156-3306.3963
© 2025 River Publishers