Research on Optimization of Distribution Network Connection Mode Based on Graph Neural Network and Genetic Algorithm
Guo Chen1, Wang Hui1, Yan Huan1, Li Bingchen1 and Zhou Xingxing2,*
1State Grid Shaanxi Electric Power Company Limited Research Institute, Shaanxi, 710065, China
2WLSL Electric Energy Star, Inc Electric Energy Star Co. Ltd, Chongqing, 400039, China
E-mail: 15696198698@163.com
*Corresponding Author
Received 17 October 2024; Accepted 26 December 2024
Abstract
With the deep integration of electric power and information technology systems, the distribution system shows the trend of increasingly complex structures and increasing external risk factors. This leads to more diversified types of faults in the distribution network, so it is crucial to optimize its topology. In this paper, we first compare the main connection modes of high-voltage and medium-voltage distribution networks in China, and combine them with the specific needs of Shaanxi Power Grid to propose a differentiated flexible network model and its scope of application. Using Graph Neural Network and Genetic Algorithm, an innovative optimization method of distribution network connection is proposed to support the typical network structure of the new distribution network. Analysis of examples shows that the proposed algorithm can improve the original network’s network loss and voltage deviation by 32.8% and 37.3%, respectively, and the improvement effect is better than that of the traditional genetic algorithm. At the same time, considering the different stages of distribution network development and the uncertainties that may be faced, this paper also explores the flexible transition scheme of each typical network structure to ensure a smooth transition to a more efficient, green and intelligent distribution network model without affecting the reliability of the existing power supply.
Keywords: Distribution network, connection mode, graph neural network, genetic algorithm, model parameter optimization.
1 Introduction
As the final link of the power system, the distribution network is directly impacting the consumers, which is the key bridge to realize and guarantee the power supply capacity and power supply quality of the whole system [1]. With the rapid growth of the national economy, the expectations of consumers for the reliability of power supply from distribution networks are increasing. At the same time, the growing maturity of the power market and the improvement of the tariff system further put forward more stringent requirements for power supply reliability. Therefore, in the process of planning and construction of the distribution network, it is necessary to put the improvement of economic efficiency and reliability of the power supply of the distribution network in a crucial position, to meet the needs of social and economic development and the growing demand of consumers.
When planning a medium-voltage distribution network, a suitable connection mode should be selected based on the load characteristics, economy, and reliability requirements of the power supply area to ensure that the distribution network can adequately meet the power supply demand under normal conditions [2]. The rapid evolution of information technology and the ongoing advancement of smart grid infrastructure have propelled the deep integration of power systems with cyber-physical systems (CPS) into a pivotal trend in the current development of the power industry. This trend not only elevates the level of intelligence, informatization, and automation within power systems but also presents new opportunities for efficient energy utilization, environmental protection, and sustainable development. Japan has implemented a three-phase, three-wire neutral ungrounded system at the 6.6 kV voltage level, significantly enhancing its formidable reputation for reliable power supply [3]. For China, especially in regions with high load density and a developed economy, it can actively learn from Japan’s small-capacity, dense-point, short-distance distribution model to optimize the power supply network. In the areas where the development of the medium-voltage distribution network is lagging, priority should be given to the construction of the medium-voltage distribution ring-networked structure, through adopting the flexible layout of multi-section and multi-contact, reducing the scope of fault outage, facilitating the maintenance of equipment segmentation outage. At the same time, it is necessary to enhance the flexible load scheduling and transfer capabilities to improve the reliability of the power supply system [4]. Given the various forms of medium-voltage distribution network structure, and the various connection modes have their own characteristics and applicable scenarios, it is indispensable to carefully weigh the balance between economy and reliability, to ensure that the distribution network can meet the current development needs, but also has the potential for future expansion. Therefore, many researchers have carried out studies on the selection of connection modes [5–8] and evaluation indexes [9–11], and Wu et al. [12] used fuzzy hierarchical analysis (FAHP) and gray relational analysis (GRA) to solve the problem of selecting connection modes of medium-voltage distribution networks and established a comprehensive evaluation index system in terms of technology, economy, and adaptability. Therefore, it is necessary to study the connection methods in distribution networks, assess the reasonableness of the connection methods, and transform and optimize the unreasonable places of the connection methods to improve the power supply capacity of the distribution networks and reduce the operating costs of the distribution networks.
The Graph Neural Network (GNN) method extends neural networks into the graph domain [13], realizes the combination of deep learning and graph data, and provides a new research space for optimizing the connection method of distribution networks. Firstly, the knowledge model of the distribution network is constructed using the knowledge graph method, including the relationship between distribution network topology, connection mode node voltage, and other variables, and the graph structure information is used to analyze and reason about the distribution network data, to improve the accuracy and robustness of the model [14]. Then the optimization model of the distribution network is built using the GNN method, which can fully explore the data information and improve its robustness under missing data and noise, and also capture the changes in the network topology [15–19] and improve the generalization under network reconfiguration, which is of great significance for the combination of the grid topology and data information.
The structural configuration optimization of distribution networks refers to the conditions of satisfying the current constraints, node voltage constraints, branch power constraints, etc. In addition to traditional classical optimization algorithms, such as topology optimization [20], more widely used at this stage are heuristic algorithms, including ant colony algorithms, simulated annealing algorithms, genetic algorithms, and artificial intelligence algorithms [21] or the fusion of the above algorithms [22], among which the genetic algorithms are the most widely used. Sun et al. [23] analyzed the distributed power generation and distribution network system and put forward the dynamic based on the improvement of the genetic algorithm optimization method. They used constraints and an objective function to establish a mathematical model of the distribution network, where the objective function contains network losses, DGs investment, and power supply reliability. Jo and his team [24] innovatively combined the k-nearest neighbor (kNN) algorithm with a genetic algorithm to achieve significant results in the field of distribution network reconfiguration optimization. This novel fusion strategy enhances the search capability of the genetic algorithm through the kNN structure, and successively shows excellent performance improvement, which strongly validates the effectiveness of the combination of the two in solving complex optimization problems. On the other hand, another researcher [25] designed a genetic algorithm to intelligently adjust the population size for the optimization task of distribution network reconfiguration. The algorithm can dynamically expand or reduce the population size according to the real-time state of the genetic algorithm search process, thus realizing the double optimization of search efficiency and quality. The experimental data show that compared with the traditional genetic algorithm, this improved method of adaptive adjustment can explore the solution space more efficiently and find higher-quality solutions.
This paper utilizes the GNN method and genetic algorithm to perform multi-objective optimization of distribution network structure based on existing research, exploring multiple wiring combinations to reduce the fault occurrence rate and power supply loss, and to improve the economy, reliability, and green and low-carbon nature of the distribution network. Combined with the specific needs of the Shaanxi power grid, we propose a differentiated flexible network model and its scope of application, and study the adaptive ability of the model under network reconfiguration, and the migration ability of the model and the transition scheme under multi-distribution network from.
The rest of the paper is organised as follows: Initially, it analyzes distribution network connection modes, comparing high-voltage and medium-voltage types based on security, reliability, economy, and application scenarios. Following this, it discusses principles for evaluating and optimizing these modes across various dimensions. An optimization model using graph neural networks and genetic algorithms is then proposed for multi-objective enhancement of the network structure. Experiments validate the method’s effectiveness, showing significant reductions in network losses and voltage deviations.
2 Analysis of Distribution Network Connection Mode
At the present stage, China’s urban distribution network system can be subdivided into two major distribution network systems, namely, high-voltage and medium-voltage, according to the different voltage levels. Specifically, the high-voltage distribution system is centered on the 110kV voltage level, and its main function is to provide power transmission to medium-voltage distribution networks and large-scale power users. The medium-voltage distribution network generally adopts a 10kV voltage level, directly impacting the consumers for power supply. This division aims to optimize the transmission and distribution of electricity.
2.1 High-voltage Distribution Network Connection Mode
According to Technical Guidelines for Distribution Network Planning issued by State Grid Corporation of China, the power supply areas are carefully divided into six categories, namely A+, A, B, C, D and E, each of which is defined according to its specific load density and regional characteristics. In this paper, we choose to analyze the power supply areas of categories A+ and A. The power supply areas of category A+, as the core areas with extremely dense loads, mainly include the city centers, which have extremely high requirements for power supply quality. Class A power supply areas, on the other hand, cover municipalities and provincial capitals with similarly high load densities, where stability and reliability of power supply are also of paramount importance.
Further refined to the high-voltage distribution grid connection mode for A+ and A class power supply areas, which often adopt scientific and advanced grid structure design to ensure efficient and safe power supply. There are three typical high-voltage distribution grid connection modes: 3T type, double-chain and triple-chain, which are illustrated below:
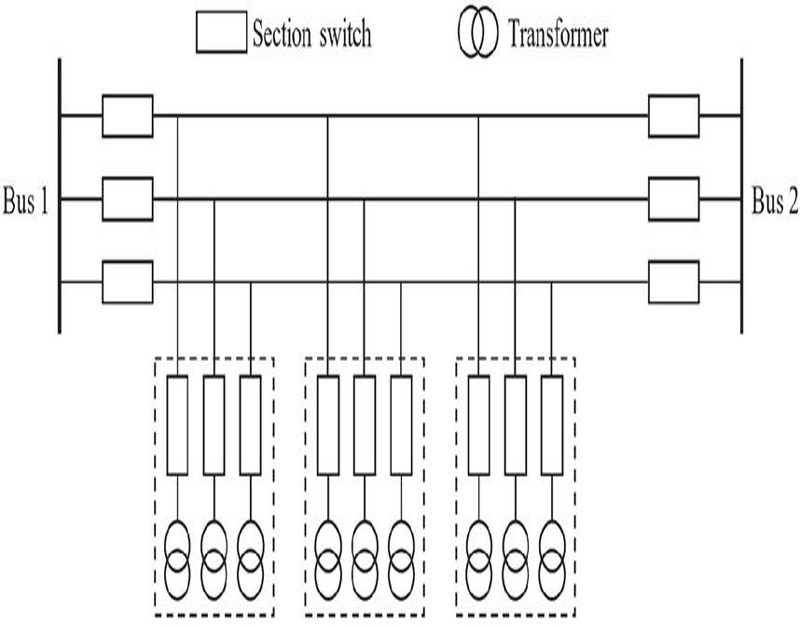
Figure 1 3T type connection mode.
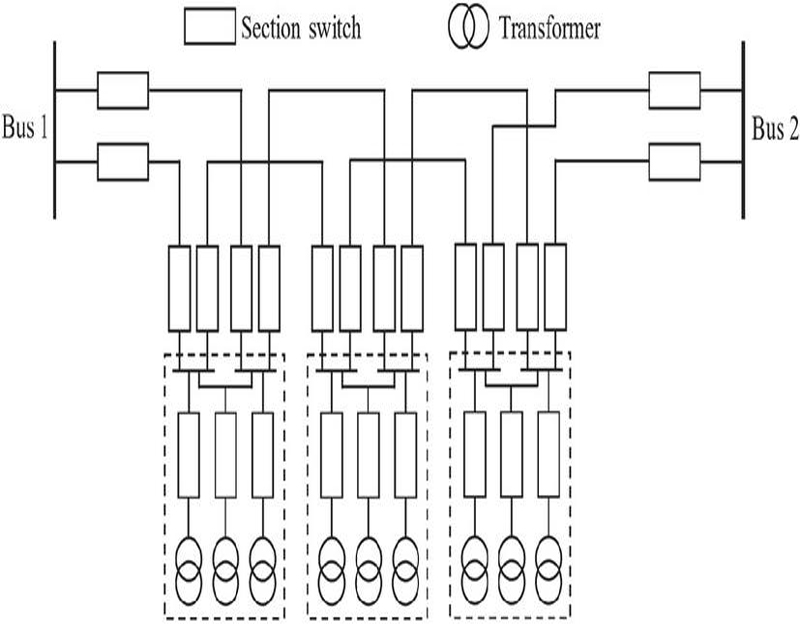
Figure 2 Double-chain connection mode.
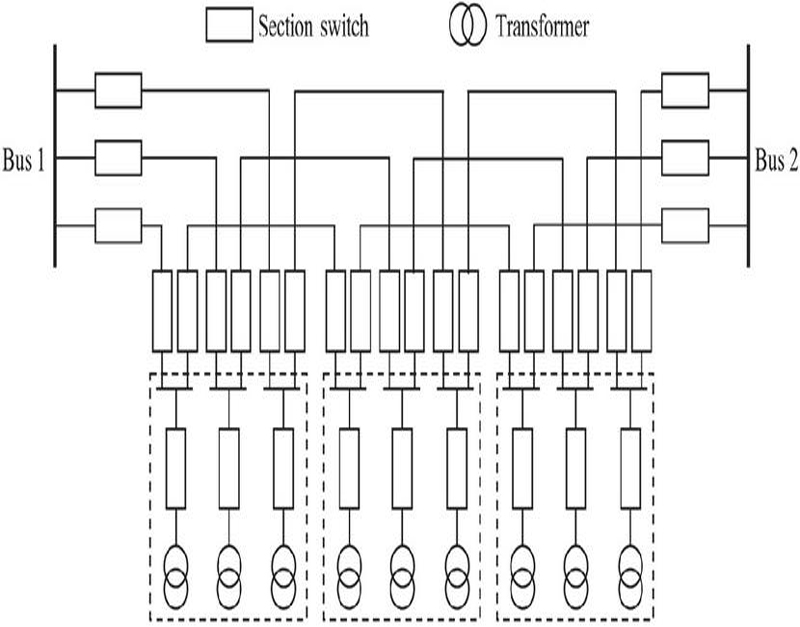
Figure 3 Triple-chain connection mode.
The comparison of the three connection modes is shown in Table 1, which shows that the safety and reliability performance of double-chain and triple-chain connection modes satisfies both N-1 and N-2, and is superior to that of 3T type. When selecting the connection mode, it is necessary to comprehensively consider the specific local load density and the actual situation of the power supply path, to ensure that the selected program matches the applicable occasions.
Table 1 Comparison of three typical high-voltage distribution network connection modes
| Safety and Reliability | |||
| Connection Mode | N-1 | N-2 | Application Scenarios |
| 3T type | Meet | Not meet | Applicable to two substations need a strong connection between two substations and high load density areas or areas with high-reliability requirements and tight power supply corridors. |
| Double-chain | Meet | Meet | Applicable to two substations that require a strong connection between two substations and frequent changes in the mode of operation areas. |
| Triple-chain | Meet | Meet | Suitable for urban areas with high load density and areas with high load density and tight land use in urban areas. |
2.2 Medium-voltage Distribution Network Connection Mode
Typical connection modes of medium-voltage distribution networks are mainly categorized into radial, ring, and section contact connection modes.
Radial connection mode (Figure 4) is one of the most basic and direct wiring strategies in the field of medium-voltage distribution networks, which is especially suitable for those areas with low load density and relatively dispersed geographical location of users, effectively simplifying the complexity of the distribution network. Radial connection mode is known for its simple structure, which not only reduces the construction cost, but also simplifies the operation and management process, and improves the efficiency of equipment use. However, the limitations of this model should not be ignored: once the power supply suffers a failure, it will directly lead to the loss of power supply capacity of the entire line, thus sacrificing the reliability of the power supply.
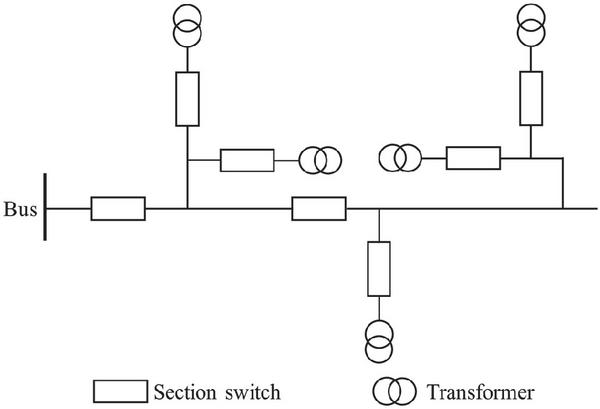
Figure 4 Radial connection mode.
Ring connection mode (Figure 5) provides the flexibility to distribute power to two separate busbars of a single main transformer, or directly across two separate main transformers. This configuration is particularly common in urban core areas where high reliability is sought and is often operated in open-loop mode to optimize grid efficiency and stability. Compared to the traditional radial grid layout, toroidal wiring exhibits higher operational flexibility and reliability. The advantage is that by constructing a closed-loop structure and reserving spare line capacity, the system can respond quickly and redistribute power loads without interrupting service, effectively reducing the risk of outages due to line failures.
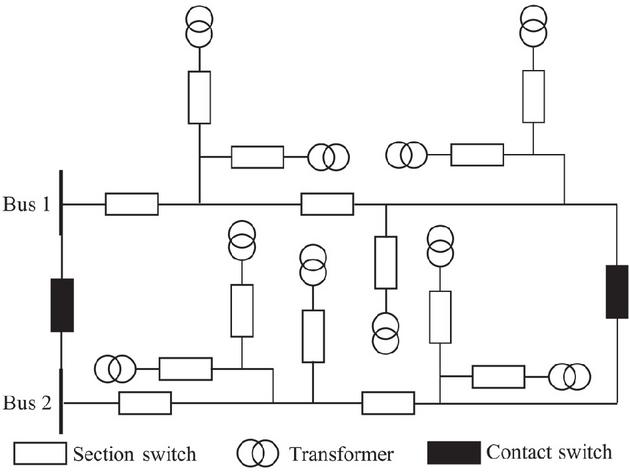
Figure 5 Ring connection mode.
While this design enhances the redundancy and resilience of the system, it also correspondingly increases the initial construction investment cost. To ensure that the supply load can be smoothly transferred during an emergency, each line in the ring grid is designed to carry only about half of its maximum load capacity (i.e., the load factor is controlled at about 50%). This strategy ensures that in the event of a line failure, the neighboring backup line can seamlessly take over the additional load, thus avoiding service interruptions and significantly enhancing the stability of the power supply system and the customer’s power experience. However, this design consideration also leads directly to an increase in overall grid construction costs.
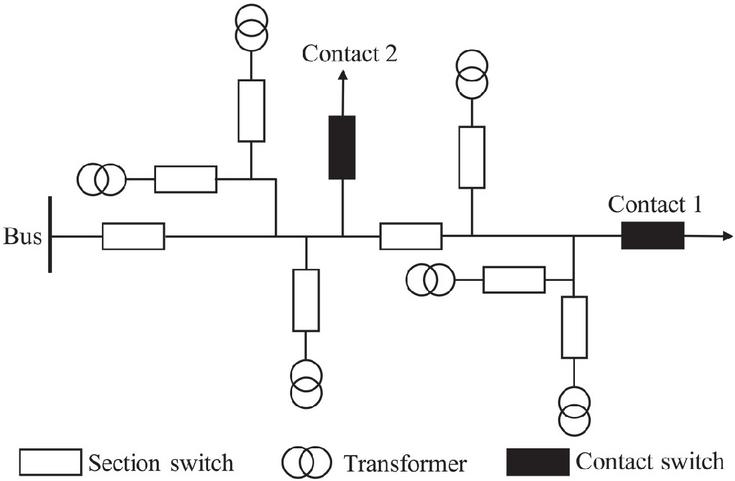
Figure 6 Section contact connection mode.
Section contact connection mode (Figure 6) cleverly realizes the segmented layout of the main lines, and cleverly configures contact switches at each segmental node, thus constructing an interconnection channel with other lines. The design of this sectionalized line significantly enhances the reliability of the power supply system: once a section of the line encounters a fault and interrupts the power supply, the neighboring contact switches can quickly intervene to transfer the affected loads to other healthy lines, ensuring the continuity and stability of the power supply and greatly shortening the recovery time from power outage. Compared with ring connection mode, section contact connection mode shows unique advantages in improving line utilization efficiency and regional load carrying capacity. Through refined line segmentation and efficient load distribution, this method can increase the load ratio of the line to a higher level, and at the same time, only about one-third of the reserve capacity needs to be retained to effectively cope with emergencies, thus realizing the efficient use of resources.
However, it is worth noting that the section contact connection mode brings high power supply reliability, but also comes with relatively high construction and maintenance costs. The complex network structure and refined management requirements make this method more suitable for power supply areas with high load density and extremely stringent requirements on power supply quality. In these areas, the sectional contact line connection method can give full play to its advantages and provide solid and reliable power protection for economic development and social life.
For the three connection modes described above, the relevant comparison is shown in Table 2:
Table 2 Comparison of three typical medium-voltage distribution network connection modes
| Connection | Maximum Line | |||
| Mode | Load Rate (%) | Line Contact Way | Economy | Reliability |
| Radial | 100 | None | Good | Bad |
| Ring | 50 | Instation and interstation | Average | Good |
| Section contact | 67 | Instation and interstation | Average | Good |
2.3 Analysis of the Current Situation of Shaanxi Power Grid
Shaanxi Power Grid is an important part of the Northwest Power Grid. This paper investigates the current situation of Shaanxi Power Grid System, and sorts out and analyzes the current problems faced as follows:
Shaanxi Power Grid has now built a strong infrastructure network, specifically including the completion of 10 750 kV substations, the total transformer capacity of which has jumped to 25.2 million kVA, significantly enhancing the transmission capacity of the grid. Meanwhile, the 750 kV high-voltage lines have reached 21, with a total mileage spanning 1499.8 kilometers, which not only carefully weave a ring network structure in the Guanzhong area to stabilize the power supply in the core area, but also further expand to the northern Shaanxi area, constructing a backbone network layout of “two longitudinal and one ring”, realizing a wide-area coverage and efficient interconnection of power transmission. Efficient interconnection. This layout not only optimizes the structure of the grid but also greatly improves the reliability and flexibility of Shaanxi’s power supply. In addition, the smooth operation of the grid also depends on the establishment of substations of other voltage levels, and Figure 7 shows the proportion of the number of substations of each voltage level.
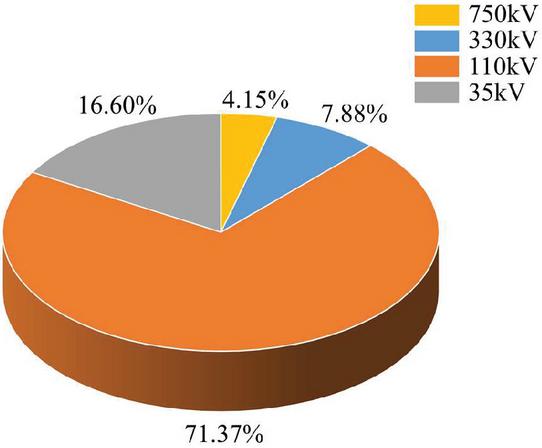
Figure 7 The capacity proportion of each voltage level in Shaanxi power grid.
As the power industry undergoes a profound transformation from a traditional architecture to a smart system, Shaanxi Power Grid is actively deploying a robust smart grid system at the 750 kV and 330 kV levels, to lay a solid foundation for the development of the backbone grid in the next ten to fifteen years, and to ensure that the grid architecture can flexibly respond to, and lead, the demands of the energy transition of the future. In addition, new energy access has also prompted Shaanxi Power Grid to implement distribution network optimization measures to effectively respond to the challenges of grid planning and transformation brought about by new energy access on a large scale, and to ensure that the grid structure can be flexibly adapted to and promote the efficient integration and utilization of new energy. These are all issues that need to be resolved by Shaanxi Power Grid at present.
3 Principles of Comprehensive Assessment and Optimization of Distribution Network Connection Mode
3.1 Integrated Assessment Indicators
This paper comprehensively evaluates and analyzes the connection modes of distribution networks from a multi-dimensional perspective, aiming to explore their reliability, safety and economy in depth.
(1) Reliability The power supply reliability of a distribution network is a measure of its ability to maintain the healthy operation of key equipment and parameter stability, as well as the ability to quickly restore power supply and limit the scope of power outages under stable and non-stable (e.g., maintenance and fault) conditions. In this paper, the power supply reliability rate R is chosen to measure it, calculated as in Equation (1):
| (1) |
Where T denotes the total power supply time and denotes the outage time. The larger R is, the more reliable the distribution network is.
(2) Security The core of the security of a distribution network is its ability to withstand and recover from operational failures, as well as its ability to flexibly transfer power between lines to maintain continuity of supply. In this paper, the line N-1 throughput rate S is chosen to evaluate the security, and the calculation method is shown in Equation (2):
| (2) |
Where C denotes the total number of lines and denotes the number of lines that satisfy N-1 and are in contact. The larger C is, the more secure the distribution network is.
(3) Economy The economic evaluation of distribution networks focuses on the economic efficiency of the construction investment. This involves not only the rational planning and control of the initial construction costs, but also a comprehensive assessment of the maintenance costs, energy efficiency improvement and potential returns in the long-term operation. The calculation method is as follows:
| (3) | |
| (4) |
Where denotes the substation construction cost, denotes the line construction cost, denotes the cost of disconnecting switches, denotes the line zigzag coefficient, L denotes the length of the line, and is the unit cost of the line. The lower the construction investment E, the higher the economics of the distribution network.
3.2 Optimization Principle
The optimization principle of the distribution network connection modes, that is, it mainly focuses on the several assessment indicators introduced above:
1. Clear network structure, avoid redundancy and save construction costs. The network structure of the distribution network is designed to be concise and clear, effectively avoiding unnecessary redundancy, so as to economically realize the construction cost savings and optimization. This design strategy not only improves the operational efficiency of the system, but also promotes the rational use of resources.
2. Flexible, safe and reliable power supply, realizing high automation of power distribution. The design of power distribution network ensures that the power supply is flexible and changeable, can quickly respond to power demand fluctuations, and realizes the optimal allocation of resources. At the same time, it strengthens security measures, adopts intelligent monitoring and rapid fault-handling mechanisms, and guarantees safety. Meanwhile, it can realize a stable power supply and provide continuous, high-quality power service under any circumstances to meet the needs of social and economic development.
4 Construction of Optimization Model Based on Graph Neural Network and Genetic Algorithm
4.1 Graph Neural Network (GNN)
GNN skilfully utilizes the nature of the Laplace matrix of graphs and introduces the classical Fourier transform to graphs, which enables GNN to perform efficient convolution operations on complex topologies, thus effectively capturing and extracting spatial features in graphs, and providing a powerful tool for machine learning models when dealing with graph-structured data.
After normalizing the Laplace matrix and eigen-decomposing it, the matrix is obtained see Equation (5).
| (5) | |
| (6) | |
| (7) |
Where U is the eigenvector and is the eigenvalue.
The convolution formula for the convolution kernel g on the graph can be expressed as Equation (8), by which feature extraction of distribution network data can be realized.
| (8) |
Where g is the convolutional kernel function, f is the signal vector on the graph, and U is the eigenvector of the Laplace matrix of the graph.
Similar to CNN, with the gradual deepening of the number of convolutional layers in GNN, the range of neighboring nodes’ information that the central node can integrate and utilize is also expanded, as shown in Figure 8. At the same time, both feature update mechanisms are closely dependent on the convolutional operation, and this coupling relationship makes them show high efficiency in feature extraction. In particular, GNN can perceive and integrate the global structural information, thus realizing a more comprehensive and deeper feature representation of graph data [26, 27].
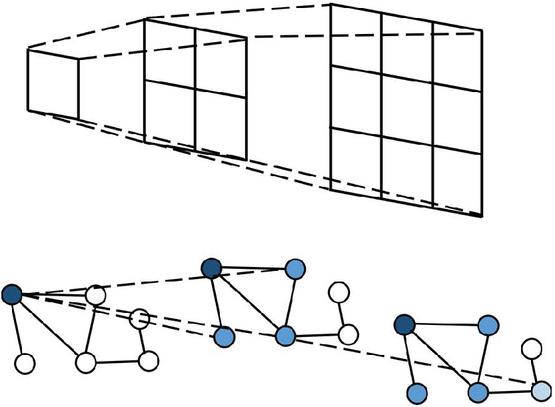
Figure 8 Changes in CNN (above) and GNN (below) receptive domains.
4.2 Genetic Algorithm
Genetic Algorithm (GA) is a heuristic algorithm in which the randomness of the search gives it a powerful ability to jump out of local optimal solutions and describe a model using any complex equation or irregular boundaries by simply providing a range of values for the parameters [28]. Drawing on the idea of Darwinian evolution, each individual inherits and mutates like a chromosome [29]. Analogous to genes encoded as nucleotide sequences in chromosomes, the GA encodes individuals of a population using a certain coding scheme and then evolves according to a fitness function. As shown in Figure 9, GA mimics the process of natural selection, with genetic exchanges between two individuals called crossovers, as well as random mutations that occur in the process called mutations [30].
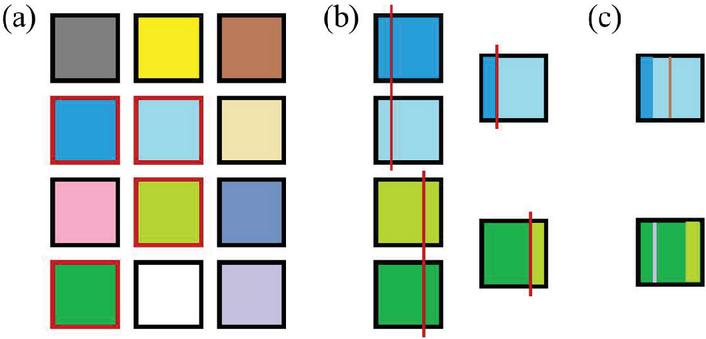
Figure 9 GA algorithm diagram: (a) random selection of parents in the population; (b) crossover; (c) mutation.
The GA algorithm implements the optimization process through the process of population evolution. The variables to be solved in the model are represented as the genes of an individual, and all the genes are represented as vectors constituting an individual , as shown in Equation (9):
| (9) |
Where t denotes the number of evolutionary generations and i is the individual number.
Each generation population Z consists of M individuals as in Equation (10). Where denotes the population of generation t and denotes the i-th individual in the population of generation t.
| (10) |
The real number encoding is used to assign values to the variables, and the j-th variable for the i-th individual is valued in the following way:
| (11) |
Where and denote the upper and lower bounds of the j-th variable, respectively, and denotes the generation of a random number lying between 0 and 1 (containing 0, 1).
GA adopts a “greedy” selection strategy, retaining the best individuals in each evolutionary generation. The measure of goodness of an individual is called Fitness, which is calculated by the fitness function (also called the evaluation function). The larger the Fitness value of an individual, the better adapted it is and the easier it is to retain. The selection operation from generation to can be described as:
| (12) |
Where and denote two individuals in generation t, and denotes individuals retained to the next generation.
The crossover operation randomly identifies two individuals from the current population for information exchange, and Figure 10 shows the process of crossover between individuals and . Each individual may mutate during the evolutionary process.
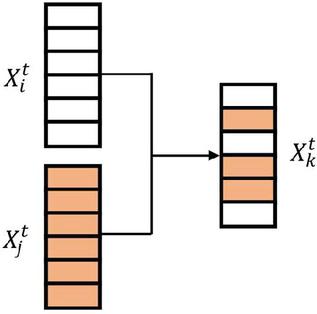
Figure 10 Inter-individual crossover diagram.
The following Figure 11 shows the flow of the GA algorithm to optimize the model parameters.
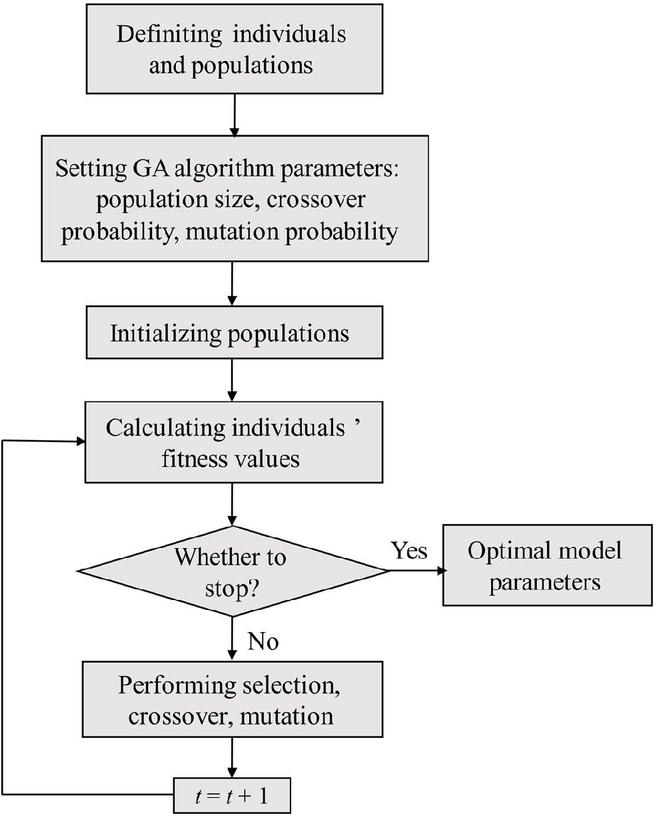
Figure 11 GA algorithm flowchart.
4.3 Constructing Optimization Models
The optimization process of the connection modes of distribution network is mainly divided into two steps: Firstly, utilizing graph neural networks for modeling and feature extraction of the distribution network. This involves leveraging the capabilities of graph neural networks to capture the complex topological and operational characteristics of the distribution network, enabling effective representation and analysis of its structure and behavior. Secondly, based on the optimization objective of the designed distribution network model, the coding method and key parameters of the genetic algorithm are set. Subsequently, through the processes of selection, crossover, and mutation, the genetic algorithm is employed to optimize the model parameters. This approach aims to iteratively refine the model’s configuration, thereby enhancing its performance and aligning it more closely with the desired optimization objectives.
In this paper, the minimization of network loss and the minimization of node voltage deviation of the distribution network are taken as the optimization objectives, then the objective function of the genetic algorithm is given as Equation (13):
| (13) | |
| (14) |
Where is the network loss function and is the node voltage deviation function; and denote the initial network loss and node voltage deviation, and and denote the optimized network loss and node voltage deviation; is the parameter vector; denotes the search space of the variables, and the search space of each variable is determined by the range of parameter values.
The objective function is further transformed into the fitness function Fitness(X) in the GA algorithm, which is calculated as in Equation (15). The larger the value of fitness, the better the wiring of the distribution network and the easier the individual is saved.
| (15) |
5 Analysis of Results
5.1 Optimized Design and Scope of Application of the Network Model
When discussing the diversified structure of medium-voltage distribution networks, various connection modes show unique characteristics and applicable scenarios, and their selection requires careful consideration of the load characteristics, economic efficiency, and reliability standards of the power supply area. This process aims to balance the dual needs of economic investment and power supply stability to ensure the comprehensive optimization of distribution networks in construction and renovation.
The characteristics of signals in graph theory are strongly influenced by the connection structure between nodes, i.e., the same signal will show different properties in differentiated graph structures. Given this, we adopt a GNN model, whose input is centered on the topology data of the distribution network, which exhaustively records the information of nodes and edges in the Shaanxi grid. The output of the model focuses on the prediction of network losses and voltage deviations at the node level, providing key indicators for optimization decisions. The application of the GNN model in the optimization of wiring pattern combinations is based on the characteristics of the graph domain, which is unique in that each central node can aggregate the feature information from its two-order neighboring nodes, thus achieving a more accurate capture of the global information. This feature not only enhances the model’s ability to understand complex network structures but also endows it with strong resistance to noise and data perturbation. Even in the case of incomplete measurement data, GNN can effectively predict and optimize the voltage deviation and network loss by its global vision, and achieve optimal adjustment of the structure.
For the specific case of Shaanxi Power Grid, we collected a sample set of 6000 data sets from 30 branch circuits and divided them into a training set (4800 samples), a validation set, and a test set (600 samples each) based on the ratio of 8:1:1. To evaluate and compare the adaptability and robustness of CNN and GNN models in the face of complex topology changes in distribution networks, a series of network reconfiguration scenarios with different levels of difficulty are carefully designed. The results are shown in Figure 12, which shows that the accuracy of GNN is higher than that of CNN in all three scenarios.
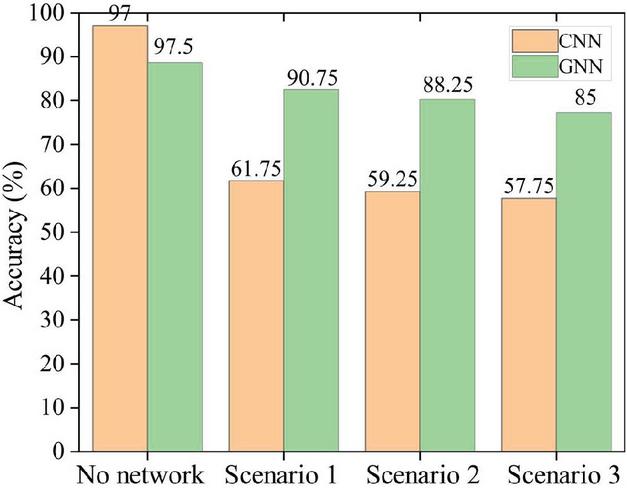
Figure 12 Comparison of accuracy of CNN and GNN.
Through careful parameter tuning, we set the learning rate to 0.006, the batch size to 10, and performed 400 iterations of training. In this paper, we choose the Root Mean Square Error (RMSE) as loss function to calculate loss rate. Then the RMSE is calculated as in Equation (16):
| (16) |
The experimental results are shown in Figure 13, with the increase of iterations, the model performance is significantly improved: after 20 iterations, the accuracy reaches 91.21%; at 400 iterations, the accuracy climbs to 98.60%, and the loss rate is reduced to about 0.11 p.u. This series of data strongly proves the excellent efficiency and accuracy of the GNN-based optimization model for the combination of distribution network connection modes. This series of data strongly proves the excellent performance of the GNN-based distribution network wiring pattern combination optimization model in terms of efficiency and accuracy. The GNN model, trained on a sample set of 6000 data sets collected from 30 branch circuits in the Shaanxi Power Grid, achieved remarkable accuracy, reaching 98.60% after 400 iterations. This high accuracy is a testament to the model’s ability to predict network losses and voltage deviations at the node level with great precision. The low loss rate of approximately 0.11 further validates the model’s robustness and efficiency.
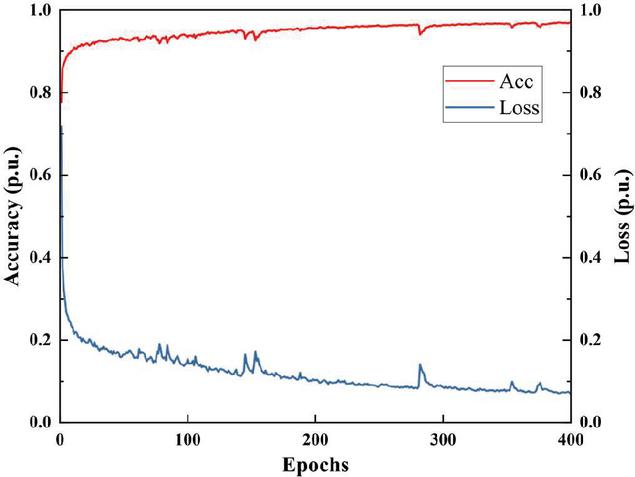
Figure 13 The accuracy and loss of GNN-based distribution network model.
Figure 14 shows the two-dimensional classification map after dimensionality reduction using neural networks, where the horizontal and vertical coordinates indicate the two principal components that have the greatest influence on classification, the scatter samples indicate the distribution network topology, and the clustering results show that the distribution network structure belongs to different class categories.
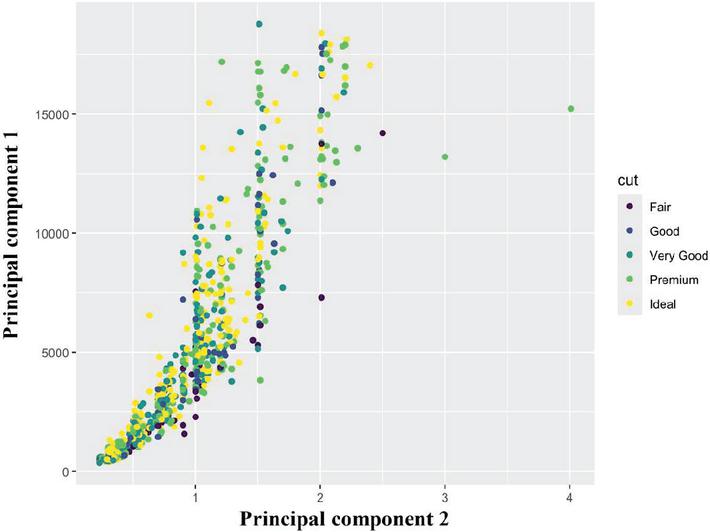
Figure 14 Graph of cluster analysis results.
To comprehensively assess the robustness of the model under data perturbation scenarios, we conducted an in-depth analysis of two major aspects: data noise and data incompleteness. First, the model’s ability to tolerate measurement errors is tested by injecting Gaussian noise of different levels (specifically 60dB, 40dB, and 20dB) into the node features. This is intended to simulate the signal interference that may be encountered in real environments, to verify the stability performance of the model in a noisy background.
Secondly, to examine the performance of the model in the missing data scenario, we set two missing data rates while keeping other parameters unchanged: randomly selecting 1% of the total data and setting its value to 0, and a more stringent missing data condition of 2%. Such settings aim to simulate the random missingness problem that may be encountered during the data collection process, and thus assess the prediction accuracy and reliability of the model when the data are incomplete.
Table 3 details the validation results of the model under the above data noise and missing data conditions, demonstrating how the model’s performance varies when faced with different levels of data perturbation, thus providing us with an intuitive basis for assessing the robustness of the model. Under the 60dB high-intensity noise condition, the model still maintains high performance, and although the accuracy decreases compared to the no-noise case, the decrease is within the acceptable range, indicating that the model has a certain degree of resistance to extreme noise disturbances; as the noise intensity decreases, the model’s accuracy significantly improves, approaching the performance in the no-noise case, further verifying the model’s stability in dealing with medium-intensity noise. The stability of the model is further verified when dealing with medium-intensity noise; in the lower intensity 20dB Gaussian noise environment, the accuracy of the model is almost unaffected and remains at a very high level, which proves the robustness of the model under regular noise conditions. In terms of missing data analysis, the performance of the model slightly decreases in the case of a 1% missing data ratio, but the overall accuracy remains at a high level. This indicates that the model has a certain degree of fault tolerance and can maintain good prediction results even when some data are missing. As the proportion of missing data increases, the accuracy of the model decreases, but the decrease does not show a sharp deterioration, indicating that the model can still maintain a certain degree of stability when dealing with a higher proportion of missing data. However, due to the large number of distribution network topology combinations and the great amount of data, it not only greatly increases the time cost of optimization, but also may lead to the optimized structure obtained by GNN falling into the local optimal solution.
Table 3 The effect of data perturbation on model performance
| Data Perturbation | Accuracy (%) |
| None | 98.60 |
| 20dB Gaussian noise | 96.63 |
| 40dB Gaussian noise | 96.54 |
| 60dB Gaussian noise | 96.42 |
| 1% data loss | 96.55 |
| 2% data loss | 96.35 |
Therefore, in this paper, based on the GNN screening results, the improved genetic algorithm with dual optimization objectives is used to do the final optimization, which improves the computational efficiency and ensures that the wiring combination pattern obtained is the globally optimal result as far as possible at the same time. Using the proposed dual-objective optimization method of distribution network structure based on the improved genetic algorithm, the above GNN-selected system network architecture is optimized, and the results are compared with the traditional genetic algorithm-based optimization algorithm with the single objective of minimizing network loss or node voltage deviation. The population size of the proposed improved genetic algorithm is set to 100, the maximum number of iterations is 100, the crossover probability is taken as 0.7, and the variance probability is taken as 0.02.
After the proposed bi-objective optimization framework in this paper is applied to network optimization, the system performance is significantly improved. Specifically, as shown in Table 4, the system network loss is reduced to 128.76 kW, which achieves a significant reduction of 32.8% compared to the maximum node system state before optimization. At the same time, the node voltage deviation is also significantly reduced from the original 1.587p.u. to 0.995p.u., a reduction of up to 37.3%, which effectively enhances the voltage stability.
Table 4 The optimization calculation results based on improved GA
| Power | Node Voltage | ||
| Model | Loss (kW) | Deviation (p.u.) | Accuracy (%) |
| Actual | 191.61 | 1.587 | 98.60 |
| Minimum power loss | 127.02 | 1.106 | 96.63 |
| Minimum node voltage deviation | 139.54 | 0.975 | 96.54 |
| Double-target optimization Model | 128.76 | 0.995 | 96.35 |
Comparing the results of the dual-objective optimization strategy with the single-objective optimization that purely seeks to minimize the network loss, we find that although the system network loss slightly increases from 127.02 kW to 128.79 kW, which is an increase of only 1.39%, the node voltage deviation achieves a much more substantial improvement from 1.106 p.u. to 0.995 p.u., which is a decrease of 10.03%. This comparison highlights the advantages of dual-objective optimization in balancing system efficiency and voltage stability, indicating that its comprehensive performance is better than that of a single network loss optimization strategy. On the other hand, compared with the single-objective optimization that only focuses on minimizing the node voltage deviation, the dual-objective optimization algorithm effectively reduces the system network loss while maintaining a lower voltage deviation. Specifically, the system network loss is reduced by 7.73% from 139.54 kW to 128.76 kW. Although the nodal voltage deviation increases slightly from 0. 975 p.u. to 0.995 p.u., with an increase of only 2.10%, this small change is within the acceptable range and does not significantly affect the overall system performance. Therefore, in terms of comprehensive benefits, the bi-objective optimization method is also superior to the simple node voltage deviation minimization strategy. Figure 15 visualizes the changes in the node voltage before and after optimization, further verifying the effectiveness of the dual-objective optimization strategy.
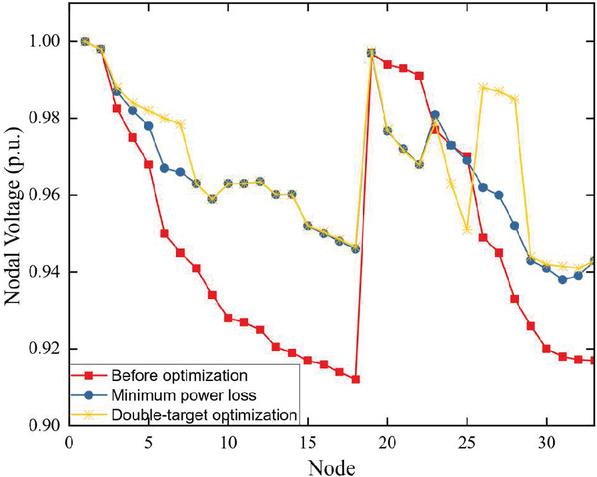
Figure 15 Voltage distribution diagram before and after the optimization.
After in-depth analysis, compared with the traditional single-objective optimization path relying only on a genetic algorithm, the innovative dual-objective optimization strategy based on the improved genetic algorithm in this paper shows more excellent performance. This strategy not only significantly reduces the power loss of the system, but also effectively reduces the deviation range of the node voltage, thus greatly enhancing the operational reliability and stability of the power system. By carefully observing the dynamic change curve of the fitness function, it can be seen that after only 20 iterations of the improved genetic algorithm, the algorithm can efficiently lock and approximate the optimal solution of the fitness function, which significantly improves the efficiency and accuracy of the optimization process. In addition, the optimal combination of connection modes found during the optimization process, as shown in Figure 16, not only reflects the algorithm’s ability to accurately judge the complex power system structure but also provides a valuable reference for practical engineering applications.
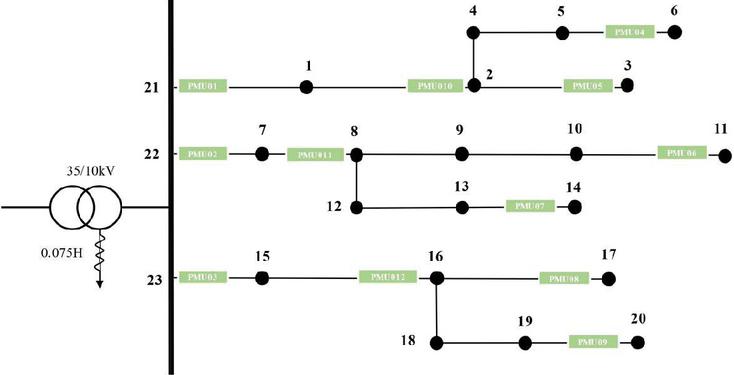
Figure 16 10kV distribution network structure.
5.2 Flexible Transition Scheme
In planning the ideal power supply model and future network architecture, our goal is to build an efficient and reliable power network system. The planning process starts with a vision of the network architecture in the target year and is closely based on the actual state of the network today, with a carefully laid out blueprint for the intermediate years based on medium-term load forecasts. Our strategy focuses on solving the bottlenecks in the current network and skilfully designs a smooth transition from the current state to the target network architecture. Based on the detailed program for the near-term planning year, we have carefully planned a series of renovation and construction projects aimed at gradually eliminating deficiencies in the existing network. In particular, we have developed solutions to the core problems of the current distribution network, such as long supply radii, redundant supply paths, unclear zoning, and a weak network structure. It is worth noting that this transformation does not start from scratch, but rather builds on the existing load and line layouts and progressively moves towards the target network structure, ensuring that it is highly adaptable and flexible in the face of the new challenges of urban development.
We emphasize the importance of properly laying out interconnecting lines between substations and within stations, given the pressure on the power supply and the risk of line overloads that may arise from the continuous growth of load capacity in the distribution network. As the key to system flexibility, these contact lines can ensure flexible load distribution among different stations, which significantly improves the overall reliability of the system. For radial connection mode, if the load ratio is high or does not meet the N-1 safety standard, it is recommended to connect it with neighboring lines to form a “mutual backup hand in hand” ring or single contact structure to enhance the load transfer capability. For lines that have been looped, if the load is also heavy, it is recommended to consider establishing a new contact with a low-load line or connecting to a substation with a surplus interval to optimize the load distribution. In the core urban areas with very high load density, given their special requirements for high capacity and high reliability, we tend to adopt more complex wiring strategies, such as multi-section and multi-contact methods, to ensure stable and efficient power supply. Adopt a phased approach to the transition, allowing for incremental improvements and adjustments. Utilize advanced monitoring and control systems to ensure the stability and reliability of the power supply during the transition. Engage stakeholders early in the process and maintain open communication to address concerns and facilitate the transition. This comprehensive planning strategy not only solves the current problems but also lays a solid foundation for the sustainable development of the power network in the future.
6 Conclusion
In this paper, we first compare the main connection modes of China’s high-voltage and medium-voltage distribution grids and combine them with the specific needs of the Shaanxi power grid to propose a differentiated and flexible network formation mode and its scope of application. Through the use of graph neural network and genetic algorithm, this paper proposes an innovative optimization method of distribution network connection mode to support the typical network structure of a new distribution network, and obtains the following conclusions:
1. The use of graph neural network (GNN) model, whose inputs are the information of nodes and edges in Shaanxi power grid, the final accuracy reaches 98.60%, while the loss rate is reduced to about 0.11 p.u., which is a strong proof of the excellent performance of the optimization model for the combination of connection modes of the distribution grid based on the GNN in terms of efficiency and accuracy, and the GNN possesses strong stability in the presence of missing data and perturbations;
2. The optimization results of the dual-objective genetic algorithm show that the proposed algorithm can better improve the network loss and voltage deviation of the original network by 32.8% and 37.3%, respectively, and the improvement effect is better than that of the traditional genetic algorithm.
3. Considering the different stages of distribution network development and the uncertainty factors that may be faced, the flexible transition scheme of each typical network structure is explored to ensure a smooth transition to a more efficient, green, and intelligent distribution network mode without affecting the reliability of the existing power supply.
Furthermore, the application of the improved genetic algorithm enhances the computational efficiency, ensuring that the wiring combination pattern obtained is as close to the globally optimal result as possible. This not only reduces the workload of the learners but also increases their confidence in the decision-making process, as they can rely on the model’s accuracy and reliability.
References
[1] Mahdi Sedghi, Ali Ahmadian, Masoud Aliakbar-Golkar. (2016). Assessment of optimization algorithms capability in distribution network planning: Review, comparison and modification techniques. Renewable and Sustainable Energy Reviews, 66, 415–434,
[2] Xin Du, Jiali Huo, Lin Chen, Mingchang Wang, Zhaoshun Wu, Chengliang Zhang. (2023). Application of Intelligent Optimization Algorithms in the Distribution Network Planning and Evaluation Models. Procedia Computer Science, 228, 1205–1214,
[3] Akihiko Yokoyama. (2022). Toward Deregulated, Smart and Resilient Power Systems with Massive Integration of Renewable Energy in Japan. IEEJ Transactions on Electrical and Electronic Engineering, 17, 1242–1254.
[4] Liu Xiang jun, MA Shuang, Xu Gang. (2012). Formation of Typical Connection Mode for Distribution Network by Elementary Connection Model. Power System Technology, 36, 59–63.
[5] Qin, X. (2013). Analysis of Different Connection Modes in MV Distribution Systems. Lecture Notes in Electrical Engineering, 206, 107–114.
[6] Y. Jian, S. Lin, Y. Anxin, S. Ruoxuan. (2019). Research on a Typical Connection Mode of Flexible DC Distribution Applied to High Reliability Area. 2019 IEEE Innovative Smart Grid Technologies, 38, 2732–2737.
[7] Zhang Chi, Cheng Haozhong, Xi Xun. (2006). A Study of Distribution Network Feeding Modes Selection Based on Analytic Hierarchy Process and Fuzzy Comprehensive Evaluation. Power System Technology, 30, 67–71.
[8] Pan Feng, Zhang Yujun, Zhou Min. (2009). A Comprehensive Evaluation Hierarchy for MV Distribution Network based on Connection Modes. Power System Protection and Control, 37, 19–21.
[9] He Yongxiu, Wang Wei, Yang Weihong. (2009). Assessment of Connection Mode in Distribution Network Based on Blind Number Theory. Transactions of China Electrotechnical Society, 24, 139–144.
[10] Wang Chengshan, Wang Saiyi, Ge Shaoyun. (2002). Economy and Reliability Analysis of Different Connection Modes in MV Distribution Systems. Automation of Electric Power Systems, 26, 34–39.
[11] Minh Y Nguyen, Yong Tae Yoon. (2014). A Comparison of Microgrid Topologies Considering Both Market Operations and Reliability. Electric Power Components and Systems, 42, 585–594.
[12] Wu Han, Lin Han, Chen Bin, Wu Han, WenBu Ying. (2012). The Selection Algorithm for Connection Modes of Medium Voltage Power Distribution Network Based on FAHP-GRA. Physics Procedia, 24, 345–353.
[13] Wu Z, Pan S, Chen F. (2020). A comprehensive survey on graph neural networks. IEEE transactions on neural networks and learning systems, 32, 4–24.
[14] Jie Zhou, Ganqu Cui, Shengding Hu, Zhengyan Zhang, Cheng Yang, Zhiyuan Liu, Lifeng Wang, Changcheng Li, Maosong Sun. (2020). Graph neural networks: A review of methods and applications. AI Open, 1, 57–81.
[15] Yaniv, A., Kumar, P., and Beck, Y. (2023). Towards adoption of GNNs for power flow applications in distribution systems. Electric Power Systems Research, 216, 109005.
[16] Christian Nauck, Michael Lindner, Konstantin Schürholt, Frank Hellmann. (2023). Toward dynamic stability assessment of power grid topologies using graph neural networks. Chaos, 33, 103103.
[17] W. Liao, D. Yang, Q. Liu, Y. Jia, C. Wang, Z. Yang. (2024). Data-Driven Reactive Power Optimization of Distribution Networks via Graph Attention Networks. Journal of Modern Power Systems and Clean Energy, 12, 874–885.
[18] Ali, Z. M., Diaaeldin, I. M., El-Rafei, A., Hasanien, H. M., Abdel Aleem, S. H. E., and Abdelaziz, A. Y. (2021). A novel distributed generation planning algorithm via graphically-based network reconfiguration and soft open points placement using Archimedes optimization algorithm. Ain Shams Engineering Journal, 12, 1923–1941.
[19] M. Baran, F. Wu. (1989). Network reconfiguration in distribution systems for loss reduction and load balancing. IEEE Transactions on Power Delivery, 4, 1401–1407.
[20] T. Han, D. J. Hill. (2023). Learning-Based Topology Optimization of Power Networks. IEEE Transactions on Power Systems, 38, 1366–1378.
[21] Elkazaz, M. H., Hoballah, A. A., Azmy, A. M. (2016). Operation optimization of distributed generation using artificial intelligent techniques. Ain Shams Engineering Journal, 7, 855–866.
[22] Bakry, O. M., Alhabeeb, A., Ahmed, M., Alkhalaf, S., Senjyu, T., Mandal, P., and Dardeer, M. (2022). Improvement of distribution networks performance using renewable energy sources based hybrid optimization techniques. Ain Shams Engineering Journal, 13, 101786.
[23] Xiaoyu Sun, Jinsong Liu, Xin Sun, Jin-miao Hu. (2016). Optimization of Distribution Network with Distributed Generation Based on an Improved Genetic Algorithm. International Journal of Grid and Distributed Computing, 9, 105–116.
[24] Jo Seungchan, Oh Jae-Young, Lee Jaeho, Oh Seokhwa, Moon Hee Seung, Zhang Chen, Gadh Rajit, Yoon Yong Tae. (2023). Hybrid Genetic Algorithm With k-Nearest Neighbors for Radial Distribution Network Reconfiguration. IEEE Transactions on Smart Grid, 15, 2614–2624.
[25] Morad Abdelaziz. (2017). Distribution network reconfiguration using a genetic algorithm with varying population size. Electric Power Systems Research, 142, 9–11.
[26] Defferrard M, Bresson X, Vandergheynst P. (2016). Convolutional neural networks on graphs with fast localized spectral filtering[J]. Advances in neural information processing systems, 29, 3844–3852.
[27] K. Chen, J. Hu, Y. Zhang, Z. Yu and J. He. (2019). Fault location in power distribution systems via deep graph convolutional networks. IEEE Journal on Selected Areas in Communications, 38, 119–131.
[28] Li G Q, Cai C X. (2017). Estimation parameters of hydrocracking model with NSGA-ii (Non-dominated Sorting Genetic Algorithm) by using discrete kinetic lumping model. Fuel, 200, 333–344.
[29] Nyathi, T., Pillay, N. (2018). Comparison of a genetic algorithm to grammatical evolution for automated design of genetic programming classification algorithms. Expert Syst. Appl., 104, 213–234.
[30] Federico R, Corrado P, Luca M. (2017). Optimization algorithms for computational systems biology. Frontiers in Applied Mathematics and Statistics, 3, 1–12.
Biographies
Guo Chen (1980–), male, from Jishan, Shanxi, master’s degree student, He is employed at State Grid Shaanxi Electric Power Company Limited Research Institute with senior engineer, mainly engaged in power system dispatching and operation.
Wang Hui (1990–), male, Han ethnicity, from Shangluo, Shaanxi Province, is a graduate student and State Grid Shaanxi Electric Power Company Limited Research Institute with senior engineer. His main research areas include power grid planning technology, distributed power grid integration, and intelligent distribution network.
Yan Huan (1988–), female, Han ethnicity, Chongqing native, graduate student. She is employed at State Grid Shaanxi Electric Power Company Limited Research Institute with senior engineer, mainly engaged in research on power grid planning, power system analysis, electrical calculation, etc.
Li Bingchen (1997–), male, Han ethnicity, from Xianyang, Shaanxi Province, graduate student. He is employed at State Grid Shaanxi Electric Power Company Limited Research Institute with assistant engineer, research on power grid planning and new energy consumption.
Zhou Xingxing (1990–), female, born in Baoji, Shaanxi Province, bachelor degree, senior engineer, mainly engaged in power grid planning research.
Distributed Generation & Alternative Energy Journal, Vol. 39_6, 1179–1208.
doi: 10.13052/dgaej2156-3306.3964
© 2025 River Publishers