Energy Storage Configuration Evaluation Method for Renewable Energy Consumption Based on Power Grid Development Planning and Resource Output Forecast Analysis
Guozhen Ma1, Shiyao Hu1, Yunjia Wang1, Ning Pang1 and Junyi Yu2,*
1Economic and Technological Research Institute of State Grid Hebei Electric Power Co., Ltd., Hebei, China
2Wuhan Load Coordinated Control Technology Co., Ltd, Wuhan, Hubei, China
E-mail: ma_guozhen@126.com; 3126894046@qq.com
*Corresponding Author
Received 04 November 2024; Accepted 18 December 2024
Abstract
In recent years, the rapid development of new energy sectors, particularly photovoltaic and wind power, has introduced significant challenges stemming from their inherent randomness and volatility. This paper presents a systematic approach for effective evaluation of energy storage configurations. The study begins by examining the anticipated evolution of the power grid in alignment with China’s energy policies, focusing on the annual growth rates of wind power, photovoltaic systems, and energy demand. This analysis establishes a foundation for planning energy storage installations. Next, a forecasting method is employed to predict the output of both photovoltaic and wind energy resources. Building on this, a novel control strategy is proposed for integrating renewable energy sources into the grid, facilitating the determination of optimal energy contributions to ensure a stable power supply. A comprehensive energy storage configuration model is then developed, accompanied by a multi-faceted analytical framework to assess energy storage from perspectives such as environmental impact, economic feasibility, operational flexibility, and technological advancement. Ultimately, this research provides a scientific assessment of energy storage configurations, grounded in grid development projections and resource output forecasts.
Keywords: Grid planning, forecast analysis, renewable grid integration, energy storage evaluation.
1 Introduction
The rapid development of the power industry has driven the swift advancement of new energy sources like photovoltaics and wind power. However, the intermittency, randomness, and uncertainty of these energy sources pose new challenges for system peak regulation and grid operation.
Energy storage systems are flexible to install and have two-way interactive charging and discharging capabilities. Deploying energy storage solutions at new energy sites can enhance the efficiency of transmission channels, mitigate the peak regulation demands on conventional units, and elevate the consumption levels of new energy, all while maintaining the integrity of the existing grid structure. Additionally, it can smooth out the power fluctuations of new energy and promote the grid connection and consumption of new energy. Given the uncertainty and intermittent nature of clean energy, the reasonable configuration of energy storage systems can help parks improve electricity efficiency, reduce energy waste, and support the broader adoption of renewable energy. In addition, the government provides subsidies, tax exemptions, and other preferential policies for park energy storage projects. These policies can reduce the costs of energy storage projects and boost their investment appeal. A large number of studies from various perspectives have been conducted both domestically and internationally on the configuration of park energy storage capacity. Reference [1] examines the coordinated optimization of energy storage capacity in wind, photovoltaic, and storage microgrid systems, considering the effects of multi-time scale uncertainty coupling. It also proposes a method for configuring energy storage that incorporates energy storage operation strategies; Reference [2] focuses on the optimal configuration of energy storage in wind power grid-connected systems, thereby obtaining the optimal energy storage capacity configuration of the system; Reference [3] analyzes the key factors of new energy consumption and research on solutions; Reference [4] research on grid-side energy storage optimization configuration taking into account planning and operation; Reference [5] examines the energy storage capacity configuration method for peak-shaving demand of high-proportion new energy power systems; Reference [6] evaluates the reliability assessment of coordinated operation of wind, photovoltaic, and storage from the perspective of operational reliability; Reference [7] addresses multi-objective configuration and proposes multi-objective capacity optimization configuration of photovoltaic microgrid energy storage systems based on demand response; Reference [8] considers the joint planning and optimal scheduling of energy storage and high-proportion renewable energy; Reference [9] explores the capacity optimization configuration of multi-medium energy storage systems to improve local wind power consumption; Reference [10] studies wind farm probability equivalent modeling based on clustering-discriminant analysis; Reference [11] discusses the application of a user-interactive load model and its integration into the day-ahead economic dispatch of microgrid systems.
At present, mainstream power grid optimization technologies can be roughly divided into traditional mathematical optimization methods and intelligent heuristic algorithms. Traditional optimization algorithms, such as linear programming (LP), nonlinear programming (NLP), and mixed integer programming (MIP), are mature tools that rely on precise mathematical models to find optimal solutions. However, they often have difficulty coping with the scale and complexity of modern power systems. To overcome these limitations, intelligent optimization algorithms inspired by natural and biological processes are becoming increasingly popular. These algorithms include genetic algorithms (GA), particle swarm optimization (PSO), ant colony optimization (ACO), and various machine learning methods such as artificial neural networks (ANN) and reinforcement learning (RL). Each algorithm has distinct advantages in dealing with nonlinear, multi-objective, and dynamic optimization problems. In addition, hybrid optimization methods, which combine traditional and intelligent techniques to make full use of the advantages of multiple methods, are becoming increasingly popular.
This paper conducts a scientific evaluation of the future development of the power grid, informed by the national power industry policy planning outlined in the “14th Five-Year Plan” and “15th Five-Year Plan”, as well as the future development goals set by the State Grid and the Southern Power Grid. It also analyzes the annual growth rates of wind power, photovoltaic power, and load to provide a reference for energy storage installation planning. Subsequently, a short-term power generation forecasting method based on VMD-WOA-BiLSTM-Attention [12] is used to predict the resource output of photovoltaic and wind power. The grid control method of new energy grid connection is used to select appropriate new energy to be connected to the grid for power supply. Then, an energy storage configuration model for new energy consumption is established, and an approach for the optimal solution of energy storage installation in ten years is established [13]. Additionally, a hierarchical analysis method measurement system is constructed to measure energy storage configuration from different perspectives such as environmental protection, economy, flexibility, and technology.
2 Grid Development Planning Assessment
2.1 The Scale of China’s New Energy Development
During the development phase of the new power system, the installed capacity of new energy in China has experienced rapid growth. The total installed capacity of photovoltaic, solar thermal, onshore wind power, and offshore wind power is projected to reach 1.12 billion kilowatts by 2025 and 2.68 billion kilowatts by 2035, and the proportion of non-fossil energy in total power generation is expected to reach 43% by 2025 and 61% by 2035. Correspondingly, the installed capacity of coal-fired power will increase. By 2025, China’s coal-fired power installed capacity is projected to peak at 1.17 billion kilowatts and then enter a peak plateau period, slowly declining to 1.06 billion kilowatts in 2035, of which about half are peak-shaving units with a utilization hour of only more than 3,000 hours.
In recent decades, the Chinese government has actively promoted the development of the renewable energy industry as a strategic initiative to combat climate change, reduce environmental pollution, and enhance energy security. Through a comprehensive range of policies, the Chinese government is committed to achieving these goals, as reflected in major national targets such as reaching a carbon emissions peak before 2030 and achieving carbon neutrality by 2060. To support the rapid growth of renewable energy, China has implemented various incentives, including financial subsidies, tax incentives, and feed-in tariffs to encourage investment and technological innovation. In addition, China’s Five-Year Plan and Renewable Energy Law provide long-term strategic direction for the industry, emphasizing the importance of innovation, infrastructure development, and integration with smart grid technologies.
2.2 Changes in China’s Installed Capacity of Power Generation Energy
From the perspective of installed capacity, China’s power structure continues to optimize. Although thermal power continues to hold a dominant position, the installed capacity of renewable energy has consistently increased over the years, along with its proportion of total installed capacity. Based on the chart illustrating the development trend of China’s installed capacity by power source from 2015 to 2040, China’s installed capacity will show an overall upward trend, with a compound annual growth rate of 3.1%. Notably, renewable energy has experienced rapid development, with photovoltaic power generation showcasing the highest compound annual growth rate. It is projected that wind power and photovoltaic power will develop at compound annual growth rates of 10.2% and 17.9% respectively from 2024 to 2030. This scale of development facilitates the establishment of an energy storage configuration evaluation model for new energy consumption based on the grid development plan. It aims to effectively realize the expected growth of wind power, photovoltaic power, while ensuring the scientific and rational deployment of energy storage scale, and the planning of subsequent annual energy storage installation plans. The research process of the entire paper is shown in Figure 1.
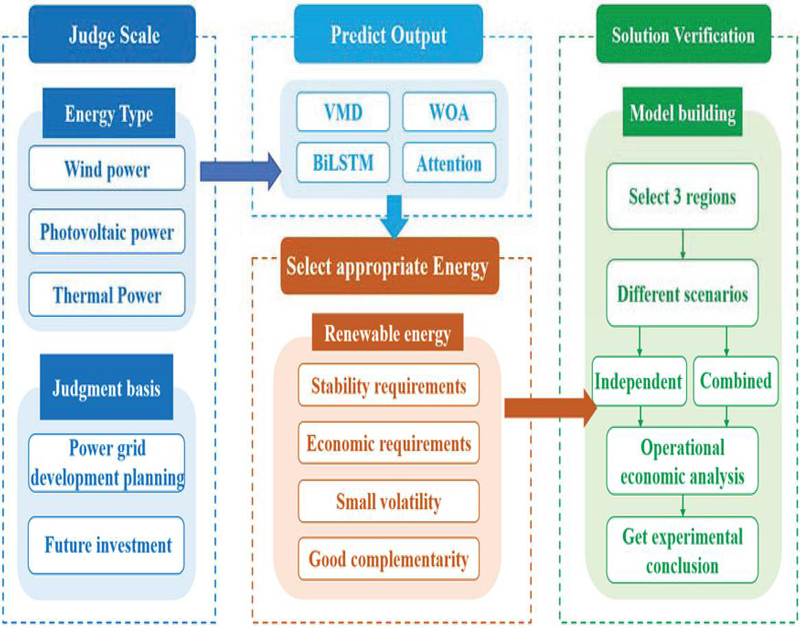
Figure 1 The research process of the entire study.
3 Resource Output Forecast Analysis of New Energy Photovoltaic and Wind Power
3.1 Establishment of Photovoltaic Output Model
The photovoltaic output power is mainly affected by temperature, light radiation intensity, and photovoltaic panel status. According to the reference [14], there is the following formula:
| (1) |
where is the PV output power at time t; is the rated PV output power under standard test conditions (PV panel temperature is 25C, radiation is 1 kW/m); is the derating factor set to consider factors such as PV panel dirt, wiring loss, shadow, snow accumulation, aging, etc.; is the solar radiation incident on the photovoltaic panel at time t; is the incident radiation under standard testing conditions; denotes the power temperature coefficient; T(t) represents the PV panel temperature at time t; signifies the PV panel temperature under standard testing conditions.
3.2 Establishment of Wind Power Output Model
The wind turbine output power [15] is:
| (2) |
where represents the rated output power of the wind turbine; denotes the wind speed; indicates the rated wind speed; and are the cut-in and cut-out wind speed, respectively.
3.3 Short-term Renewable Energy Power Forecasting Method Based on VMD-WOA-BiLSTM-Attention
This section introduces an ultra-short-term forecasting method based on a deep long short-term memory network [16] for day-ahead load prediction, supporting optimal energy storage scheduling decisions. This method integrates CNN, BiLSTM, and the attention mechanisms in a deep learning framework, enhanced by the Whale Optimization Algorithm (WOA). WOA improves upon traditional stochastic gradient descent by avoiding local optima and exploring global solution spaces, resulting in faster convergence and more accurate photovoltaic and wind power forecasts.
The process begins with collecting historical power generation data and relevant influencing factors from the target area. The data undergoes Variational Mode Decomposition (VMD), which offers advantages over traditional methods through its basis function-free approach, resistance to mode aliasing, and robust noise handling capabilities. The WOA algorithm optimizes BiLSTM’s key parameters, including learning rate, hidden layer nodes, and regularization coefficients. This optimization process involves initializing the population through random mapping, setting iteration parameters, defining hyperparameter ranges, calculating fitness values, and determining optimal positions until meeting termination conditions.
The expression of the best search strategy is:
| (3) | |
| (4) |
where is the current iteration count, is the current position of the best individual, is the coefficient vector. If there is a better solution, the WOA algorithm will continuously update the position of the best individual , where the vector is expressed as follows:
| (5) | |
| (6) |
Throughout the iteration, decreases linearly from 2 to 0, while and are random vectors in [0, 1].
The expression of the position update formula is:
| (7) | |
| (8) |
where represents the distance between the current search individual and the optimal solution, denotes the spiral shape parameter, and is a random number uniformly distributed in the range of .
The position update formula has the following two forms according to the probability :
| (9) | |
| (10) |
where is a random number in the range of [0, 1], and and gradually decrease as the number of iterations increases. If occurs, it means that the current optimal solution has been surrounded and the local optimization has begun.
After some search individuals enter the local optimization, other search individuals will enter the global optimization. Therefore, when , the expression of the position update formula becomes:
| (11) | |
| (12) |
Among them, represents the distance between the search individuals, and represents the current random individual position. When , random search is selected, and when , close to the optimal is selected. The characteristic of WOA is that it can select a suitable expression for prediction based on probability .
Utilizing the historical load data and the characteristic data set of photovoltaic power generation, the WOA algorithm is employed to optimize the hyperparameter combination of BiLSTM, including randomly dividing the characteristic data set of photovoltaic power generation into a training set and a test set. Based on the training set, the hyperparameter combination of BiLSTM is optimized by the optimized WOA algorithm to acquire the best hyperparameter combination of BiLSTM, and the prediction accuracy of the VMD-WOA-BiLSTM-Attention short-term photovoltaic and wind power prediction model is verified by the test set.
The mean absolute percentage error (MAPE), root mean square error (RMSE), and mean absolute error (MAE) are chosen as the evaluation indicators of the prediction accuracy of the VMD-WOA-BiLSTM-Attention short-term new energy photovoltaic and wind power prediction model, and the corresponding evaluation index values are obtained according to the test set, and the prediction accuracy of the VMD-WOA-BiLSTM-Attention short-term photovoltaic and wind power prediction model is verified according to the evaluation index values. These formulas are as follows:
| (13) | |
| (14) | |
| (15) |
Introduce the attention mechanism (Attention), the formula can be obtained as:
| (16) |
The Source consists of a series of pairs; Query represents a given target element; Key is the Key value of the element in Source; Value is the Value value of the element in Source; and Attention Value is the weighted sum of the Value values.
The first stage involves calculating the correlation between the query and various keys, which entails determining the weight coefficients of different values. The second stage normalizes the output from the previous stage, mapping the range of values between 0 and 1. The third stage performs a weighted summation of the values to derive the attention values, thereby redistributing the weights. The problem of too much information can be addressed by reallocating limited computing resources to more important tasks. This helps the model focus more deeply on the core data of the input sequence, thereby enhancing the accuracy and rapid convergence of the model.
4 Reasonable Integration of Photovoltaic and Wind Power Into the Grid
4.1 Grid Connection Options for New Energy Photovoltaic and Wind Power
This section introduces a grid control method for photovoltaic and wind power grid connection [17]. First, the representative curves of photovoltaic and wind power are compared and analyzed against those of other grid-connected energy sources to generate the correlation analysis curve. Subsequently, each continuous curve segment is determined from the correlation analysis curve according to a preset curve analysis value. The correlation evaluation value model is represented by the following formula:
| (17) |
In the above formula, is the associated evaluation value, and are the times corresponding to the continuous curve segment , and is the number of continuous curve segments.
Generate a historical grid-connected input curve for each grid-connected energy source according to the historical grid-connected data; adjust each of the historical grid-connected input curves to obtain a grid-connected representative curve corresponding to each of the grid-connected energy sources. The method for adjusting the historical grid-connected input curve includes:
1. Dividing the historical grid-connected input curve according to the preset time cycle segment to obtain several unit curves, integrating the unit curves into the same coordinate system, and setting the corresponding unit coefficients based on the time period corresponding to each unit curve;
2. Marking the unit curve with the largest unit coefficient as the initial curve, calculating the unit difference of the unit coefficient between each unit curve and the initial curve, and marking the initial curve with the smallest unit difference as the curve to be merged;
3. Merging the curve to be merged with the merged curve to obtain a new merged curve until no curve remains to be merged, and marking the remaining merged curve as the grid-connected representative curve. When there are multiple minimum unit differences, the unit curve closest to the current time is selected as the curve to be merged.
Methods for merging curves include:
1. Mark the curves to be merged as the first curve and the second curve, respectively;
2. Identify the values of the first curve and the second curve corresponding to the same time;
3. Mark the values of the first curve and the second curve as and , respectively, where is the time;
4. Determine the unit coefficients corresponding to the first curve and the second curve, and mark them as the first unit coefficient and the second unit coefficient, respectively.
Apply the merger formula:
| (18) |
Calculate the third curve value after the first curve value and the second curve value are combined; where is the third curve value; is the first unit coefficient; is the second unit coefficient. Generate a combined curve by merging the first curve and the second curve according to the third curve value corresponding to each moment. Calculate the unit coefficient of the combined curve according to the formula , where is the unit coefficient of the combined curve.
4.2 Method for Comparative Analysis of Wind Power Representative Curve and Grid Connection Representative Curve
The method for comparing and analyzing the representative curve of wind power with the representative curve of grid-connected power involves obtaining relevant data from the joint dispatch of wind power and various grid-connected energy sources, establishing a curve evaluation model. The expression of the curve evaluation model [18] is:
| (19) |
where represents the representative curve of wind power and the representative curve of grid connection. The process of determining the associated power source from each grid-connected energy source based on the associated evaluation value is as follows: marking the grid-connected energy source with an associated evaluation value not less than the preset value as a candidate power source, and performing a combined evaluation of the candidate power sources. The combined evaluation includes:
1. Determining each candidate application combination according to each candidate power source, performing application simulations for each combination, and obtaining the energy storage optimization value and grid connection optimization value corresponding to each candidate application combination;
2. Establishing a joint scheduling evaluation model, where the input data is the candidate application combination, and the output data is the application evaluation value.
The expression of the joint scheduling evaluation model is:
| (20) |
where is the application combination to be selected. The corresponding priority value is calculated using the formula:
| (21) |
In the formula, denotes the priority value; represents the energy storage optimization value; signifies the grid connection optimization value; and are proportional coefficients, with a value range of . The candidate application combination with the highest priority value is selected as the target application combination, with each candidate power source in this combination designated as an associated power source. This approach aims to facilitate the integration of new energy sources, including wind power, photovoltaic power, and energy storage, in the future.
5 Establishment of an Energy Storage Configuration Model for New Energy Consumption
5.1 Establishment of Energy Storage Model
The existing evaluation of energy storage configuration schemes mainly evaluates the energy storage configuration from the perspective of economic efficiency, and therefore lacks consideration of the role of energy storage in improving the regulation capacity of the power grid and the absorption capacity of new energy [19].
The model we propose calculates the average absorption capacity of wind power, the mean absorption capacity of photovoltaic power, the average voltage deviation, the maximum voltage deviation, the average wind abandonment rate, and the average photovoltaic abandonment rate based on the new energy distribution network after implementing the new energy storage configuration, so as to comprehensively evaluate the optimal energy storage configuration scheme [20].
To formulate the optimal operation strategy and power purchase plan, this paper establishes a model with the objective to minimize the total power purchase cost. The objective function comprises four components: the power purchase cost from the grid, the photovoltaic power purchase cost, the wind power purchase cost, and the costs associated with the abandonment of wind and solar power. The formula is:
| (22) |
where , and are the unit prices of electricity purchased from the grid, photovoltaic power, and wind power, respectively, in yuan/(kW⋅h); indicates the extent to which the park accommodates abandoned wind and photovoltaic power. means that the region incurs no additional cost for abandoned wind and photovoltaic power, while signifies the region pays for the abandoned power at the unit price of wind power/photovoltaic power purchase.
| (23) | |
| (24) |
In these two formulas, is the unit electricity price cost, represents the load power, and , and are the electricity purchased from the grid, photovoltaic power, and wind power in the region, respectively.
In field operation, the following constraints of the power balance equation need to be met:
| (25) |
where represents the operating status of energy storage device during period , expressed as a binary variable. The value of 1 means that the energy storage device is in the charging state, while a value of 0 indicates that it is in the discharging state. Additionally, the variables and represent the average charging power and discharging power of energy storage device during period , measured in kW.
For photovoltaic and wind power generation equipment, the electricity purchased from wind (or photovoltaic) sources in each period must not exceed the corresponding power generation in that period and must comply with the output constraints for both wind and photovoltaic sources.
| (26) |
where and represent the electricity purchased by region i from the power grid, photovoltaic power, and wind power, respectively, in kWh; and denote the photovoltaic and wind power outputs of region i in period t, respectively, in kW.
This study considers the role of configuring energy storage [21], so the regulations do not allow the sale of excess photovoltaic power and wind power to the main power grid. The total cost of wind and light abandonment can be calculated as follows:
| (27) |
Energy storage devices have certain particularities. In addition to meeting the output/output power constraints in each period, the stored energy is also limited to ensure safe and stable operation (SOC constraints). The constraints on charge and discharge power for energy storage devices in each period are as follows:
| (28) |
The operating state parameter for energy storage devices is introduced in the formula, which implicitly stipulates that the same energy storage device cannot be charged and discharged simultaneously within a given time period; thus, the following formula is derived:
| (29) |
The energy stored in the energy storage device at any given moment is dependent on the energy from the previous moment and the device’s charge and discharge power during the current period. The energy stored in the device in region at time is:
| (30) |
where and represent the power of the energy storage device in the current and previous periods, respectively, and is the efficiency of the charge and discharge processes. According to investigation and research, the general value is 95.
To ensure the long-term and good operation of energy storage equipment, manufacturers generally limit the SOC of energy storage batteries to between 10% and 90%. The formula is:
| (31) |
where indicates the rated energy of the energy storage equipment configured in region . By combining it with the above formula, non-decision variables can be eliminated, and the following formula can be obtained:
| (32) |
In addition to meeting the SOC constraints of the energy storage device during each period, for the typical daily load curve, it is also imperative to require that the net output of the energy storage device within a day is 0 [22]. The formula is expressed as:
| (33) |
Substituting into each decision variable, we have the formula:
| (34) |
This study also emphasizes the need to optimize the power and energy configurations of the energy storage equipment, as their costs represent a one-time investment. Amortized over the actual industrial service life of 10 years, the cost of using a single-day energy storage equipment is:
| (35) |
In the formula, represents the energy price of the storage battery, while denotes the power price. Thus, the objective function for optimizing the energy storage device is:
| (36) |
6 Establishment of AHP Measurement System From Different Perspectives
6.1 Establishment of AHP Model
The evaluation indicators include wind power utilization index, regulation capacity index, economic performance index, and environmental friendliness index of the energy storage configuration scheme.
The expression formula of the judgment matrix is:
| (37) |
In the formula, represents the judgment matrix, which is used to judge the evaluation indicators of the scheme layer on the criterion layer, is the number of evaluation indicators, and denote the numbers of each evaluation indicator; is the relative importance of factor to factor , and the relative importance is assigned according to preset rules and satisfies: ; when , .
The evaluation method comprehensively considers the role of energy storage configuration in improving the grid regulation capacity and new energy absorption capacity, as well as the land occupation of energy storage and the cost of recycling the battery energy storage after the service life. Compared with the existing energy storage configuration evaluation method, it is more reasonable and has higher optimization efficiency.
We can use the following formulas to calculate:
| (38) | |
| (39) | |
| (40) | |
| Wind and solar curtailment rate | |
| (41) | |
| (42) | |
| (43) |
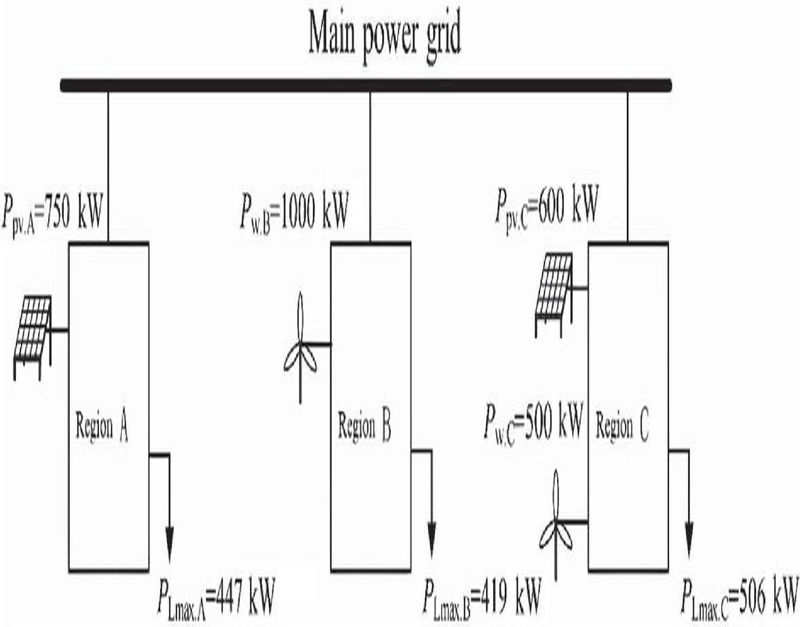
Figure 2 Regional power grid map.
7 Case Study
7.1 Case Description
To verify the effectiveness of the energy storage configuration evaluation method for new energy consumption based on power grid development planning and resource output forecasts, we selected three regions with different characteristics for verification. The established model was verified using real data from these independent regions, and the photovoltaic and wind power utilization rates were independently calculated for each region. Region A is only equipped with photovoltaic power with an installed capacity of 750 kW, and its maximum daily load is 447 kW. Region B relies exclusively on wind power generation with an installed capacity of 1000 kW, and its maximum daily load is 419 kW. Region C combines photovoltaic power generation with an installed capacity of 600 kW and wind power generation with an installed capacity of 500 kW, while its maximum daily load is 506 kW [23]. The grid connection diagram is shown in Figure 2.
First, independently verify the situation when the three regions operate with separate energy storage systems. The first step is to obtain the load power consumption and new energy power generation for regions A, B, and C. When the load power exceeds the combined output of new energy sources, such as wind and photovoltaic power, it becomes necessary to procure electricity from the power grid to ensure power balance [24]. For specific regions, the daily load changes in regions A, B, and C are different. The daily load variations of regions are shown in Figure 3.
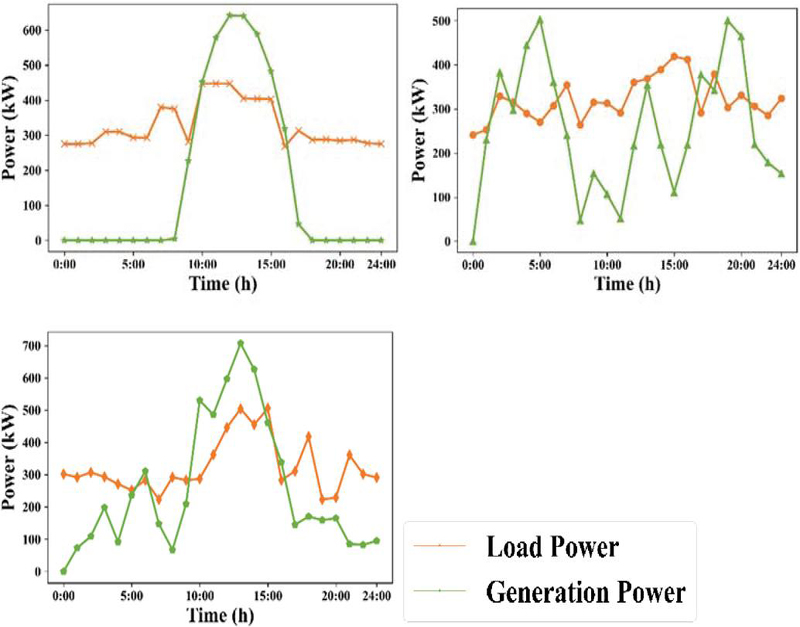
Figure 3 The differences of three regions. (a) Region A power; (b) Region B power; (c) Region C power; (d) Legend image.
7.2 Solution Analysis
To assess the effectiveness of the energy storage configuration evaluation method for new energy consumption, based on power grid development planning and resource output forecast analysis, we conducted a comparative analysis of three regional setting schemes. The comparison schemes are as follows:
Case 1: Parameter calculation for independent operation of region A
Case 2: Parameter calculation for independent operation of region B
Case 3: Parameter calculation for independent operation of region C
After the calculations, the total power purchase, total curtailed power, total supply cost, and average supply cost per unit power for regions A, B, and C are shown in Figure 4.
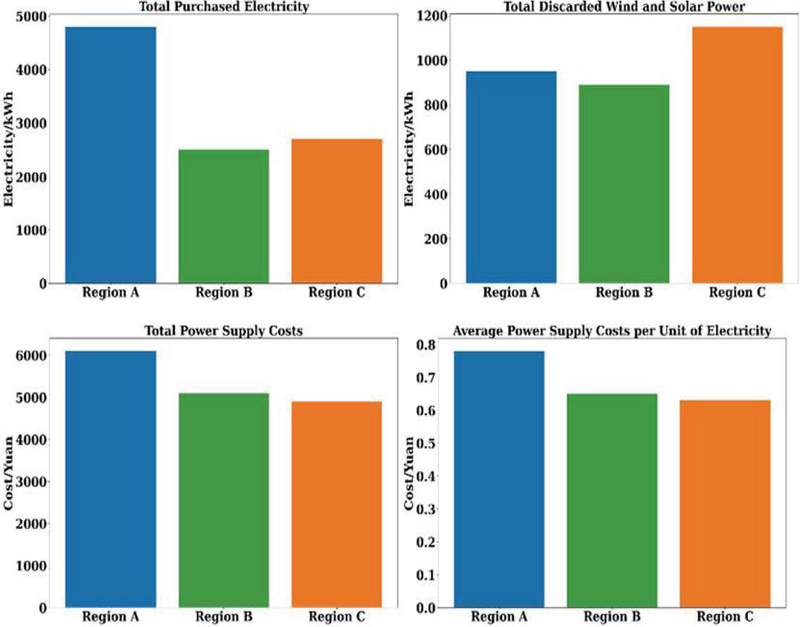
Figure 4 The differences of three regions. (a) Total power purchase; (b) Total curtailed power; (c) Total supply cost; (d) Average supply cost per unit power.
From Figure 4, the power supply cost and the average power supply cost per unit of electricity in area A are relatively high, while areas B and C have relatively low total power supply costs and average power supply costs per unit of electricity. The key factors that cause different economic performance in different regions are: Area A relies on photovoltaic power supply. Affected by sunlight, power supply is primarily concentrated during the daytime, necessitating substantial electricity purchases from the power grid at night; Area C utilizes wind-solar integrated power supply. The power supply and load power are closely aligned, resulting in a minimal power purchase amount and consequently low power supply costs. The factors affecting economic performance are mainly the regional power supply form. For photovoltaic, wind or wind-solar integrated systems, the differences in power supply, power load, abandoned power, and purchased power play a significant role.
The power diagrams of the 24-hour operation of area A are shown in Figure 5.
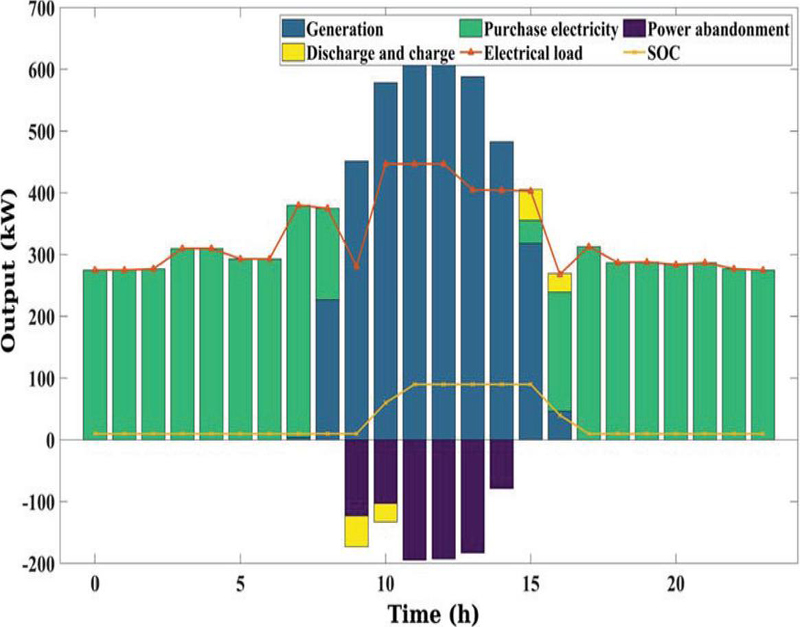
Figure 5 24-hour operation of area A.
The power diagrams of the 24-hour operation of area B are shown in Figure 6.
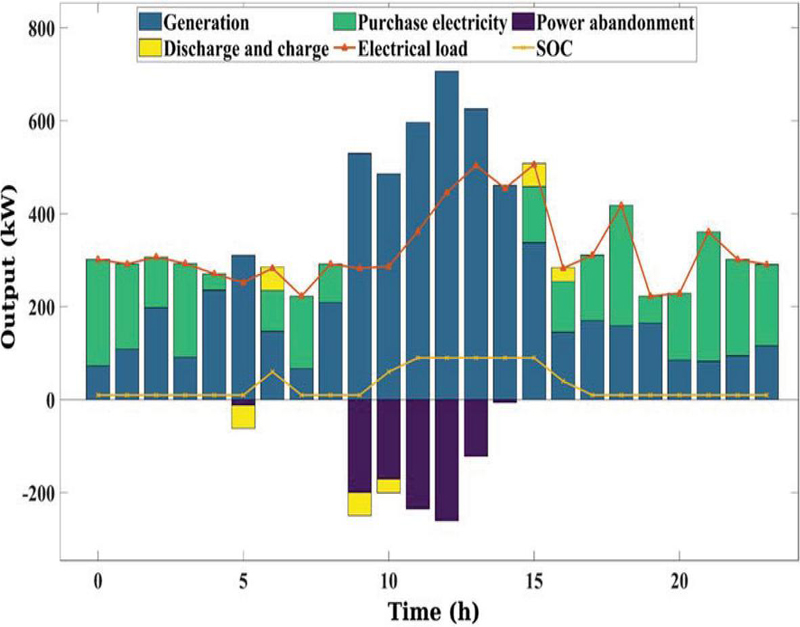
Figure 6 24-hour operation of area B.
The power diagrams of the 24-hour operation of area C are shown in Figure 7.
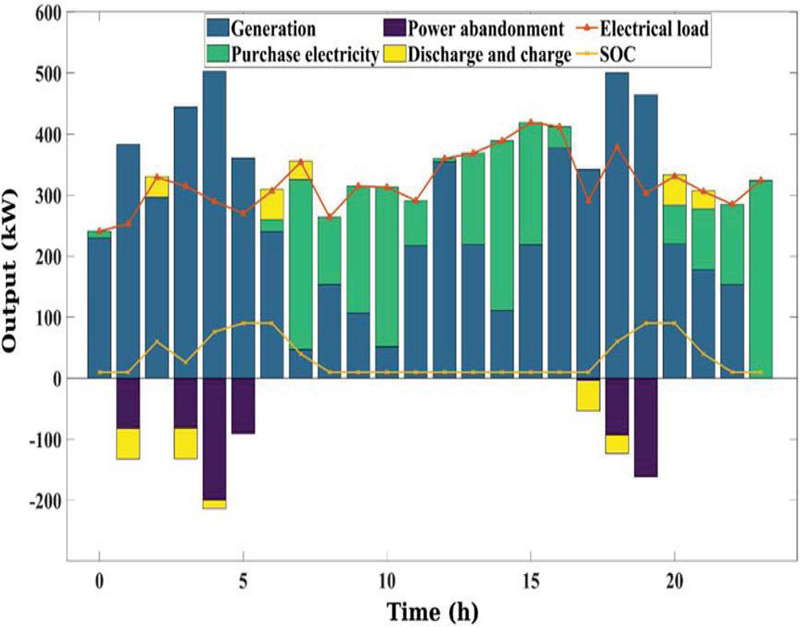
Figure 7 24-hour operation of area C.
The results of Figures 6 and 7 show that after using this method, the power wastage in Areas B and C has been significantly reduced, leading to higher benefits. This indicates that adopting reasonable energy storage configuration and scheduling methods are conducive to improving efficiency [25].
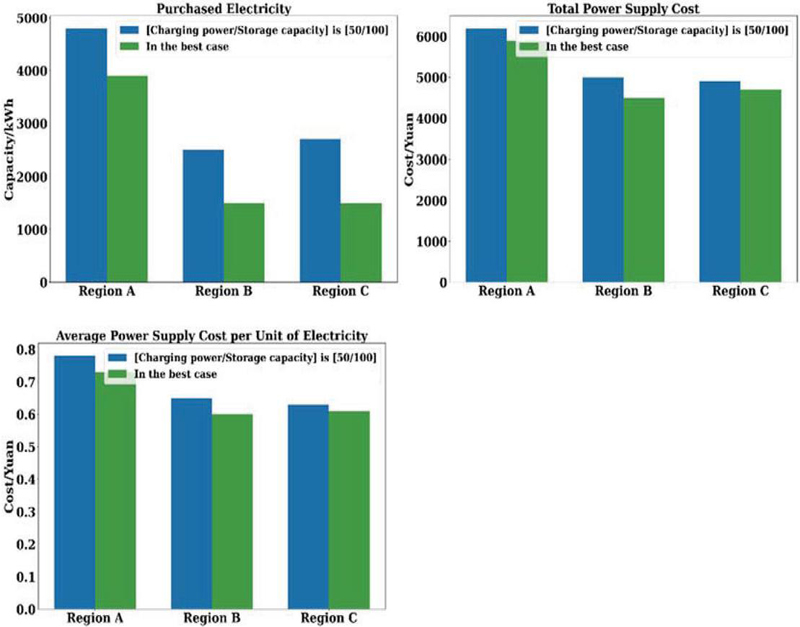
Figure 8 The comparison of different cases. (a) Electricity purchase comparison; (b) Total supply cost comparison; (c) Average supply cost per unit comparison.
7.3 Analysis of the Situation After Adding Energy Storage
By configuring 50 kW/100 kWh energy storage for each of the three regions, we can develop an optimal energy storage operation strategy and power purchase plan on the basis of the energy storage evaluation model.
The operation status after adding energy storage is compared with that before its addition, and the changes in power purchase are shown in Figure 8.
It is evident that the electricity purchased, the amount of wind and solar power abandoned, the total power supply cost, and the average power supply cost per unit of electricity in regions A, B, and C are all lower than the values observed without investment in energy storage devices, indicating an improvement in operational efficiency. The main reason is that by installing a 50 kW/100 kWh energy storage system, excess new energy resources can be stored and subsequently released as a supplement when power generation power is insufficient, thereby reducing the amount of energy purchased from the power grid.
7.4 Model Checking
We test the model accuracy through the loss and MAE of the training set and validation set, respectively. The images are shown below, where the training set loss is displayed.
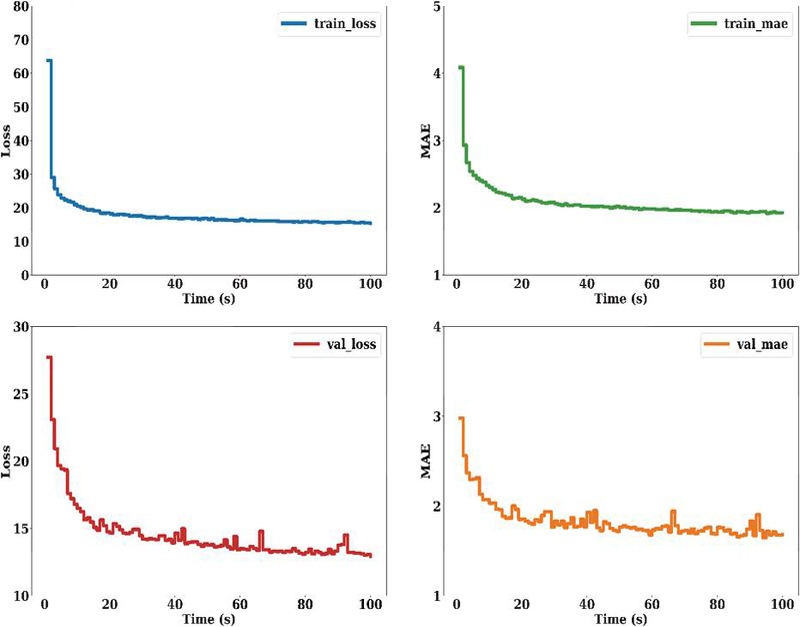
Figure 9 The training set loss. (a) Train-loss; (b) Train-MAE; (c) Val-loss; (d) Val-MAE.
Train-loss, train-MAE, val-loss and val-MAE are all indicators used to measure the effectiveness of the training method [26]. Through the four curves obtained, we can see that as the number of training rounds increases, the curves gradually converge and approach a horizontal state around 100 rounds, which means that the method is well trained at this point and the results obtained are highly credible.
8 Conclusions
As the power industry continues to evolve, new energy sources such as photovoltaics and wind power are advancing rapidly. However, the intermittent, random, and uncertain nature of new energy generation presents significant challenges for system peak regulation and power grid operation. The integration of energy storage will be crucial in facilitating the utilization of new energy.
This study conducts a scientific and comprehensive evaluation of the energy storage configuration method for new power systems with uncertain loads connected to a high proportion of new energy. It aims to provide a reasonable and scientific solution for the subsequent adjustment of energy storage configuration according to the results of the comprehensive evaluation.
The specific technical deficiencies are mainly reflected in: (1) The intermittent and random characteristics of wind power and light power make it difficult to accurately predict power generation. (2) The cost optimization under multi-energy storage access is a difficult goal to achieve, as commonly used tools like multi-linear programming are difficult to apply effectively.
The future development direction of the energy storage configuration evaluation method for new energy consumption based on power grid development planning and resource output forecast analysis will be comprehensive, precise, and intelligent. Comprehensive means the integration of a variety of energy storage technologies, which requires more sophisticated control strategies to minimize costs and operate reasonably. Precision indicates that in the future, the accuracy of power prediction in the energy storage configuration evaluation method will become increasingly critical, requiring more accurate predictions for short-term power generation and load power to enable scientific dispatch and adjustment of energy storage resources. Intelligence suggests using the current booming artificial intelligence and deep learning methods to calculate optimal configuration plans.
We believe that intelligence will be the core focus of the future development direction of this method. By integrating advanced Internet of Things technology, the operating status of the system can be monitored in real time, allowing the integrated management system to perform unified calculations, commands, and dispatches to achieve safe and cost-effective operation.
Acknowledgments
This work is supported by the project “Research on multi-dimensional operation monitoring and prediction of new power system supply guarantee resources and power balance calculation model” funded by State Grid Hebei Electric Power Co., Ltd. (B704JY230067).
Data Availability
The original contributions presented in the study are included in the article; further inquiries can be directed to the corresponding author.
Conflicts of Interest
The authors declare no conflict of interest.
References
[1] J. Qiao, Y. Mi, J. Shen, C. Lu, P. Cai, S. Ma, P. Wang, Optimization schedule strategy of active distribution network based on microgrid group and shared energy storage, Applied Energy 377(2025) 124681. doi: https://doi.org/10.1016/j.apenergy.2024.124681. URL https://www.sciencedirect.com/science/article/pii/S0306261924020646.
[2] A. Cagnano, A. Caldarulo Bugliari, E. De Tuglie, A cooperative control for the reserve management of isolated microgrids, Applied Energy 218 (2018) 256–265. doi: https://doi.org/10.1016/j.apenergy.2018.02.142. URL https://www.sciencedirect.com/science/article/pii/S030626191830285X.
[3] A. Cagnano, E. De Tuglie, P. Mancarella, Microgrids: Overview and guidelines for practical implementations and operation, Applied Energy 258(2020) 114039. doi: https://doi.org/10.1016/j.apenergy.2019.114039. URL https://www.sciencedirect.com/science/article/pii/S030626191931726X.
[4] S. Choudhury, Review of energy storage system technologies integration to microgrid: Types, control strategies, issues, and future prospects, Journal of Energy Storage 48(2022) 103966. doi: https://doi.org/10.1016/j.est.2022.103966. URL https://www.sciencedirect.com/science/article/pii/S2352152X22000147.
[5] S. Obara, Capacity planning of storage batteries for remote island microgrids with physical energy storage with CO2 phase changes, Journal of Energy Storage 102(2024) 114238. doi: https://doi.org/10.1016/j.est.2024.114238. URL https://www.sciencedirect.com/science/article/pii/S2352152X24038246.
[6] Y. Cheng, N. Zhang, B. Zhang, C. Kang, W. Xi, M. Feng, Low carbon operation of multiple energy systems based on energy-carbon integrated prices, IEEE Transactions on Smart Grid 11(2) (2020) 1307–1318. doi: 10.1109/TSG.2019.2935736.
[7] L. Wang, H. Zhao, D. Wang, F. Dong, T. Feng, R. Xiong, Low-carbon economic dispatch of integrated energy system considering expanding carbon emission flows, IEEE Access 12(2024) 104755–104769. doi: 10.1109/ACCESS.2024.3435051.
[8] T. Morstyn, M. Chilcott, M. D. McCulloch, Gravity energy storage with suspended weights for abandoned mine shafts, Applied Energy 239(2019) 201-206. doi: https://doi.org/10.1016/j.apenergy.2019.01.226. URL https://www.sciencedirect.com/science/article/pii/S0306261919302466.
[9] A. Rathore, N. Patidar, Optimal sizing and allocation of renewable based distribution generation with gravity energy storage considering stochastic nature using particle swarm optimization in radial distribution network, Journal of Energy Storage 35(2021) 102282. doi: https://doi.org/10.1016/j.est.2021.102282. URL https://www.sciencedirect.com/science/article/pii/S2352152X21000463.
[10] A. Emrani, A. Berrada, M. Bakhouya, Optimal sizing and deployment of gravity energy storage system in hybrid PV-wind power plant, Renewable Energy 183 (2022) 12–27. doi: https://doi.org/10.1016/j.renene.2021.10.072. URL https://www.sciencedirect.com/science/article/pii/S0960148121015317.
[11] M. Tawalbeh, S. Z. Murtaza, A. Al-Othman, A. H. Alami, K. Singh, A. G. Olabi, Ammonia: A versatile candidate for the use in energy storage systems, Renewable Energy 194 (2022) 955–977. doi: https://doi.org/10.1016/j.renene.2022.06.015. URL https://www.sciencedirect.com/science/article/pii/S0960148122008473.
[12] L. Ge, B. Zhang, W. Huang, Y. Li, L. Hou, J. Xiao, Z. Mao, X. Li, A review of hydrogen generation, storage, and applications in power system, Journal of Energy Storage 75 (2024) 109307. doi: https://doi.org/10.1016/j.est.2023.109307. URL https://www.sciencedirect.com/science/article/pii/S2352152X2302705.
[13] S. S. Hosseini Dehshiri, B. Firoozabadi, A multidisciplinary approach to select wind turbines for power-hydrogen production: Energy, exergy, economic, environmental under uncertainty prediction by artificial intelligence, Energy Conversion and Management 310 (2024) 118489. doi: https://doi.org/10.1016/j.enconman.2024.118489. URL https://www.sciencedirect.com/science/article/pii/S0196890424004308.
[14] S. S. Hosseini Dehshiri, B. Firoozabadi, Comprehensive framework on wind energy: A sustainable site selection under uncertainty and reliability, layout optimization and analysis, Applied Energy 373 (2024) 123937. doi: https://doi.org/10.1016/j.apenergy.2024.123937. URL https://www.sciencedirect.com/science/article/pii/S0306261924013205.
[15] Z. Fu, W. Lin, D. Yang, Intelligent control of an integrated energy system: Low carbon modeling and intelligent optimization, in: 2024 6th International Conference on Electronic Engineering and Informatics (EEI), 2024, pp. 660–665. doi: 10.1109/EEI63073.2024.10696410.
[16] Z. Yuan, H. Zhang, X. Zhang, X. Tian, H. Cheng, Joint clearing model of electricity-carbon coupling market based on unified bidding trading pattern, in: 2024 9th Asia Conference on Power and Electrical Engineering (ACPEE), 2024, pp. 311–316. doi: 10.1109/ACPEE60788.2024.10532286.
[17] M. A. Hellalbi, A. Bouabdallah, Elaboration of a generalized mixed model for the wind speed distribution and an assessment of wind energy in Algerian coastal regions and at the capes, Energy Conversion and Management 305 (2024) 118265. doi: https://doi.org/10.1016/j.enconman.2024.118265. URL https://www.sciencedirect.com/science/article/pii/S0196890424002061.
[18] Q. Zhang, B. Lin, The effect of energy efficiency retrofits on radical innovation: From the perspective of supply chain, Energy 311 (2024) 133362. doi: https://doi.org/10.1016/j.energy.2024.133362. URL https://www.sciencedirect.com/science/article/pii/S0360544224031384.
[19] B. Elfarra, R. Yasmeen, W. U. H. Shah, The impact of energy security, energy mix, technological advancement, trade openness, and political stability on energy efficiency: Evidence from Arab countries, Energy 295 (2024) 130963. doi: https://doi.org/10.1016/j.energy.2024.130963. URL https://www.sciencedirect.com/science/article/pii/S0360544224007357.
[20] D. Vatau, S. Musuroi, C. Barbulescu, M. Babescu, PV systems modeling and optimal control, Energy Conversion and Management 84 (2014) 448–456. doi: https://doi.org/10.1016/j.enconman.2014.04.032. URL: https://www.sciencedirect.com/science/article/pii/S0196890414003367.
[21] H. Amiry, M. Benhmida, R. Bendaoud, C. Hajiaj, S. Bounouar, S. Yadir, K. Rais, M. Sidki, Design and implementation of a photovoltaic IV curve tracer: Solar modules characterization under real operating conditions, Energy Conversion and Management 169 (2018) 206–216. doi: https://doi.org/10.1016/j.enconman.2018.05.046. URL https://www.sciencedirect.com/science/article/pii/S0196890418305235.
[22] R. Bendaoud, H. Amiry, M. Benhmida, B. Zohal, S. Yadir, S. Bounouar, C. Hajjaj, E. Baghaz, M. El Aydi, New method for extracting physical parameters of PV generators combining an implemented genetic algorithm and the simulated annealing algorithm, Solar Energy 194 (2019) 239–247. doi: https://doi.org/10.1016/j.solener.2019.10.040. URL https://www.sciencedirect.com/science/article/pii/S0038092X19310345.
[23] M. Yaghoubi, M. Eslami, M. Noroozi, H. Mohammadi, O. Kamari, S. Palani, Modified salp swarm optimization for parameter estimation of solar PV models, IEEE Access 10 (2022) 110181–110194. doi: 10.1109/ACCESS.2022.3213746.
[24] Xu, Z., Wang, B., Xiang, K., Li, X., and Liu, W. (2024). Photovoltaic Maximum Power Point Tracking Technology Based on Power Prediction Algorithm Combined with Variable Step Length Disturbance Observation Method. Distributed Generation & Alternative Energy Journal, 39(04), 851–874. https://doi.org/10.13052/dgaej2156-3306.3948.
[25] Guo, Z., Cai, Y., Huang, S., Jiang, Z., and Guan, K. (2024). Research on Electricity Balance and Measurement Optimization of New Energy Power System Considering Renewable Energy Consumption Mechanism. Distributed Generation & Alternative Energy Journal, 39(03), 483–506. https://doi.org/10.13052/dgaej2156-3306.3935.
[26] Sarma S, S., Sarada, K., Jithendar, P., Maddileti, T., and Kumar, G. N. K. (2023). A Deep Learning Based Enhancing the Power by Reducing the Harmonics in Grid Connected Inverters. Distributed Generation & Alternative Energy Journal, 39(01), 137–164. https://doi.org/10.13052/dgaej2156-3306.3916.
Biographies
Guozhen Ma, Chief Expert at State Grid Corporation of China, is a Level 5 staff member at the Energy Development Research Center of the Economic and Technological Research Institute of State Grid Hebei Electric Power Company. He holds the title of Senior Economist and has long been engaged in research on energy and electricity economics, with a primary focus on big data analysis and applications in the electricity sector.
Shiyao Hu, the deputy director of the Energy Development Research Center of the Economic and Technological Research Institute of State Grid Hebei Electric Power Company, is a senior engineer who has been engaged in power grid planning work for a long time, with a primary research focus on distribution network planning.
Yunjia Wang, a specialist at the Energy Development Research Center of the Economic and Technological Research Institute of State Grid Hebei Electric Power Company, is an engineer who has been engaged in power grid planning work for a long time, with a primary research focus on digital technology in power grids.
Ning Pang, a specialist at the Energy Development Research Center of the Economic and Technological Research Institute of State Grid Hebei Electric Power Company, is a senior engineer engaged in power grid planning and design work for a long time, with a primary research focus on big data analysis and applications in electricity.
Junyi Yu, a technician at Wuhan Longde Control Technology Co., Ltd., has been engaged in energy and power optimization work for an extended period. His primary research focus is on the optimization analysis and application of power systems.
Distributed Generation & Alternative Energy Journal, Vol. 39_6, 1125–1152.
doi: 10.13052/dgaej2156-3306.3962
© 2025 River Publishers