Research on Overvoltage Monitoring Technology for Distributed New Energy Intelligent Stations
Zhidu Huang1, Longfei Zhang1, 2, Wei Huang1, 2, Shan Li1, 2 and Yajuan Chen3,*
1Power Grid Electric Power Research Institute of Guangxi, Nanning 530023, China
2Guangxi Key Laboratory of Intelligent Control and Maintenance of Power Equipment, Electric Power Research Institute of Guangxi Power Grid Co. Ltd, Nanning 530023, China
3Nanning Power Supply Bureau of Guangxi Power Grid Co., Ltd, Nanning 530023, China
E-mail: ngjdbh@163.com
*Corresponding Author
Received 27 November 2024; Accepted 11 January 2025
Abstract
Distributed renewable energy sources such as wind, solar, and small hydropower of the new distribution network are mainly connected to the grid through distribution lines, which are susceptible to lightning overvoltage. Therefore, this paper conducts a lightning risk assessment of the active distribution network system, including the photovoltaic (PV) side and the line-side. The study analyzes the effectiveness of two lightning protection measures: strengthening insulation and installing lightning arresters in the new distribution network. Strengthening insulation involves enhancing the first three towers and all line towers. However, the results show that both methods cannot effectively reduce the lightning failure rate on the PV-side and may even lead to adverse effects. Additionally, the analysis of in stalling lightning arresters reveals that installing them on the first-level towers of the distribution line can significantly reduce the impact of lightning on both the line and PV-sides. In particular, installing lightning arresters simultaneously on the first three towers closest to the PV-side can drastically reduce the overall lightning trip rate on the line-side.
Keywords: New energy, new distribution network, lightning hazard assessment, lightning protection measurement.
1 Introduction
The integration of renewable energy sources such as wind, solar, and small hydropower, which are currently widely distributed, primarily occurs through distribution networks, allowing for local generation and consumption. In regions where renewable energy is integrated into the distribution network, harsh environmental conditions, particularly lightning overvoltages, have a significant impact on these modern distribution systems [1, 2]. Consequently, it is imperative to conduct a lightning risk assessment in active distribution networks.
The assessment encompasses two main components: the photovoltaic (PV) side and the line-side. PV-side comprises multiple distributed photovoltaic power sources in the same active distribution system. Due to negligible differences in geographical location and hardware parameters between these distributed PV sources, they are typically considered as a single equivalent unit. For the PV-side of an active distribution system, the parallel connection of user PV systems is monitored for voltage conditions to detect lightning faults. The PV system’s total flashover rate is calculated based on lightning-induced flashovers anywhere on the line-side. By combining this with the system’s total power generation and average outage duration, the annual average rate of energy damage caused by lightning is computed, serving as the standard for evaluating lightning risk on the PV-side [3]. For the line-side of an active distribution network (ADN), lightning strikes (LSs) may occur either on the tower or in the middle of the span, and the lightning protection configuration of each tower is interconnected. For instance, the tower closest to the PV system is typically equipped with an arrester, which results in variations in lightning protection performance between different towers. Hence, it is necessary to calculate the lightning risk for each tower individually [4, 5].
The interaction between the PV-side and the line-side in ADN reveals that when a lightning strike occurs on one side, the other side also faces a flashover risk. Therefore, for comprehensive risk assessment, the impact of LSs on both the line and PV-sides should be considered. For example, according to modeling and analysis: if a lightning strike occurs at Tower No1 on the line-side or further along the line, it is unlikely to cause a fault on the PV-side [6, 7]. As a result, in the overall ADN, the towers where LSs affect both the PV and line-sides simultaneously are at higher risk [8].
Table 1 Key steps in the ADN lightning strike risk assessment model
| Step | Main Actions | Output/Significance |
| 1. Modeling | Establish a simulation model (e.g., in ATP-EMTP) that includes both PV-side modules and line-side modules. | Provides the foundational platform for lightning strike simulations, enabling the analysis of overvoltage and flashover conditions under different strike scenarios. |
| 2. Data Input | Input parameters such as lightning current amplitude, strike points (tower or mid-span), ground flash density, transformer data, and PV system characteristics. | Determines the PV self-fault rate, line-side insulator flashover rate, and the overall fault rate considering the interaction between the PV-side and line-side. |
| 3. Risk Quantification | Combine flashover statistics of individual towers, average line outage rates, annual energy loss on the PV-side, etc. Rate towers and the PV system according to their risk. | Quantifies the overall lightning risk for the ADN, providing a reference for subsequent risk mitigation and protection strategy decisions. |
The research considers the lightning overvoltage monitoring and warning methods and protection technologies for new distribution stations under the integration of new energy (such as wind, solar, water storage, etc.), with a focus on analyzing the evaluation risk calculation methods and protection measures for introducing overvoltage technologies on the new energy side.
To systematically evaluate the lightning risk in Active Distribution Networks (ADNs), a three-step methodology is employed. As Table 1 shows, these steps include (1) Modeling, (2) Data Input, and (3) Risk Quantification, which together form the foundational framework for analyzing lightning-induced failures and trips in ADNs.
Throughout the paper, two terms – “Lightning Strike Failure Rate” (also referred to as “Lightning Fault Rate”) and “Lightning Trip Rate” – are frequently used. To ensure clarity, their definitions and distinctions are summarized in Table 2.
Table 2 Terminology clarification
| Term | Definition & Explanation |
| Lightning Strike Failure Rate (also “Lightning Fault Rate”) |
– Definition: The annual number (occurrences/year) of system failure events caused by either direct or induced lightning strikes. – Explanation: This term typically accounts for both line-side and PV-side failures. When we refer to the system’s overall reliability under lightning conditions, we focus on how often lightning events result in system faults. |
| Lightning Trip Rate |
– Definition: The annual number (occurrences/year) of protective device operations (e.g., circuit breakers) triggered by lightning-induced overvoltages or flashovers. – Explanation: This term specifically reflects how frequently protection devices respond by tripping, indicating the system’s protective action frequency due to lightning. |
2 Lightning Hazard Assessment Model for New Distribution Networks
Currently, many scholars and experts in China are conducting risk assessments of lightning hazards in new types of distribution networks [9, 10]. By combining the lightning trip rates of the photovoltaic (PV) and line-sides, they assess the lightning risk at key nodes within the PV system. The analysis reveals that when LSs occur on either the PV-side or the line-side, the grid-connected transformer is not damaged. However, a lightning surge wave may pass through the transformer, so transformer damage does not need to be considered in the risk assessment. The transformer is still represented using the XFMR model. The risk assessment process for active distribution systems is shown in Figure 1.
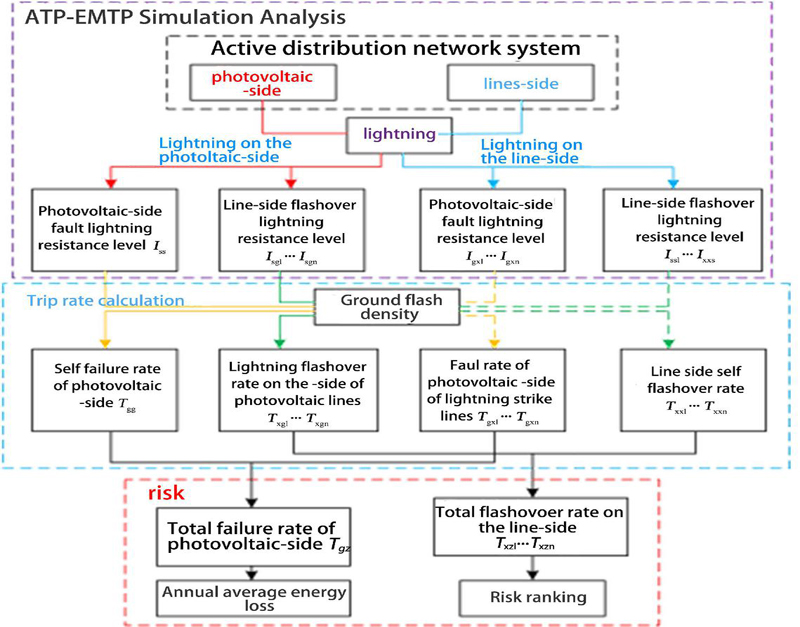
Figure 1 Risk assessment process.
The interplay between the PV-side and the line-side within the ADN means LSs on one side can cause flashovers on the other. Consequently, towers experiencing lightning-induced faults on both the PV-side and the line-side exhibit elevated lightning risk. The risk assessment of ADN is segmented into three primary steps. Firstly, a lightning strike simulation model is established in ATP-EMTP, encompassing both PV and line modules. Key system nodes are selected for simulation to determine fault lightning withstand levels on the PV-side and flashover lightning withstand levels on the line-side under various lightning strike scenarios. Secondly, integrating ground flash density data with the line tower characteristics, we calculate the PV-side self-fault rate, line-side flashover rate, and the combined rates when the PV-side is struck by lightning. Thirdly, the calculated lightning flashover rates are aggregated to determine the total rates for each tower on both the PV-side and the line-side. These rates are then used to quantify the overall lightning risk of the ADN. For the line-side risk assessment, we adopt the lightning risk evaluation method of the main network, which assesses each tower’s risk based on the average lightning trip rate of the entire line. The detailed classification standards are presented in Table 3.
Table 3 Classification standards for lightning hazard risk levels
| Trip rate interval | 0TR0.5Pr | 0.5PrTRPr | PrTR1.5Pr | 1.5PrTR |
| Risk level | A | B | C | D |
In this context, TR refers to the total number of trip events for a tower, which is the sum of the trips caused by the tower itself and the trips triggered by LSs on the PV-side affecting the line towers. Pr represents the average number of lightning-induced trips across the entire line. It is calculated as the total number of lightning-induced trips for all towers on the line divided by the total number of towers. Towers are classified into different risk categories based on this metric: towers in the A-level risk are considered low-risk, those in the B-level risk are considered medium-risk, towers in the C-level risk are high-risk, and towers in the D-level risk are categorized as very high-risk [13].
To clarify the simulation setup, this study adopts a ground flash density presentative of the local meteorological conditions, ensuring that both the high-incidence and low-incidence lightning seasons are covered in the analysis. The line model parameters, such as tower grounding resistance and conductor geometry, are drawn from typical distribution network configurations. In the simulations, we consider both direct lightning strikes on the tower (including top and mid-span strikes) and indirect (induced) lightning strikes. The lightning current amplitude ranges from moderate (around 2 kA) to high (up to 100 kA) to account for different stroke intensities. Standard 8/20 s double-exponential waveforms are used to approximate typical lightning surge shapes. These parameter settings enable a thorough assessment of various lightning scenarios and their impacts on both the line-side and the PV-side.
3 Analysis of Installing Lightning Protection Wires in New Distribution Networks
After installing lightning protection wires on the distribution line-side, the system’s ability to withstand Lightning Strikes (LSs) will be significantly enhanced, and the probability of direct LSs to the towers will greatly decrease. When a tower is struck by lightning, the lightning current can quickly be discharged to the ground through the protection wires, thereby reducing the amplitude of the surge wave transmitted to the PV-side.
Thus, it is proposed to install lightning protection wires on the seventh tower, the one closest to the PV system, and simulate the lightning characteristics of the system under this configuration [14]. Conducting lightning strike characteristic simulations for the active distribution system with installed lightning rods, the calculated lightning resistance level for the photovoltaic side is approximately 0.5 kA. The specific results are shown in Table 2. As shown in Figure 2, after the installation of the lightning protection wires, LSs on the line-side will still have an impact on the PV-side. The influence of the lightning surge wave from the PV-side on the three towers closest to the PV system is reduced. This means that when a lightning strike occurs on the PV-side, it can still cause trips on the line-side, but the lightning withstand level of the line-side has improved compared to before [15, 16].
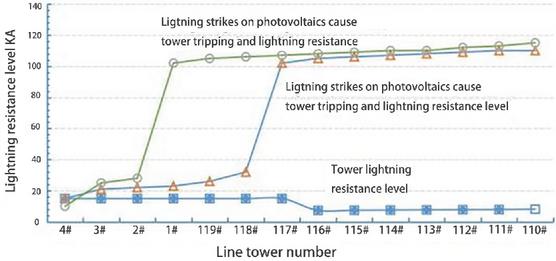
Figure 2 Lightning fault rate of an active distribution system with added lightning protection wires.
Segments devoid of lightning protection wires maintain their inherent lightning resistance. Specifically, Towers No. 110-116 exhibit a backflash withstand level of 7.4 kA and a direct lightning strike withstand level of 1 kA. LSs on these segments do not impact the PV-side nor are they influenced by PV-side lightning surge waves. Based on tower-specific ground flash density data, the calculated lightning fault rate of the PV system is illustrated in Figure 2. Direct LSs on the PV-side contribute to a fault rate of approximately 0.1025 occurrences per year. The additional lightning risk from the distribution line-side increases the total PV-side fault rate by 0.0098 occurrences per year (9.56%), which is slightly lower than the rate without lightning protection (an increase of 0.0107 occurrences per year, or 10.43%). Consequently, the overall PV-side lightning fault rate is 0.1123 occurrences per year. Regarding the line-side, the total trip rate is 0.1935 occurrences per year. Compared to 0.2891 occurrences per year without any lightning protection measures, the total number of lightning-induced trips decreases by 33.07%.
According to the calculated trip rate of the distribution line-side and the fault rate of the PV-side, the overall effect of adding lightning protection wires on the line-side is moderate, offering almost no protection to the PV-side. The failure rate due to direct LSs on the PV-side is approximately 0.1025 occurrences per year. The inclusion of lightning risk from the distribution line-side increases the total lightning-induced failure rate by 0.01 occurrences per year (9.56%), which is slightly lower than the rate without lightning protection (an increase of 0.0107 occurrences per year, or 10.43%). The total lightning-induced failure rate on the PV-side is 0.1123 occurrences per year. The total trip rate on the line-side is 0.1935 occurrences per year, representing a 33.07% reduction compared to the rate of 0.2891 occurrences per year observed without lightning protection measures. Therefore, the overall effect of installing lightning protection wires on the line-side is average, with negligible protection for the PV-side.
4 Analysis of Insulation Enhancement in New Distribution Networks
4.1 Strengthening the First Three Towers
To enhance the lightning protection capability of the line-side, the insulation of the line-side will be improved, increasing the U50% of the line insulators from 100 kV to 200 kV. This enhancement will inevitably strengthen the line-side’s resistance to LSs, making it more difficult for the system to trip under the same amplitude of lightning current. However, this improvement may also increase the lightning risk for the PV-side. Specifically, without enhanced insulation, LSs on the line-side are more likely to cause insulation flashovers, allowing lightning currents to be discharged to the ground. With improved insulation, the amplitude of the lightning waves that invade the PV-side may increase. Moreover, prior to the insulation upgrade, the lightning surge impacting the PV-side would affect the closest three towers. Thus, it is crucial to determine the appropriate level of insulation enhancement required to ensure that LSs on the PV-side do not cause trips on the line-side [17, 18].
The adverse impact of enhanced insulation on the photovoltaic (PV) side arises primarily due to the redistribution of lightning surge currents. When insulation is strengthened, the likelihood of flashover on the line-side towers decreases significantly, resulting in a higher proportion of the lightning current being directed toward the PV-side. This increases the amplitude of the lightning surge wave impacting the PV system, thereby raising its fault rate. In the simulation model, this effect is partially reflected by the increased lightning-induced fault rate on the PV-side when insulation is strengthened. However, the model assumes a uniform distribution of lightning currents among connected towers and does not fully account for localized surge amplification effects near the PV system. Consequently, the adverse impact may be underestimated in the current simulation.
The insulators on the line-side will be replaced, raising their U50% from 100 kV to 200 kV, and simulations will be conducted to analyze their lightning characteristics. The calculation model is illustrated in Figure 3.
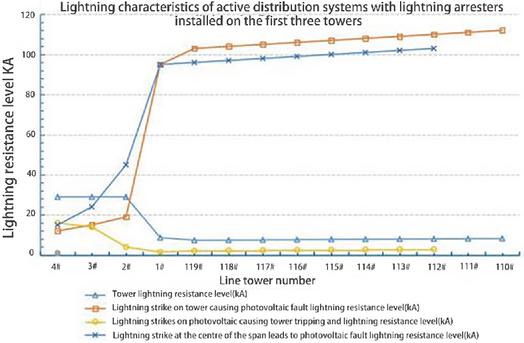
Figure 3 Lightning characteristics of an active distribution system with enhanced insulation on three towers.
Simulations of lightning characteristics in the upgraded ADN indicate that the lightning withstand level for strikes on the PV-side is approximately 0.5 kA. The withstand levels for strikes directly on the distribution line and the mutual influence between the PV-side and the line-side were also assessed. Following the insulation upgrade, the lightning withstand level of the modified towers increased significantly from 7.4 kA to 13.5 kA, while the withstand level at the midpoint of the spans increased from 1 kA to 2 kA, showing minimal change. However, the withstand levels of other towers compared to the situation without lightning protection measures decreased slightly.
Similarly, the decrease in the lightning withstand level for strikes at the midpoint of the line spans, leading to faults on the PV-side, can be attributed to the reduced withstand level, which is now lower than the trip level for the line-side itself [19, 20].
The number of trips on the line-side towers caused by LSs on the PV-side increased from the closest three towers to four towers. This is primarily due to the same reasoning: after the insulation enhancement of Tower No. 3, it can tolerate higher lightning overvoltages before experiencing flashovers, while Tower No. 4 is more prone to flashovers under the same conditions, resulting in Tower No. 3 remaining insulated [21]. LSs on towers 4#-1# and 119# are more likely to cause faults on the photovoltaic side. The main reason is that under the same amplitude of lightning current intrusion conditions, the line-side should have prioritized flashover, but after strengthening insulation, the tower on the line-side can withstand higher amplitude lightning current intrusion. The number of tower trips caused by LSs on the photovoltaic side of the transmission line has increased from the original three levels closest to the photovoltaic side to four levels. It can be found that the lightning resistance level of the distribution line flashover caused by LSs on the photovoltaic side has overall increased, but the lightning resistance level of Tower No. 4 is lower than that of Tower No. 3. The main reason is the same as before, t after strengthening the insulation of Tower No. 3, Tower No. 4 has to withstand higher lightning overvoltage before flashover occurs, which leads to the phenomenon of Tower No. 4 flashover and Tower No. 3 still maintaining insulation. Based on the above data, it can be concluded that it is not recommended to improve the lightning protection capability of active distribution systems by strengthening the insulation of the first three towers, as it may have the opposite effect.
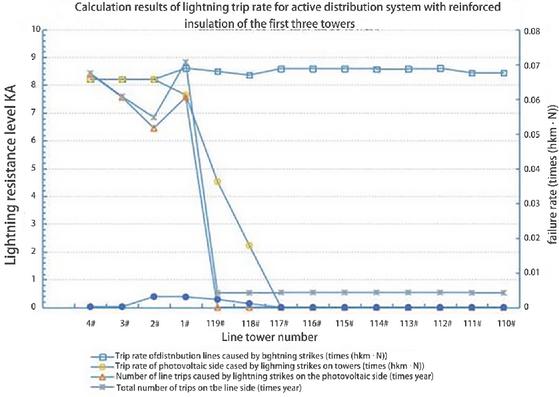
Figure 4 Lightning trip-out rate of an active distribution system with enhanced insulation on the first three towers.
Combining the ground flash density information for each tower, the calculated lightning fault rate for the PV system is shown in Figure 4. The fault count caused by direct LSs on the PV-side is 0. 1025 occurrences per year. Due to the influence of LSs on the line-side, the total number of lightning-induced trips has increased by 0.01 occurrences per year (9.76%), resulting in a total of 0.1125 occurrences per year. Overall, there has not been a significant change in the lightning fault rate on the PV-side.
To prevent the line-side from being impacted by lightning risks from the PV-side, further enhancement of the insulation strength of the line-side insulators is necessary. Simulation calculations indicate that when a lightning current with an amplitude of 100 kA strikes the PV-side, the maximum overvoltage peak on the insulator of the first line-side tower reaches approximately 1.4 MV, while it reaches about 1.33 MV on the second tower and about 1.25 MV on the third tower. Therefore, it is nearly impossible to ensure that the line-side insulators remain unaffected by LSs on the PV-side through an increase in their withstand levels [22].
In order to protect the line-side from the risk of LSs on the photovoltaic side, it is necessary to further increase the insulation strength of the line-side insulators. According to simulation calculations, when a lightning current with an amplitude of 100 kA strikes the photovoltaic side, the maximum peak overvoltage appearing on the insulator of the first stage tower on the line-side is about 1.4 MV, the maximum peak overvoltage appearing on the insulator of the second stage tower on the line-side is about 1.33 MV, and the maximum peak overvoltage appearing on the insulator of the third stage tower on the line-side is about 1.25 MV. Therefore, it is almost impossible to strengthen the voltage resistance level of the line-side insulators to prevent them from being affected by the invasion wave of LSs on the photovoltaic side. The insulators on the line-side will be replaced, and the lightning characteristics will be simulated, as shown in Figure 5.
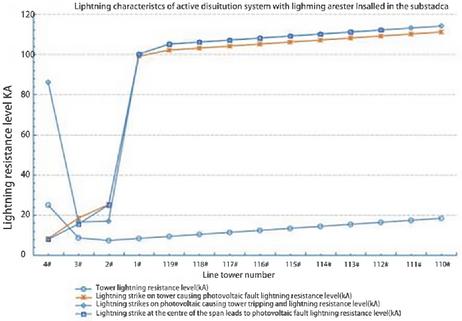
Figure 5 Lightning characteristics of an active distribution system with enhanced insulation across the entire line.
Combining the ground flash density information for each tower, the fault rate for the PV system is shown in Figure 6. The fault count caused by direct lightning strikes on the PV-side is 0.1025 occurrences per year. Due to the influence of LSs on the line-side, the total lightning fault count has increased by 0.0107 occurrences per year (10.43%), resulting in a total fault count of 0. 1132 occurrences per year. The total trip rate for the line-side is 0.2275 occurrences per year, which represents a decrease of 21.3% compared to the 0.2891 occurrences per year without any lightning protection measures.
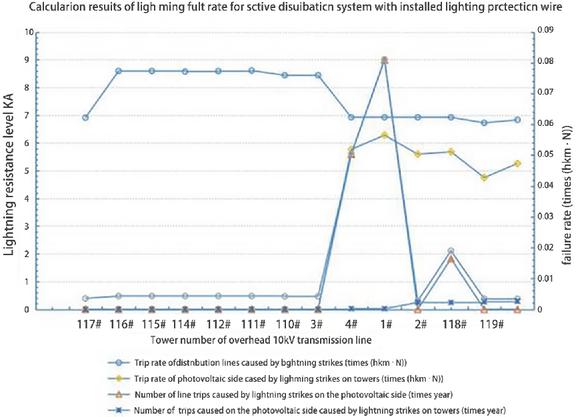
Figure 6 Lightning trip-out rate of an ADN with enhanced insulation across the entire line.
Comparing the effects of enhancing only the insulation of the first three towers, it can be observed that after enhancing the insulation across all towers, it is observed that the total lightning trip rate on the line-side decreases. However, there has been a slight increase in the lightning fault rate for the PV-side. This is primarily because, after enhancing the insulation on the line-side, a discharge path for the lightning current has not been provided. Consequently, when lightning current invades the line, if the tower insulators do not flash over, more lightning current propagates towards the PV-side. As a result, more lightning current propagates towards the PV-side when the tower insulators do not flash over, leading to a decreased lightning withstand level and an increased fault rate on the PV-side compared to the scenario without insulation modifications. Therefore, a comprehensive analysis suggests that enhancing insulation alone is not recommended as a measure to improve the lightning protection capability of the ADN.
The annual fault rate due to LSs on photovoltaics is 0.1025. Due to the influence of LSs on the line-side, the total annual lightning fault rate increases by 0.0107 (10.43%), resulting in a total of 0.1132 faults per year. The total number of trips on the line-side is 0.2275 times per year, which is a decrease of 21.3% compared to 0.2891 times per year without lightning protection measures installed. When comparing the effect of strengthening the insulation of only the first three towers with that of strengthening the entire line, it is observed that the total lightning trip rate on the line-side decreases. However, the lightning fault rate on the PV-side experiences a slight increase. The main reason is that after strengthening the insulation on the line-side, no discharge channel for lightning current is provided. Similarly, in the case of lightning current invading the line, the tower insulators do not flashover, causing more lightning current to propagate to the photovoltaic side. As a result, the lightning resistance level of the PV-side decreases to some extent compared to the scenario without insulation modification, thereby increasing the lightning fault rate on the PV-side. Therefore, it is not recommended to use strengthened insulation alone as a measure to enhance the lightning protection capability of ADN.
5 Analysis of Installing Lightning Arresters in New Distribution Networks
5.1 District Lightning Arresters
The current capacity of the lightning arrester is 5 kA; the towers equipped with lightning arresters can provide a certain level of lightning protection, although they cannot completely guarantee that the line will not trip. The following analysis involves installing a lightning arrester on the first line-side tower and calculating the lightning characteristics. Simulations conducted for the active distribution system with the installed district lightning arrester indicate that the lightning withstand level for strikes on the PV-side is approximately 0.5 kA, as shown in Figure 7.
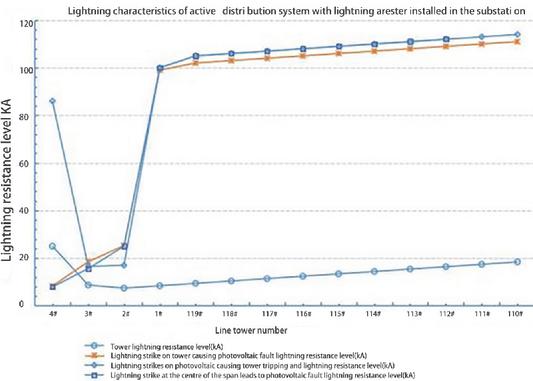
Figure 7 Lightning characteristics of an active distribution system with lightning arresters installed.
From Figure 7 it can be observed that after installing the district lightning arrester, the lightning withstand level of the current tower has significantly improved. However, the increase in the lightning withstand level for adjacent towers and the central span of the line is relatively small. The current tower is nearly unaffected by lightning strikes from the PV-side. Although installing a lightning arrester on the first line-side tower does not directly protect the PV-side from faults, it significantly reduces the impact of LSs on the line-side on the PV-side. The total trip rate for the line-side is now 0.1956 occurrences per year, which represents a decrease of 34.37% compared to the 0.2891 occurrences per year without any lightning protection measures.it can be observed that installing lightning arresters improves the lightning protection effectiveness of the current tower to some extent, primarily by reducing the impact of lightning-induced surges from the PV-side. Therefore, to completely avoid the influence of LSs on the PV-side affecting the line-side, the following analysis will examine the protective effects of installing lightning arresters on the three towers closest to the PV-side.
5.2 Installation of Lightning Arresters on the First Three Towers
Lightning arresters will be installed on the first three line-side towers, and their lightning characteristics will be simulated and calculated. The simulation results for the active distribution system with lightning arresters installed on the three towers indicate that the lightning withstand level for strikes on the PV-side is approximately 0.5 kA, as shown in Figure 8.
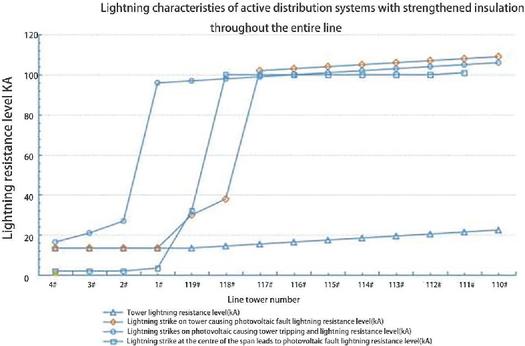
Figure 8 Lightning characteristics of an active distribution system with lightning arresters installed.
From Figure 8, it can be seen that after installing the lightning arresters, the lightning withstand level of the current tower has significantly improved. However, the increase in the lightning withstand level for adjacent towers and the central span is relatively small. The current tower is nearly unaffected by LSs from the PV-side. The fault count caused by direct LSs on the PV-side is 0.1025 occurrences per year. Due to the influence of LSs on the line-side, the total lightning fault count has increased by 0.003 occurrences per year (2.9%), resulting in a total fault count of 0.1055 occurrences per year. This represents a slight increase compared to when only the first line-side tower had a lightning arrester installed, but overall, the change is minimal and can be considered negligible. The total trip rate for the line-side is now 0.0491 occurrences per year, which is a reduction of 83% compared to the 0.2891 occurrences per year without any lightning protection measures.
6 Conclusion
The integration of renewable energy sources into new distribution networks exposes them to the threat of lightning overvoltages, necessitating a comprehensive lightning risk assessment. This assessment process includes both the PV-side and the line-side, which influence each other and must be considered together. While the installation of lightning rods may improve lightning protection, its effect on the PV-side is limited, primarily reducing the trip rates on the line-side. Therefore, various lightning protection measures should be integrated into the planning and operation of new distribution networks to ensure stable system performance.
This study analyzed the effectiveness of two lightning protection measures – enhanced insulation and the installation of lightning arresters – through simulation calculations. The results indicate that enhancing insulation does not effectively reduce lightning fault rates on the PV-side and may even lead to counterproductive outcomes; thus, it is not recommended as a primary lightning protection measure. Furthermore, it is important to note that the adverse effects of enhanced insulation on the PV-side stem from the redirection of lightning surge currents, as detailed in Section 4.1. While the simulation model incorporates basic mechanisms of surge redistribution, it does not fully account for localized amplification effects near the PV system, which may lead to an underestimation of these impacts. Future research should refine the modeling approach to better capture these dynamics and provide a more comprehensive assessment of the potential trade-offs associated with insulation enhancement.
In contrast, the installation of lightning arresters demonstrated better lightning protection performance. Specifically, installing arresters on the three line-side towers closest to the PV-side significantly reduces the total trip rate on the line-side, thereby minimizing its impact on the PV-side. Consequently, for lightning protection in new distribution networks, the use of lightning arresters is more strongly recommended.
In addition to lightning arresters, other lightning protection measures (such as strengthened insulation and lightning protection wires) also offer certain benefits but come with inherent trade-offs. Strengthening insulation can reduce the incidence of line-side flashovers, yet it may transfer higher overvoltages toward the PV-side, potentially increasing the likelihood of PV-side equipment failure. Similarly, installing lightning protection wires can provide a discharge path to ground for part of the lightning current, effectively reducing the trip rate on the line-side, but its protective effect on the PV-side remains limited. By contrast, lightning arresters can clamp and divert the surge current at strategic points (e.g., on towers close to the PV system), effectively preventing overvoltages from further propagating along the line or into the PV-side. Our simulation results reveal that installing lightning arresters, particularly on the first three towers near the PV-side, not only significantly reduces the total trip rate on the line-side but also avoids raising the PV-side failure rate. Considering comprehensive performance, economic feasibility, and ease of deployment, lightning arresters are deemed the most effective and optimal solution among the approaches analyzed in this study.
Acknowledgment
This project is part of the Guangxi Talent and Base Project titled “Research and Development of Overvoltage Protection Devices for Intelligent Distribution Areas” (Project No. GUI KE AD22080006) and the Southern Power Grid Company’s technology project “Research and Demonstration Application of New Overvoltage Protection Technology for Highly Reliable Distribution Areas” (Project No. GXKJXM20230171). The implementing unit is the Electric Power Research Institute of Guangxi Power Grid Co., Ltd.
References
[1] Fang, Y. 1997. Overvoltage in Distribution Networks. China Electric Power Press, Beijing, China.
[2] Lin, X., R. Xian, et al. 2019. Analysis of the impact of high-voltage compensation capacitors on lightning overvoltage of distribution transformers. Transformer 2019(09): 38–43.
[3] Shoorya, A. Mimouni, F. Rachidi, et al. 2016. On the accuracy of approximate techniques for the evaluation of lightning electromagnetic fields along a mixed propagation path. Radio Science 46(2): 116–121.
[4] Wang, W., Y. Liu, W. Qin, W. Liu, and L. Peng. 2021. Research on lightning protection measures for distribution transformers. Porcelain Insulators and Lightning Arrestors 2021(05): 70–74.
[5] Chai, C., Y. He, G. Lin, et al. 2023. Analysis of induced overvoltage characteristics of distributed photovoltaic systems connected to distribution lines. Porcelain Insulators and Lightning Arrestors 2023(06): 20–27.
[6] Chen, Y., Q. Huang, H. Song, et al. 2023. Research on fast transient overvoltage distribution in the main insulation of oil-immersed current transformers. Transformer 2023(12): 27–33.
[7] Zhao, Y., X. Xu, Y. Hu, et al. 2023. Diagnosis and analysis of a lightning strike fault in a distribution transformer. Transformer 2023(12): 73–76.
[8] He, G., H. Gong, X. Duan, et al. 2023. Research on lightning withstand level and lightning protection measures for 220 kV transmission lines. Yunnan Electric Power Technology 2023(04): 8–11.
[9] Sun, Q., Z. Tian, and F. Wang. 2023. Analysis of influencing factors on lightning impulse residual voltage waveform in arrester residual voltage tests. Porcelain Insulators and Lightning Arrestors 2023(02): 104–112.
[10] Wang, S., G. Liu, B. Zhang, et al. 2023. Research on electrical localization of partial discharge in distribution transformers based on broad-frequency equivalent circuit. Power Grid and Clean Energy 2023(03): 40–47.
[11] Cheng, X., S. Tao, et al. 2023. Aging characteristics of transformer oil-paper insulation under continuous lightning impulses. High Voltage Engineering 2023(05): 1958–1966.
[12] Gao, H., R. Xian, D. Lv, et al. 2022. Analysis of the impact of low-voltage reactive power compensation wiring methods on the lightning protection performance of distribution transformers. Power Capacitor & Reactive Power Compensation 2022(04): 15–20.
[13] Xu, S., H. Peng, F. Li, et al. 2022. Simulation analysis and improvement of lightning protection for 10 kV overhead lines in Yanling area. Electrotechnics 2022(13): 151–154.
[14] Xu, S., H. Peng, F. Li, et al. 2022. Simulation analysis and improvement of lightning protection for 10 kV overhead lines in Yanling area. Electrical Engineering Technology 2022(13): 151–154.
[15] Xie, Z., Y. Zhang, Y. Peng, et al. 2022. Structural design and electric field simulation study of overvoltage insulator sensors for 10 kV distribution networks. Electrotechnics 2022(01): 128–131.
[16] Xian, J. 2023. Analysis of the impact of lightning on feeder terminal units in distribution automation. Electrotechnics 2023(24): 90–92+96.
[17] Chen, Y. 2021. Analysis of comprehensive lightning protection technology for 10 kV distribution networks. Light & Lighting 2021(05): 113–114.
[18] Yuan, T., T. Tang, W. Sima, et al. 2021. Modeling method for transient overvoltage during switching of distribution circuit breakers incorporating measured data. High Voltage Engineering 47(05): 1555–1565.
[19] Pan, L., X. Tang, W. Zeng, et al. 2021. Research on intelligent analysis and diagnosis application of distribution network voltage based on big data. Engineering and Technology Research 6(04): 20–21.
[20] Liao, Y., Y. Gao, X. Jian, et al. 2020. Research on the impact of overvoltage protection schemes for multi-terminal VSC-based DC distribution networks on overcurrent. Porcelain Insulators and Lightning Arrestors 2020(05): 75–83.
[21] Wu, H., and B. Jiang. 2020. Combined application of lightning protection measures for 10 kV overhead insulated lines in distribution networks. Porcelain Insulators and Lightning Arrestors 2020(04): 143–149.
[22] Li, Y., Y. Fu, J. Li, et al. 2020. Analysis of arcing overvoltage characteristics in 10 kV AC/DC distribution networks. Southern Power System Technology 14(03): 10–16.
Biographies
Zhidu Huang (1985.09–), male, obtained master’s degree in Power System and Automation from Guangxi University. Currently, he serves as a senior engineer at the Electric Power Science Research Institute of Guangxi Power Grid Co., Ltd. The current research direction includes equipment monitoring and early warning technology, as well as intelligent disaster prevention and mitigation technology for power grids.
Longfei Zhang (1987.03–), male, graduated from North China Electric Power University with a master’s degree in Environmental Science. Senior Engineer at the Electric Power Science Research Institute of Guangxi Power Grid Co., Ltd., with a research focus on fault diagnosis and monitoring of power equipment.
Wei Huang (1985.06–), male, graduated from Guangxi University with a master’s degree in Power System and Automation. He is a senior engineer at the Electric Power Science Research Institute of Guangxi Power Grid Co., Ltd. His research direction focuses on power equipment monitoring and early warning technology.
Shan Li (1986.04–), female, Graduated from Guangxi University and majoring in power electronics and power drives with master degree, works at the Electric Power Research Institute of Guangxi Power Grid Co., Ltd and current work as senior engineer. The current research direction includes Power system operation analysis and Power grid disaster prevention and mitigation.
Yajuan Chen (1986.09–), female, graduated from the School of Electrical Engineering at Guangxi University with a bachelor’s degree, works as an engineer at Nanning Power Supply Bureau of Guangxi Power Grid Co., Ltd. The current research direction includes relay protection automation and safety automation.
Distributed Generation & Alternative Energy Journal, Vol. 39_6, 1209–1228.
doi: 10.13052/dgaej2156-3306.3965
© 2025 River Publishers