AI Prediction of Power Grid Faults Based on Deep Learning and Improvement of Emergency Response Efficiency in Automated Repair
Di Huang, Chaoyue Zhu*, Weiyan Zheng, Xingping Yan, Weimin Lu and Bin Zhou
Zhejiang Dayou Industrial Co., Ltd. Hangzhou Science and Technology Development Branch, Hangzhou Zhejiang, 310000, China
E-mail: Chaoyue_Zhu@outlook.com
*Corresponding Author
Received 04 December 2024; Accepted 09 February 2025
Abstract
This study aims to enhance the stability and reliability of power grids by proposing a deep learning-based emergency response method for power grid fault prediction and automated repair. We have constructed a fault prediction model capable of capturing the spatio-temporal characteristics of power grid data and the complex relationships between equipment. This model is designed to handle the heterogeneity of various data sources within the power grid, such as dissolved gas data and oil temperature data, and it independently analyzes these data to enhance prediction accuracy. Furthermore, based on Fourier transform technology, this study optimizes automated repair emergency response through frequency domain analysis. In simulations of a three-machine nine-node system, the proposed method has demonstrated improvements in fault detection speed, model interpretability, prediction accuracy, and response time delay. Specifically, the detection accuracy for single-phase-to-ground faults reached 94.7%, two-phase-to-phase faults 91%, two-phase-to-ground faults 95.4%, and three-phase faults 93%. Additionally, when considering the overall performance across these different fault types, the method achieved a comprehensive solution accuracy of 93.8% during the testing phase, which takes into account the detection rates of all mentioned fault types. The research method effectively enhances the accuracy of power grid fault prediction and the response speed of automated repair, providing strong technical support for the intelligent management and maintenance of power grids. The results of this study not only advance the development of power grid fault prediction technology in theory but also hold significant value and broad application prospects in practical applications.
Keywords: Deep learning, power grid fault prediction, self attention mechanism, automated repair, fourier transform.
1 Introduction
In modern society, the stability and reliability of smart grids are crucial for maintaining daily life and economic operations [1]. With the expansion of power grid scale and the large-scale integration of renewable energy, the complexity of the power grid is increasing, which poses great challenges to traditional Power Grid Fault Prediction (PGFD) and emergency response strategies [2]. The unpredictability and randomness of power grid failures often lead to power outages, which have a profound impact on the social economy and residents’ lives [3]. The existing PGFD methods mainly rely on experience and threshold judgment, which show obvious limitations in processing large-scale and high-dimensional features of power grid data. On the one hand, traditional methods often overlook the spatio-temporal characteristics of power grid data and the topological relationships between devices, and cannot accurately capture the precursors of faults [4]. On the other hand, traditional methods are not sufficient in terms of real-time performance and automation to meet the needs of rapidly changing power grid environments [5].
PGFD and automated repair have become hot topics in power system management, and many scholars have conducted research on them. The research of Omitaomu OA et al. showed that the use of Artificial Intelligence (AI) technology, especially machine learning and deep learning, could improve the accuracy of PGFD and enhance power grid stability [6]. Ali S S et al. pointed out the key role of AI in PGFD and analyzed a large amount of data to optimize fault detection. Despite facing challenges in system scalability and collaboration, the application of AI had the potential to drive the development of power systems towards greater intelligence. The transient stability of power systems was crucial for stable operation after faults [7]. Raza A et al. reviewed fault diagnosis methods for transmission systems, including fault detection, classification, and localization. The research problem focused on how to analyze faults through voltage and current samples, as well as feature extraction and transformation to improve diagnostic accuracy. The research method involved AI and signal processing technology, and evaluated the advantages and disadvantages of different algorithms [8]. Scholars such as Zhao S have explored the application of AI in the design, control, and maintenance of power electronic systems, involving tasks such as optimization, classification, regression, and data exploration. By reviewing over 500 literature, a consensus on AI applications has been established to identify implementation challenges and research opportunities, providing valuable information and guidance for researchers in fields such as PGFD [9]. Hasan M R proposed a strategy to optimize the power grid using machine learning algorithms in response to the challenges of stability and safety confirmation in American power models, particularly in dealing with unexpected events. Through ensemble learning techniques, especially voting classifiers, their high accuracy (94.57%) in PGFD and high accuracy (93.78%) in identifying positive data points were demonstrated [10].
With the expansion of the power grid and the high proportion of renewable energy integration, the complexity and uncertainty of the power grid have significantly increased, leading to new challenges for traditional PGFD and emergency response methods. The framework constructed by Liu Y et al. using Graph Convolutional Network (GCN) effectively improved fault search speed and enhanced model interpretation ability, verifying the effectiveness of the method [11]. Lonapalawong S et al. analyzed the vulnerability of power systems in cascading faults, but existing research has not fully captured the complexity under different operating conditions. The research methods included constructing a new power weighted line graph, optimizing edge weight allocation using the topology and spatial information of the power system, and proposing a Multi GCN model. This model preserved spatial correlation and captured relationships between physical components. The results indicated that the Multi GCN model could more effectively handle power system problems with parallel lines and maintain accuracy in systems containing additional topological features [12]. Luo Y et al. used machine learning schemes to improve the accuracy of SVS evaluation for smart grids. This scheme was superior to traditional techniques and revealed the deep patterns related to SVS [13]. In response to the challenge of predicting frequency response after power system disturbances, Huang D and his team members proposed a spatio-temporal network model STGCN-LSTM that combines GCN and Long Short-Term Memory (LSTM). This model used phasor measurement unit data, extracted spatial features through GCN, captured temporal dynamics through LSTM, and achieved frequency prediction with rolling updates. This model could effectively predict the spatio-temporal distribution of frequency response, with high noise resistance and robustness, and its accuracy and effectiveness have been verified through IEEE testing systems [14]. Chen B et al. proposed a real-time risk assessment method to address the cascading fault risk associated with a high proportion of renewable energy integration into the power system. It constructed a CF simulation model that considered off grid protection actions, introduced fault graph chains to describe the dynamic characteristics of the system, and used data-driven methods to calculate the CFrisk index. Finally, the cascaded graph neural network was used to fit risk indicators, achieving accurate and real-time risk assessment [15].
In conclusion, AI technology has indeed advanced in the field of Power Grid Fault Detection (PGFD), yet it confronts significant challenges such as ensuring data quality, enhancing model generalization, managing computational expenses, and achieving real-time performance. The effectiveness of current methods is also constrained by the complexities of operating conditions and the variability of power grid structures. This study, therefore, introduces a novel deep learning-based AI prediction and Automated Repair Emergency Response (ARER) framework specifically designed for power grid faults. A key contribution is the development of the Attention-based Spatio-temporal Graph Convolutional Network (ASTGCN) model, which is engineered to address the aforementioned challenges. By employing this model, the study achieves a more accurate prediction of power grid faults and a more efficient automated repair response. The implementation of closed-loop control through real-time data collection and monitoring is a significant advancement, leading to enhanced intelligent management and operational efficiency within power grids. The research is anticipated to furnish substantial technical support for maintaining the safety, stability, and efficiency of smart grids.
2 Methods and Materials
2.1 Construction of PGFD Model Based on ASTGCN
This study is based on self attention mechanism and ASTGCN fault prediction model. The model consists of four core components: input module, self attention spatio-temporal graph convolution module, fully connected fusion block, and output module [16]. The structure of the oil spectrum dataset and oil temperature dataset is Figure 1.
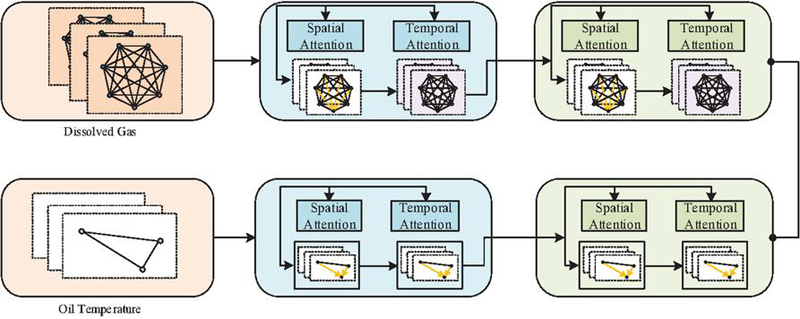
Figure 1 Structure of oil chromatographic dataset and oil temperature dataset graphs.
Figure 1 shows the fault prediction model, which adopts a multi branch architecture and includes two parallel input branches, processing dissolved gas data and oil temperature data respectively. Dissolved gas data is used for daily feature extraction, while oil temperature data captures changes every 5 minutes. These two types of data originate from the same transformer, forming a homologous dataset. Due to the fact that the oil chromatogram data records three-phase information and does not match the oil temperature data that records temperature in terms of dimensions, the model analyzes them separately. The organic gases in the oil spectrum data can be transformed into a topological graph, while the oil temperature data nodes are independent and do not form topological relationships. In addition, the sampling frequencies of the two are different, and the model avoids information loss through independent analysis.
Identifying topological connections between nodes in ASTGCN, quantifying the strength of device to device connections, especially between adjacent devices in the topology, improves the accuracy of fault prediction [17, 18]. This study introduces self attention mechanism and spatial self attention matrix in the self attention spatio-temporal graph convolution module shown in the Figureure. The calculation in the softmax function is Equation (1).
| (1) |
In Equation (1), represents the fault prediction model, and represents the spatial self attention matrix. represents the input feature matrix, and represents the weight matrix. The correlation strength of topological information between nodes in self attention mechanism is Equation (2).
| (2) |
In Equation (2), represents the strength of the topological information correlation between node and node . is an element in a rating matrix that represents the correlation score between and calculated in the self attention mechanism. The expression of the spatial self attention matrix is Equation (3).
| (3) |
After obtaining temporal attention, this study extracts temporal features through a spatio-temporal GCN, as shown in Figure 2.
Figure 2 Fault prediction model of spatio-temporal GCN.
To capture the evolution of power grid equipment status over time, the network in Figure 2 is specifically designed to analyze time series data and identify and predict the time dependence of equipment status. Through time convolution operations, the model can automatically extract key temporal features without the need for complex feature engineering. This not only simplifies the model development process, but also improves the accuracy of prediction and the robustness of the model, as shown in Equation (4).
| (4) |
is the output result of the time convolutional network, represents the time convolution operation, and represents the activation function. This study improves the traditional binary fault classification method by using regression analysis to predict the Remaining Useful Life (RUL) of equipment to capture data fluctuations outside the fault threshold. By setting a fault threshold , the RUL output by the model is converted into equipment state prediction: a fault state is predicted below , and a normal state is predicted above , as shown in Equation (5).
| (5) |
To improve the accuracy of the model in predicting RUL of power grid equipment, this study transforms the loss function from cross entropy to Root Mean Square Error (RMSE) loss function. Compared to cross entropy loss, RMSE function can more accurately reflect the deviation between predicted and actual values, and has lower sensitivity to outliers, making it suitable for life prediction. Based on this adjustment, the loss function of the model is defined by Equation (6).
| (6) |
In Equation (6), the loss value represents the prediction error, represents the actual RUL of the oil immersed transformer, and is the RUL predicted by the model. In terms of model parameter optimization, this study uses the Physics-Informed Artificial Neural Network (PANN) technique guided by Fourier transform. This technology enhances the model’s recognition of periodic features by performing frequency domain analysis on time-series data, and guides network weight adjustment through frequency domain features to optimize parameters and improve the accuracy of RUL prediction for power grid equipment.
2.2 Optimization Method of ARER Based on Fourier Transform PANN
To improve the accuracy of AI prediction for power grid faults and reduce computational complexity, this study proposes an improved AI prediction technology, which includes three core modules. The neural network module analyzes historical data of the power grid through deep learning to identify fault patterns. The Fourier module performs frequency domain analysis and extracts key frequency domain features. The optimizer module utilizes these analysis results to design algorithms, quickly predict faults, and automatically develop repair plans [19]. The improved neural network module is Figure 3.
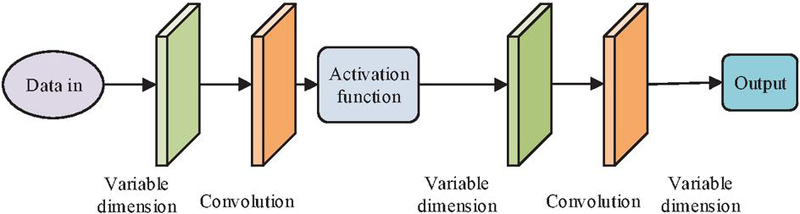
Figure 3 Improved neural network module.
The improved module in Figure 3 effectively analyzes the operation data of the power grid by inputting batch size, number of nodes, and data resolution information, performing dimensionality transformation and convolution operations, and combining it with the LeakyReLU activation function. This activation function maintains a non-zero slope in the negative value domain to avoid neuronal inactivation. By repeating the process of variable dimensionality convolution variable dimensionality, the model network layers are deepened, improving the stability and parameterization ability of training. During training iterations, fully connected neural network layers complete local transformations to achieve parameterization. Iterative updates are shown in Equation (2.2).
In Equation (2.2), represents the updated data. represents the previous generation data. represents input data. is convolutional computation. is a kernel function. is the parameter learned by the neural network layer. represents the training set. The designed Fourier module is Figure 4.
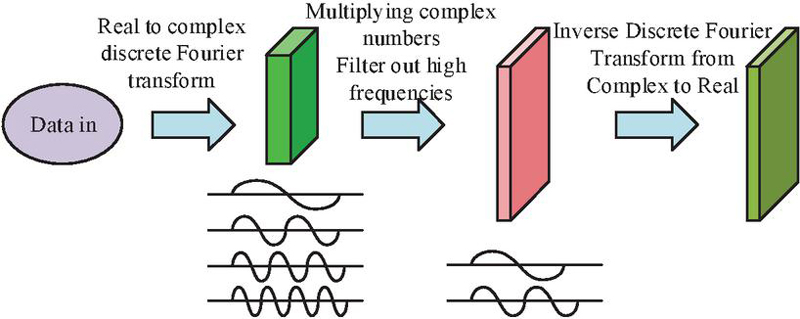
Figure 4 Fourier module.
In Figure 4, the input information in the Fourier module includes input batch size, number of input layer nodes, and equation data resolution. After inputting the data, performing a discrete Fourier transform from real to complex numbers, and then multiplying the complex numbers to filter out high-frequency signals. After filtering, performing the inverse discrete Fourier transform from complex to real numbers can analyze the frequency components of power grid signals. To parameterize the kernel function in the iterative update formula in the frequency domain, as shown in Equation (8).
| (8) |
The Fourier transform and inverse Fourier transform are reused to transform the data space, converting power grid data from time domain to frequency domain. In the frequency domain, data can be processed at a deeper level. By parameterizing kernel functions, the model can analyze signals more finely in Fourier space. Parameterized kernel functions can capture the complex relationships between different frequency components in the frequency domain, thereby improving the accuracy of fault prediction. Re-parameterizing the kernel function in Fourier space, as shown in Equation (9).
| (9) |
In Equation (9), represents the Fourier transform operation. represents the inverse Fourier transform operation. Afterwards, the kernel function is set as a periodic function in the frequency domain, and then to perform Fourier series expansion. Parameterizing the periodic function to obtain a complex tensor, and then uniformly discretizing the domain of the training set [20]. The expression of introducing weight values into the Fourier transform is Equation (10).
| (10) |
In Equation (10), represents the Fourier transform weight tensor. To simplify the computational complexity during transformation using Fast Fourier Transform, as shown in Equation (11).
| (11) |
In Equation (11), represents the value of the sequence at a certain moment. represents the base of natural logarithms. The calculation at the truncation point is Equation (12).
| (12) |
In Equation (12), represents the truncation point. In the optimizer using Adam algorithm for parameter optimization, modifications are made to the first-order matrix and second-order matrix, as shown in Equation (13).
| (13) |
When updating gradient calculation parameters, the entire neural network shares the same set of parameters to reduce the computational complexity of the model. In the loss function of the model, an approximation function is used to construct the parameter mapping, and the cost function during model training is constructed, as shown in Equation (14).
| (14) |
In Equation (14), represents the cost function. represents a finite dimensional parameter space. represents the mapping during solution. represents the objective function domain. When calculating the vector difference, the Mean Square Error (MSE) function is used, as shown in Equation (15).
| (15) |
In Equation (15), represents the MSE. The partial differential equation solving model with the introduction of Fourier transform PANN is Figure 5.
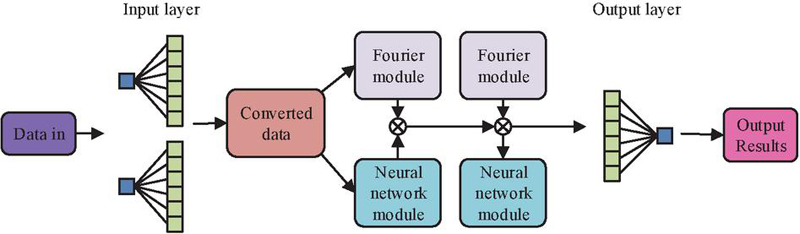
Figure 5 Improved PANN partial differential equation solving model.
Figure 5 shows an improved AI model incorporating Fourier transform, including input layer, Fourier module, neural network module, and output layer. The input layer processes power grid data to fit the model, the Fourier module analyzes the frequency characteristics of power grid signals, and the neural network module extracts high-level features. After data processing, the output layer generates fault prediction and automated repair solutions. In practical applications, models require standardization and dimensional transformation of power grid data to ensure data consistency and accurately predict power grid faults.
3 Results
This study simulated four types of power grid short circuit faults using PSCAD software and WSCC 3-machine, 9-node. In the IEEE 9-node system, a universal meter was deployed at each node to monitor voltage, and external time logic components were used to trigger faults at 0.2 seconds of simulation, enabling rapid fault classification and prediction. Key nodes were selected for fault analysis to reduce workload and improve prediction accuracy. In addition, this study also compared Feedforward Neural Networks (FFNN) and Deep Ritz Methods (DRM) to improve the effectiveness of fault analysis, and observed the changes in prediction accuracy of different algorithms with increasing iteration times. The convergence speed of relative error during training was tested, with a resolution set to 512, as shown in Figure 6.
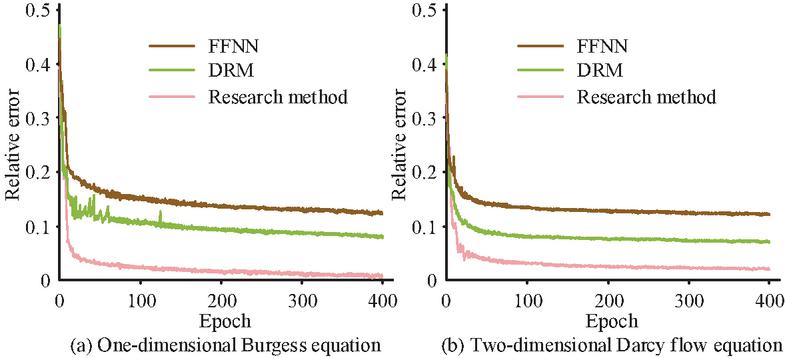
Figure 6 Relative error convergence speed test.
In Figure 6, the relative errors of different methods increased with the number of iterations during training. Taking Figure 6(a) as an example, in the simulation training of the One-dimensional Burgess Equation (1DBE), the prediction error of FFNN decreased to approximately 0.129 when it reached 400 iterations in the early training stage. Under the same number of iterations, the error of DRM decreased to approximately 0.076. In contrast, the research method only underwent 28 iterations after the start of training, and the error quickly decreased to about 0.038. It further decreased to about 0.007 after 400 iterations, demonstrating faster convergence speed and higher training efficiency. Figure 6(b) showed the training situation of the Two-dimensional Darcy Flow Equation (2DDFE), where the prediction error of FFNN decreased to approximately 0.123 at 400 iterations, while DRM decreased to approximately 0.073. The research method rapidly decreased to about 0.044 after 22 iterations of training, and further decreased to about 0.012 after 400 iterations. The results indicated that PGFD and ARER methods not only had advantages in prediction accuracy, but also significantly outperformed traditional FFNN and DRM methods in training efficiency. The response delay analysis results are shown in Figure 7.
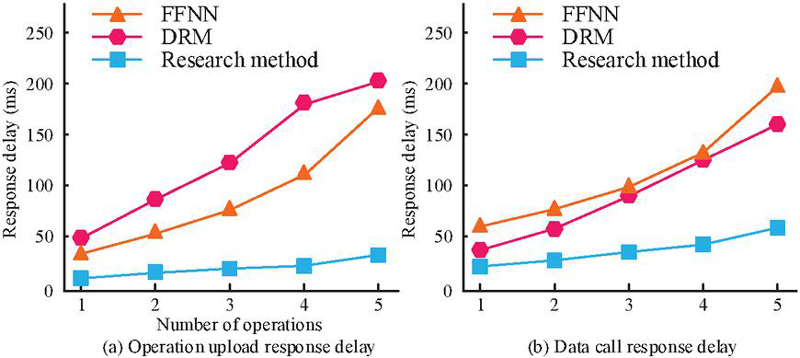
Figure 7 Response delay analysis.
In Figure 7, the response delay of different methods increased with the number of operations. Figure 7(a) showed that in the operation upload response delay test, the response delay of FFNN when processing 1 operation was 36 milliseconds, and when the number of operations increased to 5, the response delay increased to 174 milliseconds. The response latency of DRM was 49 milliseconds when processing 1 operation, and increased to 203 milliseconds when processing 5 operations. In contrast, the research method had a response delay of only 10 milliseconds when dealing with a single operation, and only 34 milliseconds when dealing with 5 operations. Figure 7(b) showed the situation in the data call response latency test. The response delay of FFNN when processing 1 operation was 59 milliseconds, and it increased to 196 milliseconds when processing 5 operations. The response latency of DRM was 41 milliseconds when processing 1 operation, and increased to 158 milliseconds when processing 5 operations. The research method had a response delay of 23 milliseconds when processing a single operation, and 57 milliseconds when processing 5 operations. In the AI prediction and ARER of power grid faults, the research method not only outperformed FFNN and DRM in response delay, but also maintained a lower response delay when the number of operations increases, demonstrating faster operational response efficiency. The accuracy comparison of the solutions is shown in Figure 8.
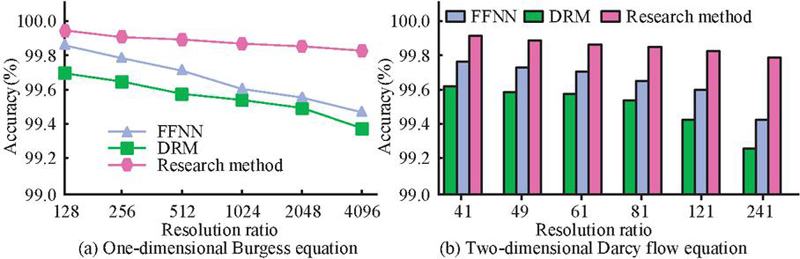
Figure 8 Solution accuracy.
In Figure 8, the accuracy of different methods decreased as the resolution increased. In Figure 8(a), when solving 1DBE, the accuracy of FFNN, DRM, and research methods decreased to 99.47%, 99.37%, and 99.83% at a resolution of 4096. The accuracy of the research method was 99.95% at a resolution of 128. In Figure 8(b), when solving 2DDFE, the accuracy of FFNN, DRM, and research methods decreased to 99.41%, 99.24%, and 99.77% at a resolution of 241. The accuracy of the research method at a resolution of 41 was 99.90%. This indicated that the research method could maintain higher solving accuracy in environments with different resolutions. The overall accuracy is displayed in Figure 9.
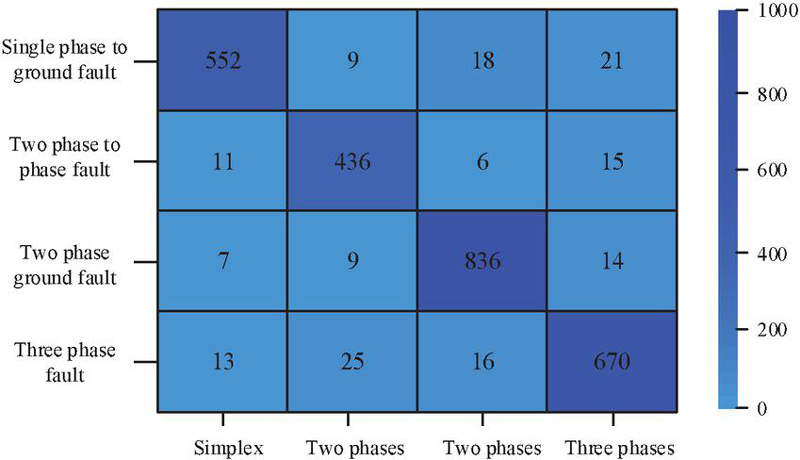
Figure 9 Comprehensive accuracy.
In Figure 9, during the testing phase, the model demonstrated a comprehensive accuracy of 93.8%. The accuracy varied for different types of faults: the detection accuracy for Single Phase to Ground Fault (SPGF) was 94.7%, for Two Phase to Phase Fault (2PPF) it was 91%, for Two Phase to Ground Fault (2PGF) it was 95.4%, and for Three Phase Fault (3PF) it was 93%. These results indicated that the model could achieve high accuracy prediction in various fault situations. To further demonstrate that the clustering and association rules used in this article have higher accuracy in two data mining treatments compared to data mining treatments using only one clustering, a comparison was made between the models trained separately for each parameter in the entire training sets of Sample Bank I and Sample Bank II. The SGD test scores obtained for each group of parameter training are shown in Figure 10.
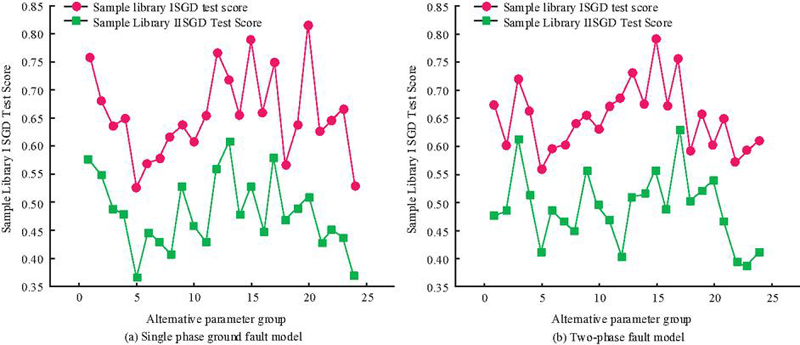
Figure 10 Comparison of SGD test scores for sample libraries of different fault models.
In Figure 10(a), under the SPGF model, sample library I had the highest SGD test score of 0.61 in the first set of parameters. Sample library II scored the highest SGD test score of 0.82 in the 20th group of parameters. In Figure 10(b), under the 2PGF model, Sample Bank I had the highest parameter score of 0.78 in Group 15, and Sample Bank II had the highest parameter score of 0.62 in Group 16. The prediction of transformer fault level and analysis of fault trend are shown in Figure 11.
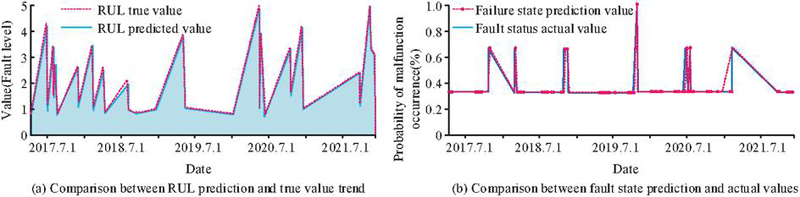
Figure 11 Prediction of transformer fault level and analysis of fault trend.
As shown in Figure 11(a), during the period from July 1, 2017 to July 1, 2021, the predicted RUL values are consistent with the overall trend of the true values, but there is some fluctuation. The range of fault levels in the figure is from 1 to 5, and over time, the RUL value shows periodic changes. The predicted value and the true value mostly maintain good consistency. As shown in Figure 11(b), the probability (percentage) of faults occurring during the period from July 1, 2017 to July 1, 2021 exhibits intermittent jumps, manifested as multiple short-term high probability peaks. The predicted values are consistent with the actual values at most time points, but there may be some deviation at certain peak points. Table 1 compared the performance of PGFD with automatic maintenance.
Table 1 Comparison of PGFD and automated repair performance
| Traditional | Research | Increase | Increase | |
| Indicator Name | Methods | Method | Percentage (%) | Numerical Value |
| Response time (minutes) | 100.00 | 80.50 | 19.5 | 19.5 |
| Repair time (hours) | 5.00 | 4.10 | 18.20 | 0.90 |
| System availability (%) | 90.00 | 93.40 | 3.78 | 3.40 |
| Failure rate (times/year) | 5.00 | 4.10 | 18.20 | 0.90 |
| Resource utilization rate (%) | 50.00 | 55.50 | 11.00 | 5.50 |
| Cost savings (10000 yuan) | / | 9.80 | / | 9.80 |
| Automation success rate (%) | 80.00 | 83.80 | 4.75 | 3.80 |
| Repeated failure rate (%) | 5.00 | 4.15 | 17.00 | 0.85 |
In Table 1, the response time of the research method was reduced from 100 minutes to 80.50 minutes, a reduction of 19.50%. The repair time had also been optimized from 5 hours to 4.10 hours, an increase of 18.20%. The system availability increased slightly by 3.78%, from 90.00% to 93.40%. The failure rate has significantly decreased, from 5 times per year to 4.10 times, a decrease of 18.20%. The resource utilization rate significantly increased by 11.00%, from 50.00% to 55.50%. In addition, the cost was expected to save 98000 yuan. The success rate of automation increased by 4.75% to 83.80%, while the repeated failure rate decreased by 17.00% from 5.00% to 4.15%.
4 Discussion and Conclusion
To improve the stability and reliability of the power grid, this study proposed a PGFD and automated repair method based on ASTGNC. It captured the spatio-temporal characteristics of power grid data and complex relationships between devices, and processed the heterogeneity of different data sources, such as dissolved gas and oil temperature data. This method also utilized PANN technology based on Fourier transform to improve prediction accuracy through frequency domain analysis and optimize model parameters to enhance accuracy in predicting the remaining life of power grid equipment. The experimental results showed that in the simulation study of the WSCC three machine nine node system, the research method has shown improvements in fault detection speed, model interpretation ability, prediction accuracy, and response time delay. The specific accuracy rates for fault detection were SPGF 94.7%, 2PPF 91%, 2PGF 95.4%, and 3PF 93%. The research method maintained a high solution accuracy in different resolution environments and achieved a comprehensive accuracy of 93.8% during the testing phase. Although progress has been made in improving the accuracy of PGFD in this study, there are still limitations to the dataset, which may affect the evaluation of the model’s generalization ability. In addition, the explanatory power of the model needs to be improved to gain user trust in practical applications. Future research work will focus on the following directions. Firstly, by introducing a wider dataset, including power grid data from different regions, types, and conditions, to enhance the model’s generalization ability. Secondly, future research will focus on improving the interpretability of the model, making its decision-making process more transparent and easier for users to understand and accept. In addition, the model structure and parameters will be further optimized to improve its real-time performance and adaptability in actual power grid environments. At the same time, the focus will also be on researching how to ensure data security and privacy while ensuring prediction accuracy. Finally, it is necessary to promote the deployment of the model in actual power grid systems and encourage interdisciplinary cooperation to solve more complex problems encountered in PGFD and automated repair, achieving wider application of technology.
In summary, this study provides strong technical support for the safe, stable, and efficient operation of smart grids, and brings innovative ideas for future power grid management and maintenance work.
Funding
The research is supported by: Zhejiang Dayou Group Science and Technology project, “Research on the Application of Artificial Intelligence in Emergency Command Scenarios for Power Maintainment”, (Project Number: DY2023-08).
References
[1] Zheng Y B, Xue X, Wang X, Cui M Y, Chao L. Stability Modeling and Analysis of Grid Connected Doubly Fed Wind Energy Generation Based on Small Signal Model. Distributed Generation & Alternative Energy Journal, 2023, 38(02): 413–434.
[2] Yin L M, Niu X S, Gu Y, Zhou G P, Bian G L. Wind-Solar-Thermal Power Coupling System in The Power Market Environment Benefit Distribution Studies. Distributed Generation & Alternative Energy Journal, 2024, 39(04): 691–716.
[3] Mirshekali H, Santos A Q, Shaker H R. A survey of time-series prediction for digitally enabled maintenance of electrical grids. Energies, 2023, 16(17): 6332–6361.
[4] Almasoudi F M. Grid distribution fault occurrence and remedial measures prediction/forecasting through different deep learning neural networks by using real time data from tabuk city power grid. Energies, 2023, 16(3): 1026–1046.
[5] Chen Z, Amani A M, Yu X, Jalili M. Control and optimisation of power grids using smart meter data: A review. Sensors, 2023, 23(4): 2118–2144.
[6] Omitaomu O A, Niu H. Artificial intelligence techniques in smart grid: A survey. Smart Cities, 2021, 4(2): 548–568.
[7] Ali S S, Choi B J. State-of-the-art artificial intelligence techniques for distributed smart grids: A review. Electronics, 2020, 9(6): 1030–1055.
[8] Raza A, Benrabah A, Alquthami T, Akmal M. A review of fault diagnosing methods in power transmission systems. Applied Sciences, 2020, 10(4): 1312–1339.
[9] Zhao S, Blaabjerg F, Wang H. An overview of artificial intelligence applications for power electronics. IEEE Transactions on Power Electronics, 2020, 36(4): 4633–4658.
[10] Hasan M R. Revitalizing the Electric Grid: A Machine Learning Paradigm for Ensuring Stability in the USA. Journal of Computer Science and Technology Studies, 2024, 6(1): 141–154.
[11] Liu Y, Zhang N, Wu D, Audun B, Yao R, Kang C. Searching for critical power system cascading failures with graph convolutional network. IEEE Transactions on Control of Network Systems, 2021, 8(3): 1304–1313.
[12] Lonapalawong S, Chen C, Wang C, Chen W. Interpreting the vulnerability of power systems in cascading failures using multi-graph convolutional networks. Frontiers of Information Technology & Electronic Engineering, 2022, 23(12): 1848–1861.
[13] Luo Y, Lu C, Zhu L, Song J. Graph convolutional network-based interpretable machine learning scheme in smart grids. IEEE Transactions on Automation Science and Engineering, 2021, 20(1): 47–58.
[14] Huang D, Liu H, Bi T, Yang Q. GCN-LSTM spatiotemporal-network-based method for post-disturbance frequency prediction of power systems. Global Energy Interconnection, 2022, 5(1): 96–107.
[15] Chen B, Sun D, Zhu Y, Liu D, Zhou Y. Real-time risk assessment of cascading failure in power system with high proportion of renewable energy based on fault graph chains. Engineering Reports, 2023, 5(10): e12631–e12643.
[16] Lu Y J, Li C T. Forecasting Urban Sensory Values through Learning Attention-adjusted Graph Spatio-temporal Networks. ACM Transactions on Spatial Algorithms and Systems, 2024, 10(1): 1–22.
[17] Dornelas R S, Lima D A. Correlation Filters in Machine Learning Algorithms to Select De-mographic and Individual Features for Autism Spectrum Disorder Diagnosis. Journal of Data Science and Intelligent Systems, 2023, 3(1): 7–9.
[18] Reddy S M V, Dammur A, Narasimhamurthy A. An Attention based Spatial Temporal Graph Convolutional Networks for Traffic Flow Prediction. International Journal of Intelligent Systems and Applications in Engineering, 2024, 12(15s): 481–488.
[19] Veerasingam S, Ranjani M, Venkatachalapathy R. Contributions of Fourier transform infrared spectroscopy in microplastic pollution research: A review. Critical Reviews in Environmental Science and Technology, 2021, 51(22): 2681–2743.
[20] Su K Y, Lee W L. Fourier transform infrared spectroscopy as a cancer screening and diagnostic tool: a review and prospects. Cancers, 2020, 12(1): 115–134.
Biographies

Di Huang obtained his Master’s Degree in Electrical Engineering (2011) from Huazhong University of Science and Technology in Hubei, China. Presently, he is working as a team leader in Zhejiang Dayou Industrial Co., Ltd. Hangzhou Science and Technology Development Branch, Hangzhou Zhejiang, 310000, China. He leads the R&D department. He has published more than 6 EI articles. His research filed includes power system analysis, artificial intelligence and information security.

Chaoyue Zhu obtained his Master’s Degree in Electrical Engineering (2017) from Zhejiang University in Zhejiang, China. Presently, he is working as an engineer in Zhejiang Dayou Industrial Co., Ltd. Hangzhou Science and Technology Development Branch, Hangzhou Zhejiang, 310000, China. He was invited to deliver various technical speeches on power substation maintaining, youth innovation and software computing. He has published 3EI articles. His research filed includes power system analysis, image processing and pattern recognition.

Weiyan Zheng obtained his PhD in Electrical Engineering (2010) from Zhejiang University in Zhejiang, China. Presently, he is working as the R&D Dean in Zhejiang Dayou Industrial Co., Ltd. Hangzhou Science and Technology Development Branch, Hangzhou Zhejiang, 310000, China. He was invited to deliver various technical speeches on distribution grid automation and software designing. He has published articles in more than 6 international reputed peer reviewed journals and conferences proceedings. His research filed includes machine learning, image processing, pattern recognition and information security.

Xingping Yan obtained his Master’s Degree in Electrical Engineering (2017) from Zhejiang University in Zhejiang, China. Presently, he is working as a technical team leader in Zhejiang Dayou Industrial Co., Ltd. Hangzhou Science and Technology Development Branch, Hangzhou Zhejiang, 310000, China. He has published more than 10 articles. His research filed includes distribution grid automation devices design, embedded software programming and pattern recognition.

Weimin Lu obtained his Bachelor’s Degree in Electrical Engineering from Hangzhou Dianzi University in Zhejiang, China. Presently, he is working as a team leader in Zhejiang Dayou Industrial Co., Ltd. Hangzhou Science and Technology Development Branch, Hangzhou Zhejiang, 310000, China. He has published more than 3 articles. His research field includes embedded software programming and electrical devices manufacturing.

Bin Zhou obtained his Bachelor’s Degree in Electrical Engineering from Tongji Zhejiang College in Zhejiang, China. Presently, he is working as an engineer in Zhejiang Dayou Industrial Co., Ltd. Hangzhou Science and Technology Development Branch, Hangzhou Zhejiang, 310000, China. He has published more than 5 articles. His research field includes target detection and machine learning.
Distributed Generation & Alternative Energy Journal, Vol. 40_1, 63–84.
doi: 10.13052/dgaej2156-3306.4013
© 2025 River Publishers