Energy Storage Optimization Configuration and Operation for High-Altitude Power Grids Considering Power Supply Guarantee and Clean Energy Utilization
Yunyao Chen*, Bin Li, Xianlin Deng, Yuzhou Chen, Qingyuan Zhang and Qingxi Liao
Economic & Technological Research Institute, State Grid Tibet Electric
Power Co., Ltd.
E-mail: xzyunyaochen@163.com
*Corresponding Author
Received 13 December 2024; Accepted 14 January 2025
Abstract
With the continuous advancement of the Goal of Emission Peak & Carbon Neutrality, the penetration of clean energy in the new power system is in creasing day by day. The randomness, intermittency, and volatility associated with this development make power supply guarantee and clean energy utilization challenges even more severe. Insufficient power consumption capacity in the power system can lead to wind and solar curtailment, while power shortages on the generation side may cause load shedding and power supply insufficiency. The configuration of electrochemical energy storage is an effective method to smooth out renewable energy fluctuations and alleviate supply-demand imbalances. This paper proposes an energy storage optimization configuration and operation strategy that considers both power supply guarantee and clean energy utilization. First, taking the power grid of a high-altitude region as the research object, the two key demands of power supply guarantee and clean energy utilization are identified, and three indicators – clean energy utilization, load shedding, and power supply insufficiency – are formulated. Next, based on historical data, typical operational scenarios for local photovoltaic power generation units and load are clustered. Using this clustering data, an upper-level energy storage planning configuration is made. The resulting configuration is then applied to the lower-level operational model, which incorporates power supply guarantee and clean energy utilization constraints, to build a two-layer model for energy storage optimization and operation. Finally, the feasibility and effectiveness of the proposed strategy are verified through a practical power system in a high-altitude region of western China. Compared to configuring energy storage independently, considering both power supply guarantee and clean energy utilization in the system regulation can significantly enhance the clean energy utilization rate and power supply guarantee level of the regional grid while minimizing the unit cost of mitigating power shortages and solar curtailment. The local grid can adjust the range of power supply guarantee and clean energy utilization indicators according to actual needs to balance the economic and social benefits of the grid.
Keywords: Energy storage configuration, power supply guarantee, clean energy utilization, mixed integer programming.
1 Introduction
As China’s “Dual Carbon” goals continue to advance, the penetration of clean energy in the new power system is increasing day by day [1]. The randomness, intermittency, and volatility characteristics of clean energy pose growing challenges for power supply guarantee and clean energy utilization in the grid [2]. When clean energy is fully generated, the power system’s absorption capacity is insufficient, leading to wind and solar curtailment, which hinders the achievement of reduced carbon emissions in power generation [3]. On the other hand, when clean energy generation is minimal or absent, insufficient power on the system’s supply side can lead to load power shortages and power restrictions, severely affecting local industrial production and daily life [4]. In the new power system, the configuration of electrochemical energy storage is an effective method for smoothing fluctuations in renewable energy generation and alleviating supply-demand imbalances [5]. For multi-scenario, multi-timescale power and energy regulation needs in the grid, the electrochemical energy storage system balances the supply and demand of the grid by absorbing and releasing peak power from the source side. However, in large regional grids, clean energy-rich areas are often far from load clusters, and long-distance transmission causes grid losses, limiting the circulation and utilization of clean energy while introducing potential risks of power restrictions and outages [6]. Achieving optimal energy storage configuration costs while balancing power supply guarantee and clean energy utilization goals is one of the key strategies for stabilizing and balancing system power and energy in the transition to a new power system.
Currently, scholars both domestically and internationally have conducted extensive research on the optimal configuration and operation of energy storage systems for clean energy utilization. In reference [7], a storage optimization strategy is proposed that considers demand response and the uncertainty of source-load fluctuations, with tailored demand response policies for different levels of users. In reference [8], a layered optimization algorithm is developed that considers the complementary effects of different energy sources, aiming to optimize both renewable energy generation and energy storage system capacities simultaneously. Reference [9] addresses the net load fluctuations caused by large-scale distributed photovoltaic integration into the distribution grid, establishing a bi-level planning model for storage in the distribution grid considering demand response. The effectiveness of the proposed method is validated under different photovoltaic penetration rates. In reference [10], to solve the issues of solar curtailment and the violation of node voltage and line flow limits due to high penetration of photovoltaic systems in the distribution grid, a two-stage distribution robust optimization model is established to enhance the photovoltaic consumption capacity and security of the distribution grid. These studies primarily focus on the planning aspect of energy storage capacity configuration, targeting objectives such as demand response, clean energy utilization, and the resolution of power flow violations. However, they lack an analysis of the impact of energy storage system configuration on the operation of the power grid. References [11, 12] uses the power transfer characteristics of battery devices and energy storage systems to absorb the power and electricity of wind power and photovoltaic as much as possible.
In reference [13], a comprehensive optimization model for both planning and operation of energy storage systems is proposed, combining the planning and operational problems to enhance the integration capability of wind power. To address the negative impacts of high penetration of distributed photovoltaic systems, such as voltage violations in the distribution grid, reference [14] presents a new three-layer robust planning and operation joint optimization model to determine the capacity, power, location, and scheduling strategy of Distributed Energy Storage (DES). Reference [15] sets the minimization of the sum of wind and solar curtailment and energy storage investment costs as the objective in the planning layer, and optimizes the power distribution by balancing the state of charge (SOC) of the energy storage subsystems in the operation layer, thus providing a reference for improving the consumption rate of wind and solar renewable energy and ensuring the economic and safe operation of the system. These studies have modeled and simulated the optimization of energy storage participation in distribution grid regulation from different perspectives, effectively alleviating issues related to insufficient system absorption capacity and power flow violations caused by high proportions of clean energy integration. However, research on the optimization of energy storage configuration and operation still tends to focus on a narrow range of factors, with few studies considering the simultaneous promotion of clean energy utilization while ensuring power supply and the impact on the normal operation of regional power grids.
Research that simultaneously considers power supply guarantee and clean energy utilization in generalized modeling and regulation analysis is relatively scarce. Most related studies focus on configuring energy storage to improve the power supply level of the grid. Reference [16] analyzes the impact of different distributed generation penetration rates and network structures on energy storage configuration in active distribution grids, providing an analysis of the power supply guarantee effects of the energy storage system under different energy storage capacities and charge/discharge powers. Reference [17] proposes a two-stage energy storage optimization configuration method that comprehensively considers both the supply risk and operational economics of the distribution grid, aiming to enhance the system’s power supply level and reduce operational costs. Reference [18] introduces a new multi-state modeling and power supply risk analysis method for distribution grids, considering various energy storage functions, flexible operations, and their impact on power supply guarantee. The method is validated on the IEEE RBTS test system. Reference [19] proposes a two-layer optimization model for determining the energy storage scale, considering multiple operating scenarios such as normal operation, typical faults, and extreme faults, and offers insights into enhancing microgrid power supply guarantee levels and recovery capabilities through energy storage configuration. Reference [20] establishes a power supply risk indicator system from the perspectives of load, microgrids, and distribution networks, while considering the effects of energy storage capacity degradation, and presents an optimal economic configuration method for solar-storage microgrids, with case analysis conducted on the improved RBTS Bus6 F4 system, providing guidance for power supply-focused microgrid planning and configuration. The aforementioned studies primarily focus on the operational characteristics of energy storage and fault scenarios in the system, investigating how energy storage configuration enhances system operational economics and power supply levels.
While ensuring the power supply level, the promotion of clean energy utilization through energy storage configuration has also been considered. Reference [21] constructed an economic operation model for system wind curtailment, load loss, and unit electricity supply cost, and through case analysis, it was verified that this approach alleviates the power supply risk increase caused by higher wind power penetration. Reference [22] highlighted the contradictory issue between clean energy curtailment and system power supply capacity, establishing an optimization planning model for source-load-storage flexibility resources that integrates investment decisions with time-sequenced operational simulations. This effectively reduced both the system’s shortage and curtailment rates. Reference [23] defined the ratio of excess clean energy storage discharge to unmet load demand as a zero-carbon electricity supply indicator. A regional energy planning model was proposed, which considers meteorological uncertainties and demand response, maximizing greenhouse gas emission reductions while analyzing energy storage discharge to maximize the system’s power supply guarantee level. The aforementioned studies focus on ensuring load supply while improving clean energy utilization rates and reducing carbon emissions by defining curtailment rates, shortage rates, and zero-carbon electricity supply indicators. However, few studies integrate the power supply guarantee and clean energy utilization goals with the actual regional grid requirements to characterize the rate for analysis.
Based on this, in view of the dual challenges of load power shortage and clean energy curtailment that are mutually contradictory and prone to occur in high-proportion clean energy systems, this paper comprehensively considers the load power supply guarantee target and the clean energy consumption accommodation target of the regional power grid, and proposes an optimized allocation and operation strategy for energy storage that takes into account both power supply guarantee and promotion of consumption accommodation. Taking the dual challenges of power shortage and curtailment as the problem orientation, three indicators, namely grid balance risk, clean energy consumption accommodation risk, and load power supply guarantee risk, are proposed to assess the power supply guarantee/consumption accommodation risks of the regional power grid. A model considering the optimized allocation and operation of energy storage is constructed to ensure the lowest possible various risks while guaranteeing the optimal economy of the system. Finally, a simulation model is built using a high-proportion clean energy system in western China as an example to verify the technical and economic advantages of the strategy proposed in this paper.
2 Demand Analysis for High-Altitude Regional Grids Balancing Power Supply Guarantee and Clean Energy Utilization
2.1 Analysis of the Needs of High-altitude Area Power Grids
High-altitude areas have thin air and weak atmospheric absorption capacity for solar energy, allowing sunlight to shine directly on the ground more effectively, making the solar energy resources in these areas more abundant and efficient. At the same time, the terrain in high-altitude areas is complex, with mountain ranges and valleys guiding air flow movement, and less air resistance, which makes high-altitude areas have richer and stronger wind resources [24]. How to efficiently consume wind and photovoltaic and other clean energy is one of the key needs of high-altitude area power grids.
The population in high-altitude areas is relatively sparse, and the load distribution is more dispersed. In addition, new energy-rich areas are usually far from load nodes, and long-distance power transmission is required between power and load nodes across mountain areas [25]. The stability and reliability of power supply are difficult to ensure. Due to long transmission lines and complex terrain, the power grid faces risks of natural disasters and extreme weather, which can easily lead to power outages [26]. How to ensure the power supply in remote areas has become one of the key needs of high-altitude area power grids.
Energy storage systems can store excess electricity when renewable energy generation exceeds demand and release stored energy when generation is insufficient, thereby achieving peak shaving and valley filling, and smoothing the volatility of energy supply. As shown in Figure 1, with the configuration of energy storage systems, the grid can more flexibly dispatch clean energy, avoiding phenomena like wind and solar curtailment, thus improving the efficiency of clean energy utilization and the stability of the grid. The configuration of energy storage systems also serves as an emergency backup power source. In the event of a failure of the main power grid or insufficient supply, the storage system can quickly respond to ensure power supply, particularly in remote areas. Especially in regions where power generation resources are scarce and rely entirely on external electricity supply, energy storage systems can provide independent power, enhancing the resilience of the grid and the reliability of the power supply.
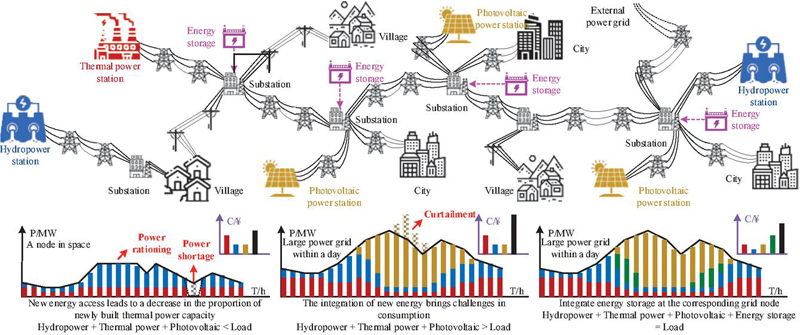
Figure 1 Schematic diagram of grid demand analysis in high altitude areas.
2.2 Generalized Model of Power Supply Guarantee and Clean Energy Utilization Indicators
As the share of renewable energy in the new power system continues to increase, the volatility, intermittency, and randomness on the supply side also intensify, leading to a weakened regulation capability of the power system. This can result in both surplus and shortage of electricity supply in the grid, manifesting as the contradictory phenomena of “wind and solar curtailment” and “electricity shortages.” To address these challenges, this study introduces three variables – curtailment rate, power limitation rate, and power shortage rate – to characterize the power supply guarantee and clean energy utilization indicators, aiming to achieve an optimal balance between enhancing the power supply level and promoting renewable energy utilization.
2.2.1 Clean energy utilization indicators
The clean energy utilization indicator is defined as the ratio of the amount of abandoned electricity from clean energy to the total electricity generation from clean energy. This indicator aims to enhance the power system’s ability to absorb wind and solar energy, thereby reducing the phenomenon of wind and solar power curtailment. The modeling of the clean energy utilization indicator is as follows:
| (1) |
In the formula, is the abandoned power of clean energy at time ; is the generation power of clean energy at time ; is the system operation time; is the number of clean energy power generation devices; is the clean energy utilization coefficient.
2.2.2 Load-shedding indicators
The Load-shedding indicators are defined as the proportion of the power supply of the load to the maximum demand power of the load during the dispatching period. This indicator aims to constrain the lower limit of the power supply capacity of the power system to reduce the situation of insufficient power supply and ensure the normal production and life electricity use of enterprises and residents. The modeling of power restriction indicators is as follows:
| (2) |
In the formula, is the power supply of the load at time t; is the demand power of the load at time t; is the load-shedding coefficient.
2.2.3 Power shortage indicators
The power shortage indicators are defined as the proportion of the cumulative power shortage of the load to the total power of the load during the dispatching period. This indicator aims to measure the degree of power supply insufficiency of the power system in the case of supply and demand tension, and is used to quantify and manage the power gap of the power grid to improve the power supply capacity of the load. The modeling of power shortage indicators is as follows:
| (3) |
In the formula, is the power shortage at time t; is the power shortage coefficient.
To address such dilemmas, this study introduced three types of indicators, namely grid balance risk, clean energy consumption accommodation risk, and load power supply guarantee risk, to construct a risk assessment system. The grid balance risk mainly takes into account the reserve situation of the system, which is divided into insufficient positive reserve and negative reserve, serving as the foundation for considering both the power supply guarantee and consumption accommodation of the system. The clean energy consumption accommodation risk mainly considers wind and solar curtailment in the system. The indicators of wind curtailment volume and solar curtailment volume are directly related to the consumption accommodation level of the system. The load power supply guarantee risk mainly considers power rationing and power outage, and mainly measures the power supply guarantee level of the system through power shortage volume, power shortage duration, and power shortage frequency. By constructing an optimized model that takes into account both power supply guarantee and consumption accommodation, the power system can achieve the optimal balance between the power supply guarantee level and the clean energy consumption accommodation level.
3 Energy Storage Optimization Configuration and Operation Model
Based on the demand of high-altitude regional power grids and the characterization of power supply guarantee and clean energy utilization indicators, this paper establishes an optimization configuration and operation model for energy storage in high-altitude regional power grids that considers both power supply guarantee and clean energy utilization, as shown in Figure 2. The decision variables for planning include the configuration nodes, capacity, and power of the energy storage system, while the operational decision variables include the output of synchronous units, clean energy output, and energy storage system output. By incorporating the objective function, which includes energy storage investment cost, system operating cost, and penalties for electricity shortage and curtailment, along with constraints such as generator output, grid DC power flow, energy storage operation, interconnection line output, and the balance between power supply guarantee and clean energy utilization, a linear integer programming method is applied. This ensures that at each node and at different times, the system power balance is maintained, achieving the optimal configuration and operation of energy storage.
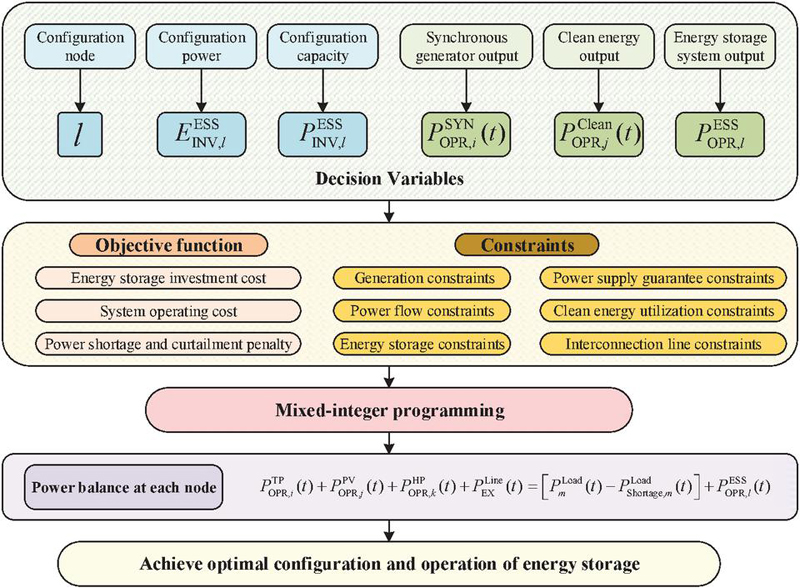
Figure 2 Energy storage optimization configuration and operation model considering power supply guarantee and clean energy utilization.
3.1 Objective Function
The objective function minimizes the total integrated cost of the system, which includes the investment cost of energy storage and operational costs such as power generation/purchase costs, energy storage operation costs, curtailment penalty costs, and penalties for power supply constraints and load shedding. The function simultaneously considers the objectives of economic efficiency, supply reliability, and enhanced renewable energy utilization.
| (4) |
In the formula, represents the total integrated cost of the system, denotes the investment cost of the system, and represents the operational cost of the system.
| (5) |
In the formula, represents the unit capacity investment cost of the energy storage system; denotes the energy storage capacity configured at node l; is the unit power investment cost of the energy storage system; represents the energy storage power configured at node l.
| (6) |
In the formula, is the discount rate of the energy storage system; represents the lifetime of the energy storage system; is the discount factor.
| (7) |
In the formula, represents the regulation cost of thermal power; represents the regulation cost of photovoltaic power; represents the regulation cost of hydropower; represents the regulation cost of energy storage systems; represents the regulation cost of linking-up road; represents the penalty cost for load shedding.
| (8) |
In the formula, represents the unit power regulation cost of thermal power; denotes the unit carbon emission cost of thermal power; represents the power regulated by the thermal generator at node i at time t.
| (9) |
In the formula, represents the unit power regulation cost of photovoltaic power; denotes the power regulated by the photovoltaic generator at node j at time t; represents the penalty cost for curtailed photovoltaic power; denotes the rated power generation of the photovoltaic generator at node j at time t.
| (10) |
In the formula, represents the unit power regulation cost of hydropower; denotes the power regulated by the hydropower generator at node k at time t.
| (11) |
In the formula, represents the unit power operation and maintenance cost of the energy storage system; denotes the power regulated by the energy storage system at node l at time t.
| (12) |
In the formula, represents the unit power regulation cost of linking-up road; denotes the power regulated by linking-up road at time t.
| (13) |
In the formula, represents the penalty cost for unit load shedding; denotes the power shortage at node m at time t.
3.2 Constraint Condition
The constraint conditions include those on the generation side, the grid side, and the energy storage side, with a primary focus on system power and energy balance constraints, power supply assurance constraints, and renewable energy accommodation constraints.
3.2.1 Generation output constraints
The generation side includes output constraints for thermal power plants, photovoltaic power plants, and hydropower plants.
| (14) |
In the equations, represents the lower limit of thermal power generation output at node j. represents the upper limit of thermal power generation output at node j. represents the upper limit of hydropower generation output at node k.
3.2.2 Grid constraints
The grid side considers branch capacity limits, tie-line capacity limits, and DC power flow constraints.
| (15) |
In the equations, represents the power flow between nodes a and b; and are the voltage angles of nodes a and b, respectively; represents the susceptance of the line between nodes a and b; represents the maximum transmission power of the line between nodes a and b; represents the maximum transmission power of the tie-line.
3.2.3 Energy storage constraints
The energy storage side mainly considers constraints on battery charging power, discharging power, state of charge (SOC), and energy capacity variations over the scheduling period.
| (16) |
In the equations, represents the energy level of the energy storage system at node j at time t; and represent the initial and final energy levels of the energy storage system at node l during the scheduling period, respectively; and represent the lower and upper energy limits of the energy storage system at node l during the scheduling period, respectively.
3.2.4 System power balance constraints
In any operation cycle, the power output from the generation side must equal the power consumption on the load side plus the power from the energy storage side.
| (17) |
In the equations, represents the power demand at node m at time t.
3.2.5 Constraints considering power supply guarantee and clean energy utilization
Transform the generalized model of power supply guarantee and clean energy utilization indicators proposed in Section 2 into constraints considering power supply guarantee and clean energy utilization.
| (18) |
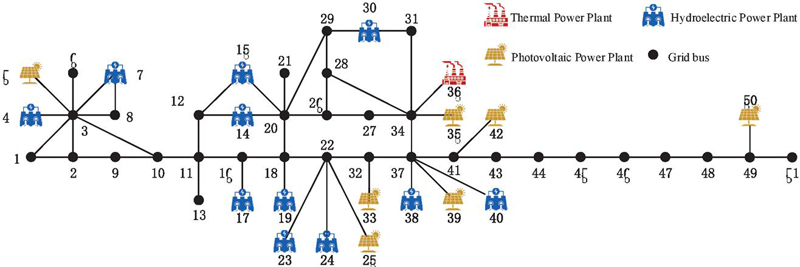
Figure 3 The connection diagram of a power grid in a high-altitude region of western China.
In the equations, represents the upper limit of the curtailment rate due to the inability to accommodate clean energy; represents the ratio of load shedding at time t to the maximum load power; represents the maximum load power on a typical day; represents the upper limit of the load shedding rate.
4 Case Analysis
4.1 Case Introduction
Taking the power grid in a high-altitude region of western China as an example, a simulation model is established with a scheduling period of 24 hours and a scheduling step length of 1 hour. The connection diagram of the case system is shown in Figure 3. The system includes 51 nodes and 59 branches, equipped with one thermal power plant, 11 hydropower plants, and 7 photovoltaic (PV) power plants. The typical daily PV output curve of one PV generator is depicted as the blue line in Figure 4, while the typical daily load power curve of a specific node is represented by the red line in Figure 4. Relevant parameters of the regional grid’s generation side and load side are listed in Table 1, and the basic parameters of the configured energy storage system are provided in Table 2.
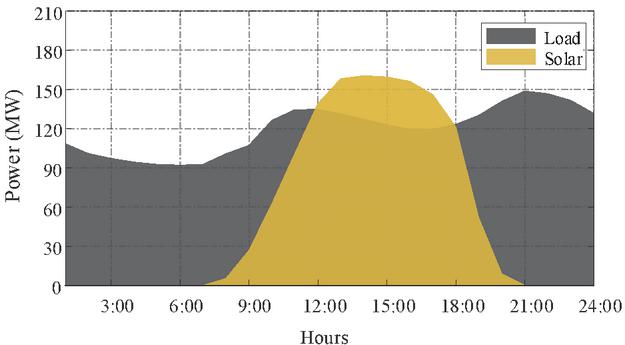
Figure 4 PV power generation and load forecast curves for a node in the regional power grid.
Table 1 Basic parameters of regional grid power and load
| Parameters | Rated Power (MW) | Modulation Range (MW) |
| Thermal power generating units | 281.2 | [0.5P(t), P(t)] |
| Hydropower generating units | 748.4 | [0, P(t)] |
| Photovoltaic output | 1820.7 | [0, P(t)] |
| Tie line | 120 | [0, P(t)] |
Table 2 The basic parameters of the configured energy storage system
| Maximum | Maximum | ||||
| Service | Configured | Configured | |||
| Life | Discount | Power | Capacity | Initial | |
| Categories | (Years) | Rate | (MW) | (MWh) | SOC |
| Electrochemical energy storage | 10 | 6.0% | 120 | 0.5 | 0.5 |
4.2 Optimization Configuration Strategy and Result Analysis
To compare and analyze the feasibility and advantages of the proposed energy storage optimization configuration considering both load power supply guarantee and clean energy utilization, the following three typical scenarios are set for comparative analysis:
Case 1: Energy storage participates in system regulation with a focus on clean energy utilization.
Case 2: Energy storage participates in system regulation with a focus on power supply guarantee.
Case 3: Energy storage participates in system regulation considering both power supply guarantee and clean energy utilization.
4.2.1 Analysis of optimization results for Case 1
To address the issue of photovoltaic curtailment in the system, energy storage is configured in Case 1 to store excess power and release it to load nodes.
Table 3 Optimization configuration results of energy storage considering the consumption objective in Case 1
| Node | 42 | 50 | 51 |
| Rated power (MW) | 48.1 | 10 | 118.5 |
| Rated capacity (MWh) | 118.4 | 40 | 474.0 |
By solving the model, the optimization configuration scheme for Case 1 is obtained as follows: Node 42 is configured with 48.1 MW/118.4 MWh, Node 50 with 10 MW/40 MWh, and Node 51 with 118.5 MW/474.0 MWh, as shown in Table 3. The charging/discharging and SOC operation curves of the energy storage participating in system regulation after optimization are shown in Figure 5.
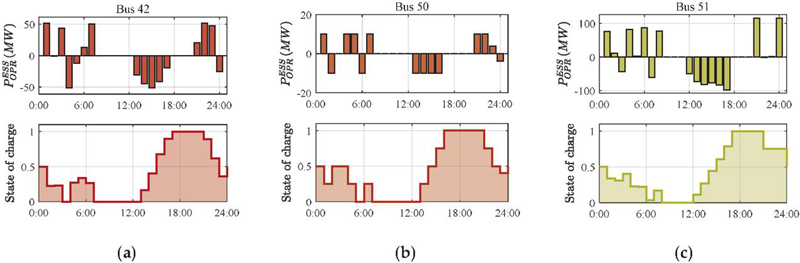
Figure 5 Operating status diagram of optimized energy storage configuration in Case 2.
As shown in Figure 6, the power load of the regional power grid is higher between 9:00 and 24:00 hours, reaching two peaks at 12:00 and 22:00, approximately 1564.5 MW and 1707.2 MW, respectively. From 0:00 to 8:00, the load level is lower, with an average value of about 1104 MW. From Figure 3, it can be observed that the regional power grid exhibits a “long-chain, weakly interconnected” characteristic. Additionally, since the power generation units are not evenly distributed, the risk of load shedding is higher at nodes far from the generation units.
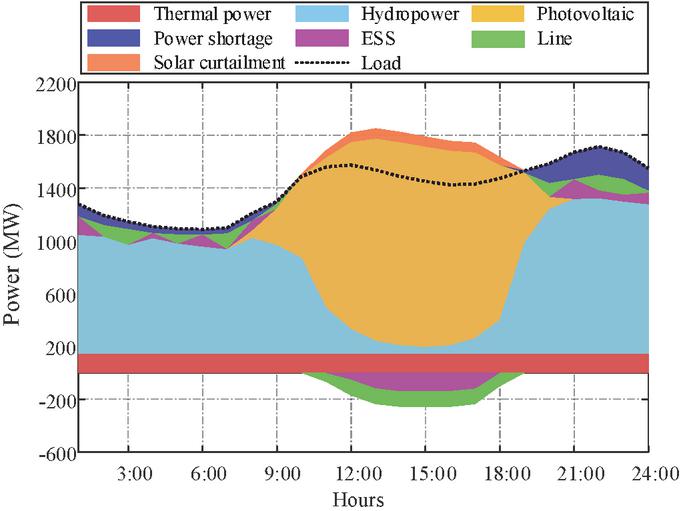
Figure 6 Considering the consumption target, the system regulation operation chart.
At the same time, the clean energy in the regional power grid is mainly photovoltaic. Due to the characteristics of photovoltaic power generation, excess generation during the day has led to photovoltaic curtailment. In Case 2, considering the consumption objective, a significant electricity shortage occurs from 19:00 to 9:00 hours the next day. At the same time, the photovoltaic curtailment issue is effectively alleviated between 10:00 and 18:00 hours. Compared to the scenario without energy storage, the curtailed power decreased by 1548.8 MW, reducing the curtailment by 72%.
4.2.2 Analysis of optimization results for Case 2
To address the electricity shortage issue in Case 1, energy storage is configured in Case 2 to store excess power and release it to the nodes with insufficient power supply.
Table 4 Optimization configuration results of energy storage considering the power supply security objective in Case 2
| Node | 1 | 2 | 7 |
| Rated power (MW) | 120 | 120 | 28.4 |
| Rated capacity (MWh) | 480 | 480 | 113.8 |
Through mixed-integer optimization for energy storage optimization configuration, the optimized configuration scheme is obtained as follows: Node 1 is configured with 120 MW/480 MWh, Node 2 with 120 MW/480 MWh, and Node 7 with 28.4 MW/113.8 MWh, as shown in Table 3. After the optimization, the charging and discharging, as well as the state of charge (SOC) operation diagram of the energy storage system participating in the system regulation, are shown in Figure 7.
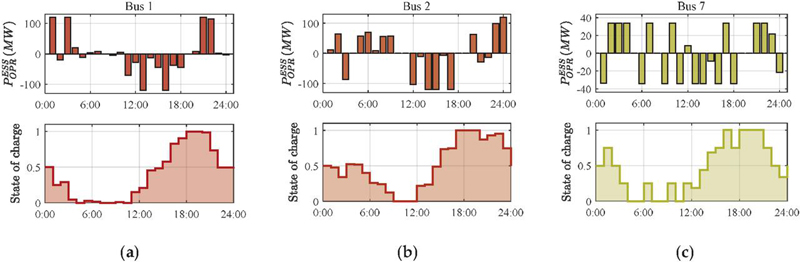
Figure 7 Optimization configuration of energy storage operation status diagram in Case 2.
From Figure 8, it can be observed that the system no longer experiences a power shortage between 0:00 and 9:00. The power shortage is reduced by 1133.5 MW, a decrease of 72.4%, significantly improving the power supply security. However, the phenomenon of curtailment of solar power has intensified. The curtailment power has increased by 17.6 MW compared to the scenario without energy storage, indicating a worsening of the curtailment issue.
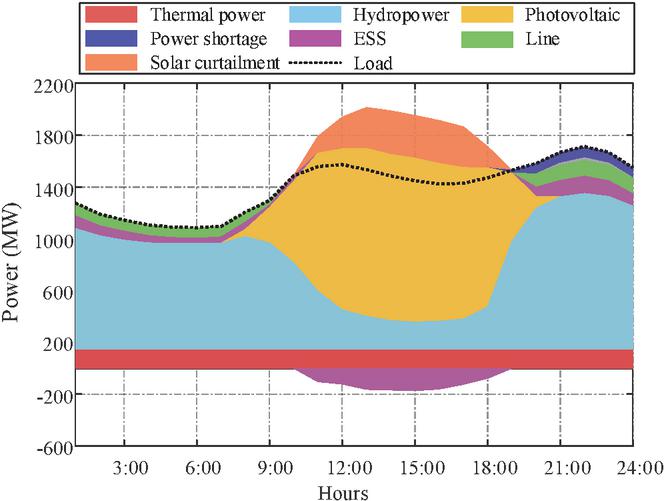
Figure 8 Considering the supply security target, the system regulation operation chart.
4.2.3 Analysis of optimization results for Case 3
In Case 3, while utilizing the flexibility of energy storage to participate in the system’s power and energy balance regulation, it also takes into account both load supply security and renewable energy consumption.
Table 5 Energy storage optimization configuration results for Case 3 considering both supply security and renewable energy consumption
| Node | 1 | 2 | 6 |
| Rated power (MW) | 120 | 120 | 25.6 |
| Rated capacity (MWh) | 480 | 480 | 102.5 |
| Node | 42 | 49 | 51 |
| Rated power (MW) | 39.1 | 10 | 119.1 |
| Rated capacity (MWh) | 154.1 | 40 | 476.4 |
The optimization configuration for multiple types of energy storage is obtained using mixed-integer linear programming. The optimization results are as follows: Node 1 is configured with 120 MW/480 MWh, Node 2 with 120 MW/480 MWh, Node 6 with 25.6 MW/102.5 MWh, Node 42 with 39.1 MW/154.7 MWh, Node 49 with 10 MW/40 MWh, and Node 51 with 119.1 MW/476.4 MWh, as shown in Table 5. The charging and discharging operation diagram of the optimized energy storage participating in the regulation is shown in Figure 9.
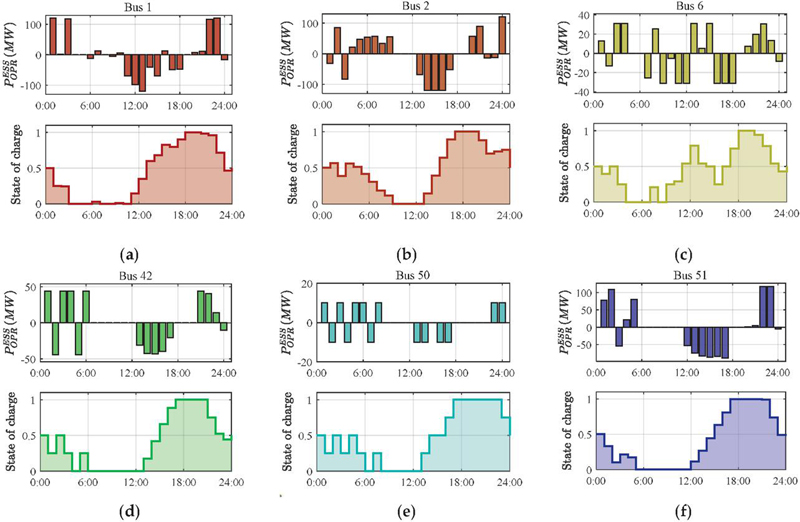
Figure 9 Optimization configuration of energy storage operation status diagram in Case 3.
Case 3 represents the energy storage optimization configuration and operation proposed in this paper, which balances both load supply and clean energy consumption. In solving the model, the consumption and supply constraints established in Section 2 of this paper are considered, with , , and all set to 0.05. As shown in Figure 9, by considering the supply guarantee objective and constraints, the system has a slight supply gap only during the 19:00-24:00 hours period. Compared to Case 1, the supply gap is reduced by 70.5%, with a similar effect on consumption mitigation. Compared to Case 2, the level of consumption mitigation is improved by 72.1%, with the supply guarantee level remaining similar.
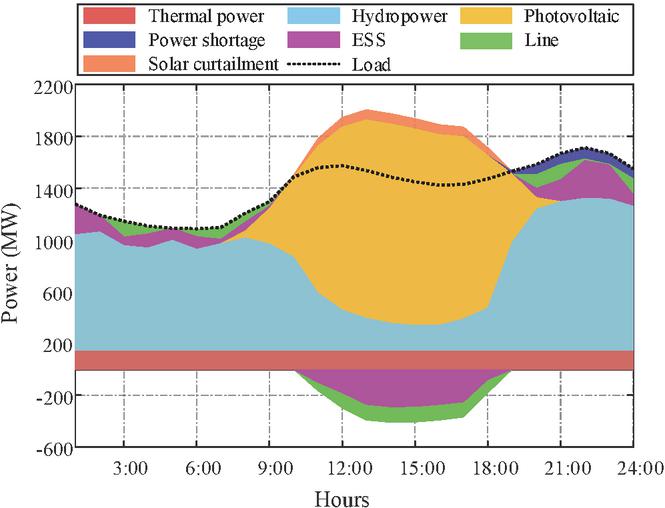
Figure 10 The system control operation chart considering both supply guarantee and consumption mitigation.
4.2.4 Comparative analysis of results for the three cases
The comparison of system costs obtained through energy storage optimization participation in system regulation under the three cases is shown in Figure 10. The thermal power (TP) costs are the same across all three cases, at 2.19 million yuan. The hydroelectric power (HP) costs are ranked as: Case 2 Case 3 Case 1. Case 2, which considers the supply guarantee goal, requires more supporting power from hydroelectric units. Meanwhile, the photovoltaic (PV) costs and the curtailment (SC) costs in Case 2 are the highest and lowest among the three cases, respectively, indicating that Case 2, in order to reduce the supply risk, has a lower photovoltaic utilization rate and higher curtailment power. The energy storage costs are ranked as: Case 3 Case 2 Case 1, showing that Case 3, which considers both the supply guarantee and consumption mitigation goals, has a higher demand for energy storage configuration. The load shedding (LS) penalty is the highest in Case 1, indicating that this case, which only considers the integration of clean energy, results in significant load shedding power in the system.
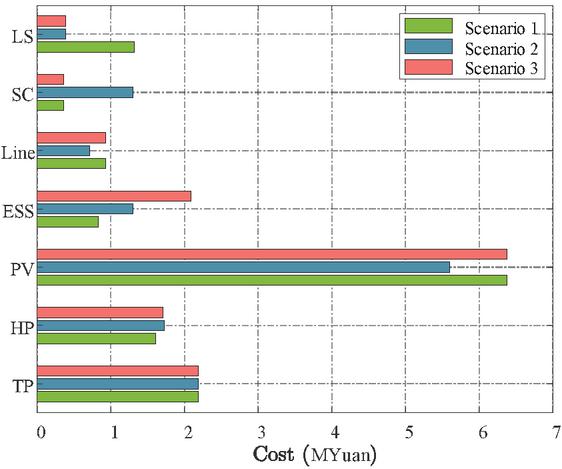
Figure 11 The comparison of various costs within the system across the three cases.
Further, a comparison of the power shortages, photovoltaic curtailment, and the costs associated with alleviating unit power shortages/curtailment in each case is provided in Table 6. When only considering the consumption goal (Case 1), energy storage is configured to participate in system regulation, resulting in a curtailment power of 606.3 MW, which is 14.9% of the total output of all photovoltaic power plants, and a supply shortage of 1462.8 MW, which accounts for 21.2% of the total load power. When only considering the supply guarantee goal (Case 2), energy storage is configured to participate in system regulation, leading to a curtailment power of 2172.6 MW, which is 53.3% of the total output of all photovoltaic power plants, and a supply shortage of 431.9 MW, which accounts for 6.2% of the total load power. When considering both supply guarantee and consumption goals (Case 3), the system optimizes energy storage configuration to balance both objectives, resulting in the lowest curtailment power and supply shortage compared to the other two cases, taking advantage of the strengths of both Case 1 and Case 2. From the perspective of the unit cost for alleviating power shortages and curtailment, Case 3 Case 1 Case 2. Compared to Case 1, Case 3 sees a reduction of 36.5% in unit costs, and compared to Case 2, the reduction is 55.9%.
Table 6 Comparison of power shortage, curtailed power, and unit cost for mitigating power shortage/curtailed power across three cases
| Total | Total | Unit Cost for Alleviating | |
| Power | Curtailment | Power Shortage/ | |
| Shortage | Power | Curtailment Phenomenon | |
| Without Energy Storage | 1565.4 | 2155 | \ |
| Case 1 | 1462.8 | 606.3 | 8.25 |
| Case 2 | 431.9 | 2172.6 | 11.89 |
| Case 3 | 431.9 | 606.1 | 5.24 |
In summary, the participation of energy storage in system regulation, considering both supply guarantee and consumption promotion, can effectively improve the clean energy consumption rate and supply guarantee level of the regional power grid, while minimizing the unit cost for alleviating power shortages and curtailment. The local power grid can adjust the values of the supply guarantee and consumption promotion indicators according to actual requirements, balancing the economic and social benefits of the grid. Therefore, the simulation results also verify the feasibility and superiority of the proposed coordinated optimization model.
5 Conclusions
Considering the participation of energy storage in system regulation for power supply guarantee and clean energy utilization is a practical requirement for achieving high clean energy utilization rates and low supply guarantee risks in power grids. Based on the characterization of power supply guarantee and clean energy utilization indicators, and with system operation cost as the optimization objective, this paper proposes an energy storage optimization configuration and operation scheme tailored to high-altitude power grids, balancing load supply guarantee and clean energy utilization. The following conclusions are drawn:
(1) Based on the actual operational characteristics of high-altitude power grids, two practical demands “power supply guarantee and clean energy utilization” are identified. Corresponding power supply guarantee and clean energy utilization indicators are proposed according to the grid requirements. These indicators are categorized into clean energy utilization, power limitation, and power shortage indicators, and a generalized model is established to achieve an optimal balance between ensuring power supply levels and promoting the utilization of renewable energy.
(2) By leveraging the regulatory characteristics of electrochemical energy storage and incorporating supply reliability and clean energy utilization constraints, a mixed-integer optimization method was used to determine the optimal locations, rated power, and capacities of energy storage systems, achieving an effective configuration that balances supply reliability and energy utilization.
(3) Through the comparative analysis of three proposed cases, the feasibility and superiority of the optimization strategy that accounts for both supply reliability and clean energy utilization were validated. Compared to scenarios where energy storage systems participate solely in system regulation, the proposed strategy significantly improves the clean energy utilization rate and supply reliability, while minimizing the unit cost of mitigating power shortages and curtailments. Local grids can adjust the weightings of supply reliability and utilization indices based on practical needs to achieve an optimal balance between economic and social benefits.
(4) While the optimization model focuses on minimizing overall system operational costs, it does not ensure the lowest cost for individual stakeholders. Additionally, the model only considers supply reliability risks across a single typical day without accounting for node-specific supply reliability risks within the grid, leading to incomplete consideration of supply reliability indices. Future research should focus on incorporating node-specific supply reliability requirements to enhance the proposed energy storage configuration and operation strategy for high-altitude power grids, ensuring a comprehensive balance between supply reliability and clean energy utilization.
Funding
This research was funded by the State Grid Tibet Electric Power Co., Ltd. Science and Technology Project, grant number 523153240003.
Conflicts of Interest
The authors declare no conflicts of interest.
References
[1] S. A. Hosseini, M. Zolfagharzadeh, A. Sadabadi, et al. Social Acceptance of Renewable Energy in Developing Countries: Chal-lenges and Opportunities[J]. Distributed Generation & Alternative Energy Journal, 2018, 33: 31–48.
[2] Xiangyong Xiao, Zixuan Zheng. New Power Systems Dominated by Renewable Energy Towards the Goal of Emission Peak & Carbon Neutrality: Contribution, Key Techniques, and Challenges[J]. Advanced Engineering Sciences, 2022, 54(1): 47–59.
[3] Zhigang Zhang, Chongqing Kang. Challenges and Prospects for Constructing the New-type Power System Towards a Carbon Neutrality Future[J]. Proceedings of the CSEE, 2022, 42(8): 2806–2819.
[4] Zhenyu Zhuo, Ning Zhang, Xiaorong Xie, et al. Key Technologies and Development Challenges of High Proportion Renewable Energy Power Systems[J]. Automation of Electric Power Systems, 2021, 45(9): 171–191.
[5] Xiaorong Xie, Ningjia Ma, Wei Liu, et al. Functions of Energy Storage in Renewable Energy Dominated Power Systems: Review and Prospect[J]. Proceedings of the CSEE, 2023, 43(1): 158–169.
[6] M. Nedaei, A. Ataei, C. Yoo, et al. The Potential of Wind for Energy Production and Water Pumping in Iran, Saravan County[J]. Distributed Generation & Alternative Energy Journal, 2016, 31: 7–26.
[7] Bin Nan, Shufeng Dong, Kunjie Tang, et al. Optimal Configuration of Energy Storage in PV-storage Microgrid Considering Demand Response and Uncertainties in Source and Load[J]. Power System Technology, 2023, 47(4): 1340–1352.
[8] Z. Shi, W. Wang, Y. Huang, et al. Simultaneous Optimization of Renewable Energy and Energy Storage Capacity With the Hierarchical Control[J]. CSEE Journal of Power and Energy Systems, 2022, 8(1): 95–104.
[9] Yan Zhou, Weimin Liu, Fan Chen, et al. Bi-level Planning of Energy Storage in Distribution Network Considering Demand Response Under Different Penetration Rates of Photovoltaic[J]. High Voltage Apparatus, 2024, 60(10): 64–77.
[10] Shizhao Hu, Shiyu Ji, Jianjian Jiang, et al. Four-Quadrant Energy Storage Planning Method for Enhancing Photovoltaics Consumption Capacity and Safety of Distribution Networks[J/OL]. Southern Power System Technology: 1–11.
[11] N. S. J., D. Gaonkar. An Integrated Control Approach and Power Management of Stand-alone Hybrid Wind/PV/Battery Power Generation System with Maximum Power Extraction Capability[J]. Distributed Generation & Alternative Energy Journal, 2015, 30: 15–36.
[12] N. S. J., D. Gaonkar. An Integrated Control and Management Approach of Stand-alone Hybrid Wind/PV/Battery Power Generation System with Maximum Power Extraction Capability[J]. Distributed Generation & Alternative Energy Journal, 2017, 32: 7–26.
[13] Le Zheng, Wei Hu, Qiuyu Lu, et al. Research on Planning and Operation Model for Energy Storage System to Optimize Wind Power Integration[J]. Proceedings of the CSEE, 2014, 34(16): 2533–2543.
[14] B. Zhao, J. Ren, J. Chen, et al. Tri-Level Robust Planning-Operation Co-Optimization of Distributed Energy Storage in Distribution Networks With High PV Penetration[J]. Applied Energy, 2020, 279: 115768.
[15] Zhanwei Li, Dongfang Fan, Chao Zeng, et al. Research on capacity optimization configuration and operation strategy of energy storage system considering wind and solar consumption[J]. Energy Storage Science and Technology, 2024, 13(8): 2713–2725.
[16] Zhenkun Li, Yijiao Li, Daihong Zhang, et al. Influence Analysis of Energy Storage Device on Reliability of Distribution Network and Its Optimal Allocation[J]. Power System Technology, 2018, 42(11): 3676–3683.
[17] Jinming Zhang, Sen Ouyang, Han Wu, et al. Energy Storage Optimization Configuration on the Grid Side Considering Distribution Network Reliability and Operational Economics[J]. Electric Power Automation Equipment, 2024, 44(7): 62–6885.
[18] J. Zhang, J. Liu, L. Chen, et al. Reliability Evaluation of High Permeability Renewable Energy Distribution Networks Considering Energy Storage Charge and Discharge Strategy[J]. Energy Reports, 2023, 9: 361–368.
[19] H. Xie, X. Teng, Y. Xu, et al. Optimal Energy Storage Sizing for Networked Microgrids Considering Reliability and Resilience[J]. IEEE Access, 2019, 7: 86336–86348.
[20] Xi Xin, Sen Ouyang, Yi Huang, et al. Optimal Economic Configuration and Reliability Evaluation of Multiple Power Supply Ensuring Microgrid Considering Energy Storage Capacity Attenuation[J]. Electric Power Construction, 2024, 45(10): 100–113.
[21] Feng Guo, Yue Wang, Xin Lu, et al. Economic Operation and Energy Storage Configuration of New Power System with High Penetration of Wind Power[J]. Smart Power, 2023, 51(11): 76–82.
[22] Weizhu Du, Kai Bai, Haibo Li, et al. Source-Load-Storage Flexible Resource Optimization Planning that Takes into Account Power Supply and Accommodation[J]. Electric Power Construction, 2023, 44(9): 13–23.
[23] J. Sadhukhan, S. Sen, T. M. S. Randriamahefasoa. Framework for Optimal Energy Storage Duration for Maximum-Reliability Renewable Electricity[J]. Frontiers in Energy Research, 2024, 12.
[24] Wenwen Sun, Yujie Xu, Jie Ding, et al. An energy system for the integration of renewable energy with energy storage in a frigid plateau region[J]. Energy Storage Science and Technology, 2019, 8(4): 678–688.
[25] I. S. Kumar, P. K. Navuri. Optimal Access Point and Capacity of Distributed Generators in Radial Distribution Systems for Loss Minimization Including Load Models[J]. Distributed Generation & Alternative Energy Journal, 2014, 29.
[26] Liqing Jiang, Jindong Yang, Yanjun Yang, et al. Problem Analysis and Simulation Research of Voltage Quality of Rural Power Grid in High-Altitude Remote Areas[J]. Hunan Electric Power, 2022, 42(3): 13–19.
Biographies

Yunyao Chen is a Senior Engineer at Economic & Technological Research Institute, State Grid Tibet Electric Power Co., Ltd. His research focuses on power system planning/design and new-type power system studies.

Bin Li is an Engineer at Economic & Technological Research Institute, State Grid Tibet Electric Power Co., Ltd. His research interests include energy storage system optimization and multi-energy collaborative operation.

Xianlin Deng is an Engineer at Economic & Technological Research Institute, State Grid Tibet Electric Power Co., Ltd. His work focuses on grid-scale storage operation and extreme climate adaptability analysis.

Yuzhou Chen is an Engineer at Economic & Technological Research Institute, State Grid Tibet Electric Power Co., Ltd. His research areas include power grid planning, substation design, and grid project evaluation.

Qingyuan Zhang is an Assistant Engineer at Economic & Technological Research Institute, State Grid Tibet Electric Power Co., Ltd. His primary research covers new-type power systems and power system planning simulations.

Qingxi Liao is an Assistant Engineer at Economic & Technological Research Institute, State Grid Tibet Electric Power Co., Ltd. His research involves renewable-storage coordination and power distribution networks.
Distributed Generation & Alternative Energy Journal, Vol. 40_1, 1–28.
doi: 10.13052/dgaej2156-3306.4011
© 2025 River Publishers