Construction of a Power Communication Supervision System Based on WOA Fusion Fault Detection from the Perspective of Sustainable Development
Yang Li*, Jianliang Zhang, Meiru Huo, Chunshan Zhu, Xiaowei Hao, Yinghao Gao, Leifang Yan and Jian Wu
State Grid Information & Telecommunication CO. Of Shanxi Electric Power Company, Taiyuan 030021, China
E-mail: sxdlxtgs@163.com
*Corresponding Author
Received 17 February 2025; Accepted 31 March 2025
Abstract
This paper focuses on the problems of poor fault localization and easy leakage and false alarms of power communication monitoring system for distribution network segments. A new improved method based on whale optimization algorithm (WOA) is proposed to counter poor fault localization. The new method uses a feeder unit system for power grid data feedback, and enhance the adaptability of the model. The study also conducts iterative performance tests of the model in several distribution network segments. It also compares the performance of the improved WOA model with traditional genetic algorithm (GA), particle swarm optimization (PSO) and other algorithms, and conducts simulation analyses of voltage deviation and fault location time, as well as evaluation of fault location accuracy at different grid nodes. The results show that the improved WOA model is significantly better than the traditional algorithms in terms of iteration speed, and its longest time to reach the optimal solution is 3.12 ms after 6 iterations; this is 3.73 ms less than when compared to the GA. In the comparison test of different sections of the grid, the new proposed model is able to achieve a better objective function value in fewer iterations, and the smallest deviation value in grid Node 3 is only 0.05 pu, the localization time is shortened by 0.10 s compared with the GA, and the localization accuracy is improved by 7.9%. The new proposed algorithm offers better advantages in fault localization, communication monitoring and provides effective technical support for fault monitoring in a power communication monitoring system.
Keywords: WOA, fault detection, distribution network, supervision, sustainable development.
1 Introduction
In the electrical power industry, the stability and effectiveness of the communication systems are crucial to ensuring the reliable operation of the power system [1]. With the increasing global demand for Sustainable Development (SD), the power system not only needs to operate effectively, but also needs to comply with environmental and energy-saving standards [2]. The continual expansion and aging of the power network have made fault detection and communication monitoring in the system more complex, thus requiring the use of more advanced technologies to ensure the continuous smooth operation of the power system [3]. In the context of SD, the power industry is increasingly emphasizing environmental protection and resource efficiency [4]. The monitoring and fault detection technology of the power communication system also needs to follow the principles of environmental friendliness and resource conservation to support the green transformation of the entire power industry [5]. Therefore, using intelligent algorithms for fault prediction and system optimization in power systems is an important strategy for achieving SD and fault detection in power systems.
Whale Optimization Algorithm (WOA) is an emerging intelligent optimization technology that is widely used due to its excellent performance in various optimization problems. In a study using WOA, Wu Z et al. [6] implemented a method based on WOA-Extreme Learning Machine (ELM) to improve the efficiency and accuracy of micro-grid fault diagnosis. By performing wavelet packet decomposition on a 3-phase fault voltage and calculating the energy entropy feature vector of the wavelet packet, combined with the input weights and hidden neuron thresholds of WOA-ELM, an efficient fault diagnosis model was established. This model had a faster learning speed, stronger generalization ability, and higher recognition accuracy when compared to other techniques such as Back Propagation Neural Network (BPNN), Radial Basis Function Neural Network (RBFNN), and ELM [6]. Yang P et al. [7] developed a hybrid multi-strategy WOA and RBFNN-based Electronic Current Transformer (ECT) fault diagnosis model to improve the reliability and accuracy of ECT fault diagnosis. By optimizing the parameters and network size of the RBFNN model, its classification accuracy and robustness were improved. The improved method has shown excellent performance in ECT fault diagnosis, with an accuracy rate of up to 97.77%, significantly better than other methods, demonstrating good engineering practical value [7]. To solve the dynamic problems caused by the penetration of renewable energy in hybrid power systems, Nayak PC and others [8] proposed an innovative method based on h-WOA-SA algorithm, which combines WOA and Simulated Annealing (SA). Through evaluation, h-WOA-SA algorithm was verified to be efficient in computing time and adjustment of adaptation function, and was applied to the scaling of a fuzzy fractional-order Proportional–Integral–Derivative (PID) controller for load frequency control of hybrid power systems. The h-WOA-SA algorithm was highly effective in improving system stability and exhibited unparalleled advantages compared to traditional methods [8].
In summary, most previous optimization studies have been limited to improving a single algorithm and have not fully utilized the potential of multi-algorithm fusion to further improve effectiveness and accuracy. Moreover, previous research has often focused on the detection and diagnosis of power system faults, while there has been less research on the reliability and real-time performance of data transmission in power communication and supervision systems. Therefore, this study proposes an improved algorithm based on the WOA. The proposed algorithm uses an innovative multi-algorithm fusion which results in an improved model. It proposes to use a feeder unit system for power grid data feedback to enhance the accuracy and real-time performance of the algorithm in processing power communication data, in response to the problems of poor fault location effect and data parameters are prone to misstatements, omissions, etc. At the same time, the algorithm introduces a new fitness evaluation criterion to more accurately evaluate the performance in different power grid sections. This study is divided into four main parts, the first part focuses on briefly describing the background of the study and domestic and international research, the second part introduces the content of the methodology used in the current study, the third part verifies the feasibility of the study through experiments, and the fourth part summarizes the content of the article.
2 Methods
2.1 The Impact of Power Distribution on Power Grid Fault Monitoring
In the power industry, the overlap of distributed energy sources in the system has a significant impact on the operation and maintenance of the distribution network. The traditional fault monitoring and regional positioning methods for distribution networks locate fault points through the direction of current flow. When a short circuit occurs in the distribution network, a section of the line will have some current and another part will have no current passing through it, thus indicating whether a fault has occurred. Due to the fact that the direction of current in traditional distribution networks traditionally flows from the main source to the load, the overlap of distributed energy sources affects the direction of current flow, thereby affecting the fault localization technique of the distribution network [9]. Therefore, for fault detection in distribution networks, further analysis is needed to consider the impact of distributed sources on the distribution network.
In Figure 1, the proposed power system uses photovoltaic cells as the main source for system operation, transmitting power to various modules through direct current (DC). The controller controls the conversion and inversion of electricity. The inverter in the system converts the electricity to alternating current (AC) and feeds the AC load of the system and connects to the power grid. Presently, fault data information in distribution networks is generally fed back and located based on feeder terminal units. When the distributed power supply is not connected, when a fault occurs, the feeder terminal units installed at different positions on the segment transmit the fault information to the main system through a data acquisition system. The data acquisition system determines the type and status of faults in the current distribution network based on information. If the segment of the feeder terminal unit is normal, it is marked as 1. Otherwise, if a fault occurs, it is marked as 0.
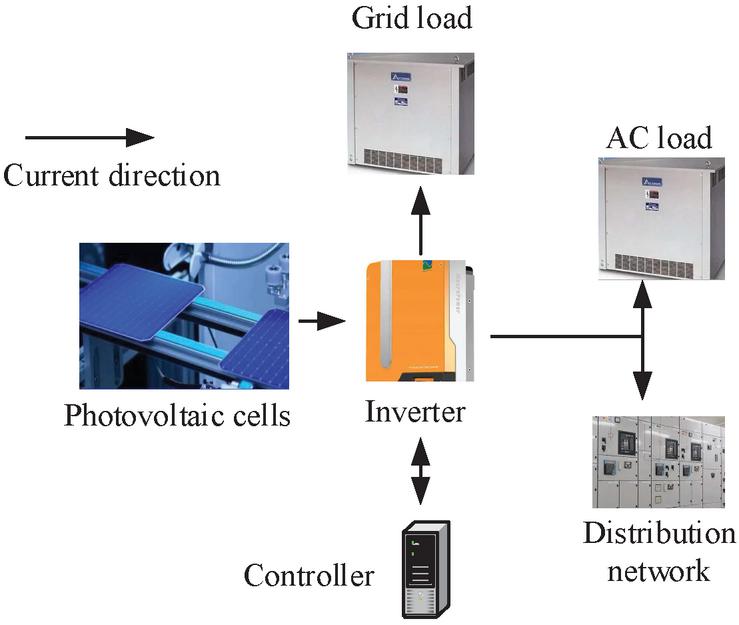
Figure 1 Structure of photovoltaic grid system.
After building a distributed power source, when a fault occurs in the distribution network, the direction of the current at the fault point diverges in two directions. To accurately locate faults, the direction of current is defined as the forward current flowing from the power supply direction to the feeder unit direction [10]. Figure 2 shows the fault model of the power grid with overlapping distributed power sources.
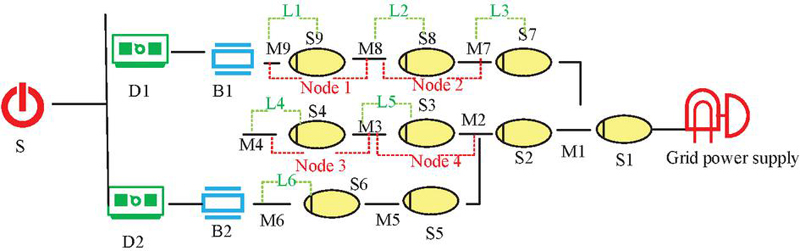
Figure 2 Image of power grid fault model with overlapping distributed power sources.
In Figure 2, S represents the main power supply of the system, and S1-S9 represent different connecting switches. M1-M9 represent the feeders, where each switch is connected. B1 and B2 represent power switches, while D1 and D2 represent distribution network switches. When configuring the distribution network normally, assuming a fault occurs in the M5 and M7 sections, current is displayed in M1, M2, M5, and M7, and the direction of the current is opposite to the normal flow direction. The input data information in the system is 1. If positive current is detected on M8, M9, and M6, the input data in the system is 1. If no current change is detected, the input data information is 0. The location of faults in the distribution network is located through current sequence information.
Due to the fact that the power supplied in a distribution network is generally from one power source, the direction of current is unidirectional. When a fault occurs, the fault detection can be determined based on the direction of the obtained current. Therefore, switch functions can be used to determine the occurrence of faults, as shown in Equation (1) [11].
| (1) |
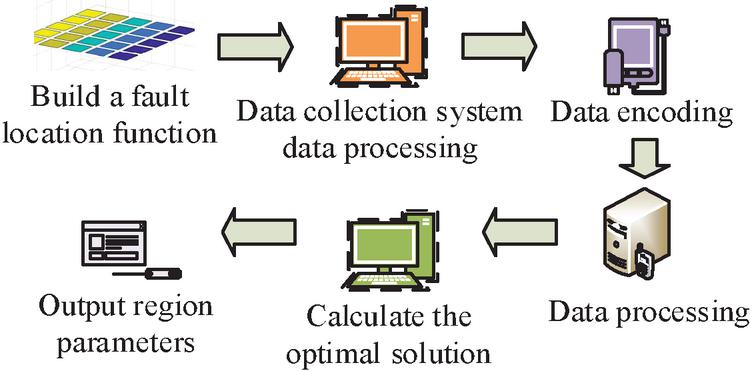
Figure 3 Fault localization flowchart.
In Equation (1), represents the expected value of the current switch . indicates that the current switch is in the lower position of the fault point. represents the logical operation of the switch. represents the feeder area. After connecting multiple distributed power sources in the power grid, there are two directions of current possible due to the existence of multiple power sources. The data information changes of the model are shown in Equation (2) [12].
| (2) |
In Equation (2), and represent the expected data values for the upper and lower sections respectively of the switch. The expected value of system data can be used to determine the fault location in the distribution network. In the data collection module of the power communication system, the collected data information is used to analyze the transmitted data and determine the localization of the fault area.
Figure 3 shows the fault location flowchart. The distribution network will first build fault location functions, according to Equations (1) and (2), and then transmit the detection signal to the data acquisition system through the feeder terminal unit. The system encodes and evaluates the data information, inputs it into the overall system module, processes the information, calculates the optimal solution of the current data, and finally outputs the parameters of the fault area.
2.2 Fault Area Localization in Power Supervision System Based on Improved WOA
Determining the fault location is crucial for determining the entire fault area in the process of fault localization in the distribution network. Analyzing it solely through a data acquisition system can lead to localization bias. Therefore, this study uses an improved WOA to analyze the power supervision system to find the optimal solution for the parameters of the fault area, in order to achieve fault localization in the distribution network. Equation (3) is the WOA parameter update formula [13].
| (3) |
In Equation (3), and represent the maximum and minimum values, respectively, of the convergence factor; represents a range of random values from 0 to 1; represents the degree of deviation; represents a random normal distribution value. As the model iterates to the end, it gradually loses the diversity of the population. To ensure the diversity of the algorithm, interference is applied to the model through Equation (4) [14].
| (4) |
In Equation (4), represents the best individual in the -th dimension of the algorithm. represents a normal distribution, with a normal distribution value of 0 and a variance value of 1. Due to the tendency of WOA to have a concentrated population during parameter updates, the diversity of the population decreases significantly. Therefore, to avoid WOA falling into local optima in the later stages of iteration, the model iteration update formula shown in Equation (5) is obtained [15].
| (5) |
In Equation (5), represents the optimal position distance in the -dimensional space of the -th whale; represents the size of the local cosine value region of an individual. represents a constant; represents the iteration number of the algorithm; the value will decrease as the number of iterations increases; represents the time index. By narrowing the search range of the algorithm, the algorithm can achieve global optimization. Figure 4 shows the flowchart of the improved algorithm.
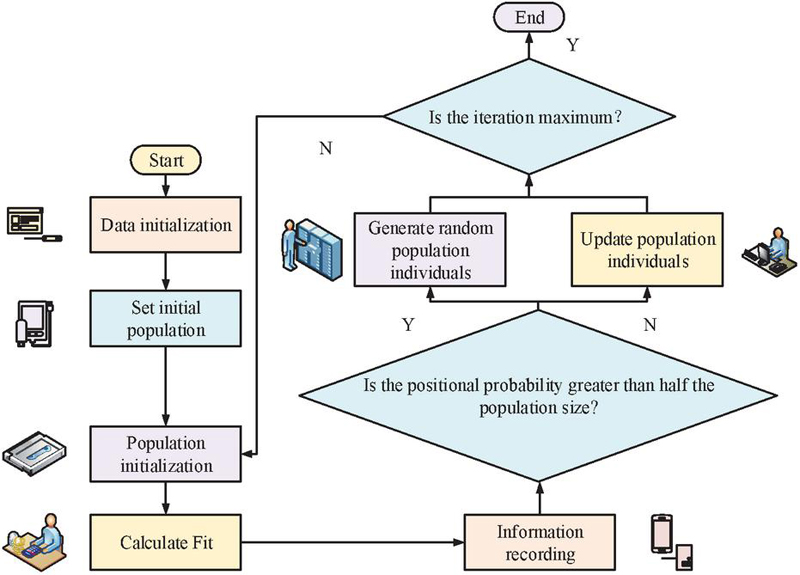
Figure 4 Improved WOA algorithm flowchart.
In Figure 4, the improved WOA algorithm (also called the proposed algorithm, or IWOA) first initializes the algorithm parameters, sets the initial population size, population search space, and maximum iteration number. The population is initialized, and the fitness of the population is calculated. Information such as the position of individuals in the population is recorded. By updating the parameters of the algorithm through the convergence factor of the population, it is determined whether the position probability of the current algorithm is greater than Half of the population size. If it is greater than Half of the population size, a randomly generated population is generated; and, if it is less than Half of the population size, the random individuals are updated. Finally, by calculating and analyzing the fitness of the population, it is determined whether the current iteration has reached the maximum iteration limit. If it reaches the maximum iteration limit, the calculation is terminated and the population position and fitness are outputted. If it does not reach the maximum iteration limit, the iterative calculation continues.
By improving WOA to locate and analyze the fault area, the fault location flowchart shown in Figure 5 is obtained.
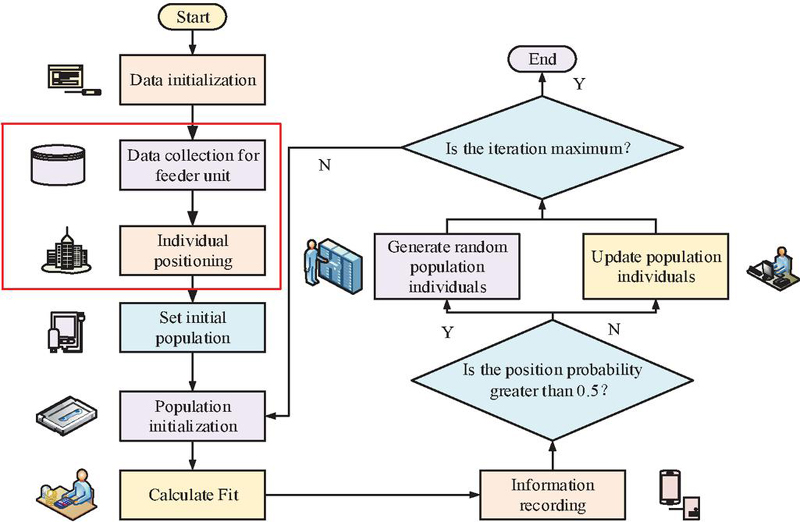
Figure 5 Fault localization flowchart.
In Figure 5, during the fault location process of the power system, it is necessary to first collect data information through the feeder unit, and then locate the population and individual information through the collected data information, set the maximum iteration number of data parameter sizes, etc. to calculate the opposing positions of individuals based on the randomly generated individual positions, and calculate their fitness. The optimal fitness is calculated as the initial fitness of the population, and the subsequent process of convergence factor in Figure 4 is repeated. Finally, the optimal value obtained will be subjected to binary analysis to determine the size of the binary output value in the current region, and then analyze the fault situation in the current region. Due to the fact that in the calculation process of the algorithm’s adaptability, the size of the adaptability will affect the evaluation of algorithm faults. Therefore, to reduce the deviation caused by false alarms in the feeder unit, the positioning adaptability is re-analyzed according to the calculation formula given in Equation (2.2) [16].
In Equation (2.2), represents the total number of switches; represents the expected value at the -th switch when there is an error or omission in the feeder unit; and both represent the variable values when an error occurs; represents the weight size of the algorithm. The weights from to are set to 20, 0.5, 1 and 1, respectively. The logical expression formula of the feeder terminal system after receiving the encoded signal is given in Equation (7) [17].
| (7) |
In Equation (7), represents the received signal of the feeder unit; and represents logical operation. There are three types of signals received in the algorithm: “0”, “1”, or “1”. When the received signal is “-1”, the expression of the system’s error variable is given in Equation (8) [18].
| (8) |
In Equation (8), both and represent the variable values under error conditions. The constraints of the overall algorithm obtained by combining the above formulas are shown in Equation (9).
| (9) |
In Equation (9), the variable constraint situation when the output parameter of the algorithm code is “1”. When the encoding output is “0”, then , and the logical expression of the algorithm is given in Equation (10) [19].
| (10) |
When the encoding output parameter of the algorithm is “1”, the expression of the algorithm is given in Equation (11) [20].
| (11) |
Based on the constraints of the algorithm, the values of different variables in the current algorithm can be determined. Reducing the dimensionality of the algorithm by taking values can help improve the fault localization accuracy of the algorithm [21–23]. By locating faults in the power supervision system, fault detection and analysis can be achieved.
Figure 6 shows the flowchart of the fault location and monitoring system. Here, it is necessary to first determine the fault areas in different parts, locate the fault section, and collect information on the feeder units on different switches through the feeder terminal system. The faulty state information parameters are encoded and an improved WOA algorithm is used for initial population analysis. Calculating the adaptability based on the error situation of different feeder units, and determining whether the current algorithm can complete the termination iteration based on the positioning situation of the improved algorithm. If it is completed, it is used to locate the fault area. If it is not completed, it is necessary to recalculate the adaptability. When the best fit is finally obtained, it confirms the current optimal individual position and then determines whether the best individual is consistent with the fault location: if it is consistent, it outputs the result; if it is inconsistent, it is necessary to re-encode through an improved algorithm.
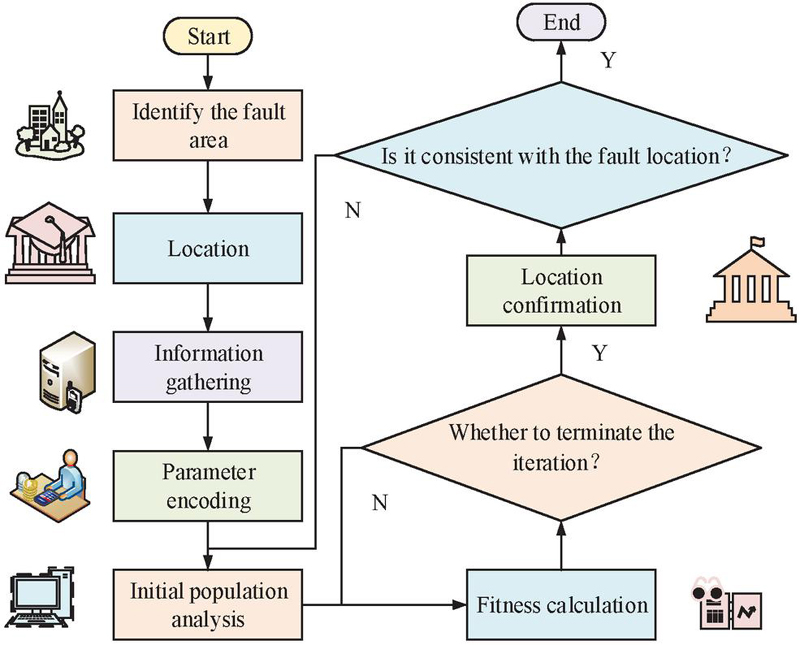
Figure 6 Flow chart of fault location and supervision system.
3 Results
To verify the actual performance of the improved WOA, the algorithm used the hardware based on an Intel (R) Core (TM) i7-10510U central processor for data processing, with the operating memory size of the system is 32 GB. Windows 10 was selected as the computer operating system and MATLAB R2020a was the simulation program for the algorithm. The maximum number of iterations of the algorithm was set to 1000, and the number of whale populations was 40.
The following tests are used to compare the performance of four different algorithms:
1. Performance comparison of different algorithms: Testing the performance of the algorithms used in the research (Figure 7).
2. Comparison of iterative performance of different algorithm models in a single segment: Testing the iterative performance of different methods (Figure 8).
3. Comparison of multi segment changes in distribution networks: Analyze the objective function changes in distribution networks using different methods, and evaluate the performance of different methods in power grid testing (Figure 9).
4. Comparison of voltage changes at different nodes: Testing the stability of power grid operation using different methods (Figure 10).
5. Comparison of fault localization time: Testing the localization efficacity of different methods (Figure 11).
6. Comparison of fault diagnosis accuracy in different road sections: Testing the fault recognition effect of different distribution network lines (Table 1).
3.1 Analysis of Performance Comparison Results with Four Algorithms
The following four optimization algorithms were compared to find the optimal performance solution: Traditional Particle Swarm Optimization (PSO), Genetic Algorithm (GA), WOA and improved WOA (proposed method or algorithm, IWOA). The comparison results for the four algorithms are shown in Figure 7; the graph shows the time required (in ms) to reach an optimal solution versus the number of iterations. Note that in the comparison of the four algorithms, the shorter the time required for each algorithm to reach its optimal solution the fewer the data parameters that are required. It can be seen that in the comparison of the four algorithms, the optimal solution of the proposed algorithm (Improved WOA) provides the best performance.
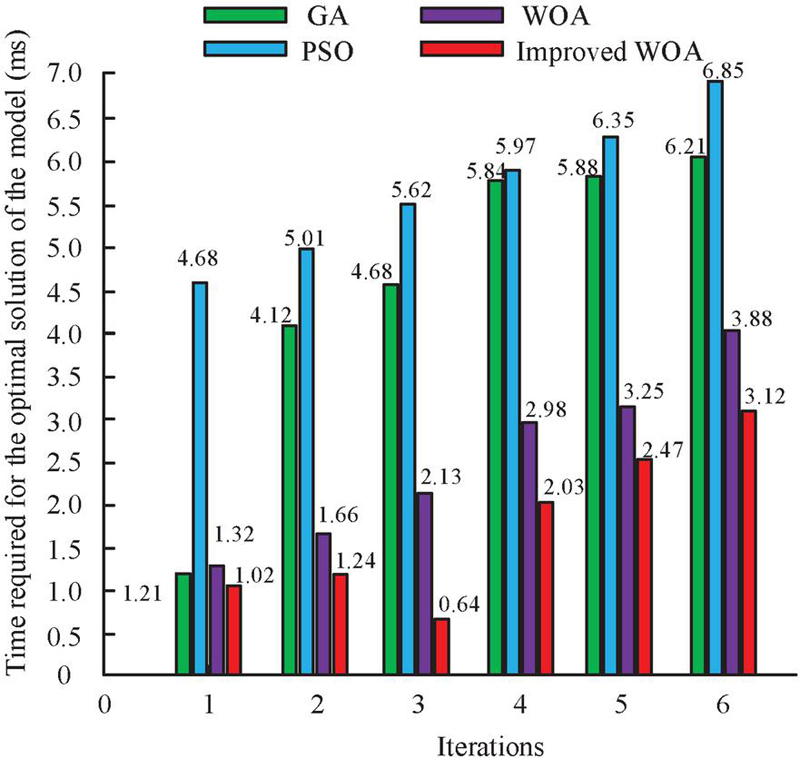
Figure 7 Performance comparison of four algorithms for optimal solution of the algorithm.
In Figure 7, it can be seen that in the comparison of the optimal solution situation of different algorithmic model iterations, the optimal iteration of the model used for the study will be the first to appear in different iteration numbers. The standard deviation of the optimal solution of the model at 1 and 3 iterations is 0.00 ms, which indicates that the model will directly carry out the optimal solution iteration in the process of data iteration. Out of the 6 iterations, the study used the shortest time for the model to enter the optimal solution. Where the shortest time occurs when the number of iterations is 1. The optimal solution time of the four models increases with the number of iterations, where the longest time to enter the optimal solution is for the GA algorithm model, where the longest time occurs when the number of iterations is 6. The average value of the time to enter the optimal solution is 6.85 ms, which is an increase of about 3.73 ms compared to the optimal solution time of the research use model of 3.12 ms.
In order to test the effect of iterative localization of the model in different distribution network fault monitoring, the algorithmic analysis of the single-area localization case of the distribution network is obtained. is shown in Figure 8. For multi-point fault location analysis, considering the randomness of different numbers of DG connections and fault sections, multiple fault scenarios were selected. Based on the DC distribution network system, conditions of two fault areas were analyzed. When the fault area is 1, the function of the distribution network is represented as , , . The order of the power grid fault report information is [1,1,0,0,0,0,0,0,0], indicated at feeder M1.
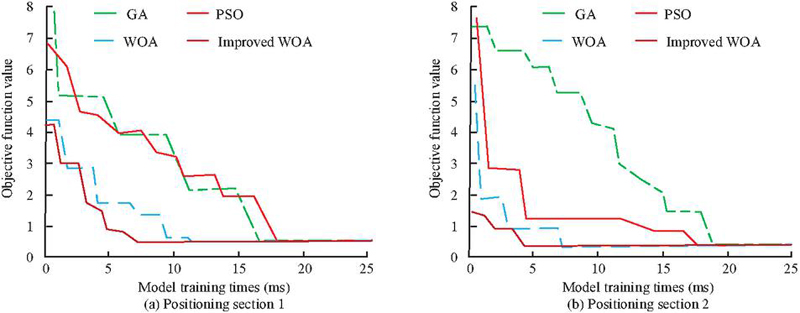
Figure 8 Comparison of iterative performance of different algorithms in a single segment.
In Figure 8(a), in the comparison of algorithm iteration effects in Positioning Section (or Segment) 1, the objective function value of the algorithms shows a stepwise decreasing trend, and after reaching a certain iteration number value, a relatively stable objective function value appears. Among the four algorithms, the initial value of the objective function of the proposed algorithm is relatively small (i.e., objective function value of 4.2), but the downward trend is more rapid. When the number of iterations is 7, the minimum objective function value of 0.5 is reached. This indicates that the proposed algorithm has the best performance of processing distribution network parameters.
In Figure 8(b), in the testing of Positioning Section 2, the minimum objective function value of the proposed algorithm reaches the minimum value of 0.4 at 5 iterations, while the initial minimum objective function is 1.5. Compared to Positioning Section 1, the algorithm in Positioning Section 2 has a smaller objective function value during initialization and a shorter number of iterations to achieve the minimum objective function value. This is due to the fact that Positioning Section 2 is further away from the distributed power sources.
Comparing the situation of multiple sections in the distribution network, the changes are shown in Figure 9. In Figure 9(a), in the multi-segment algorithm localization analysis, the objective function value of the proposed algorithm reaches the minimum objective function value of 0 at 10 iterations. In the comparison of the four algorithms, the initial minimum objective function value of the proposed algorithm is the smallest, and the number of iterations to achieve the minimum objective function value for segment positioning is shorter. This indicates that in the process of multi-segment localization, the performance of the proposed algorithm and the effectiveness of fault localization are better. In Figure 9(b), when locating faults in section 2, the initial objective function value of the proposed algorithm is smaller (i.e., only 1.3), and the minimum objective function value (0) of the algorithm is reached in 5 iterations. Compared to other algorithms, the proposed algorithm has the smallest number of iterations to achieve the minimum objective function value. Compared to the 23 iterations of the GA algorithm, the iterations decreased by 18, indicating that the proposed algorithm has a good segment localization effect during the localization process.
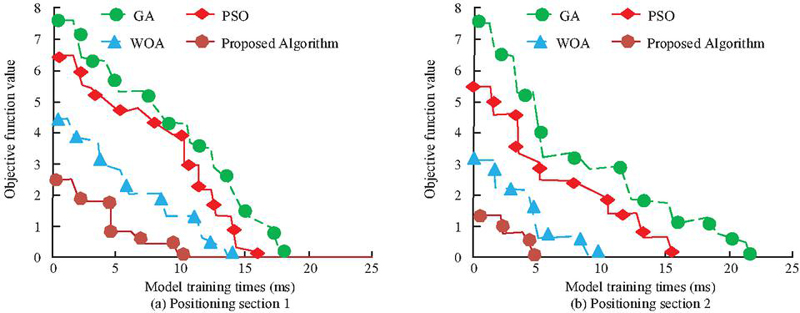
Figure 9 Comparison of changes in multiple sections of the distribution network.
3.2 Comparison of Section Positioning Effects
The section situation of the distribution network is simulated and analyzed. The voltage intensity of the power grid is set at 12.88 kV, the reference power is 12 MVA, and the load size of the power grid is 3845+j2300 kVA. The test nodes are shown in Figure 2, The power grid losses of different nodes are: 201.548 kW without using distributed power sources, 160.284 kW for Node 1, 125.485 kW for Node 2, 105.485 kW for Node 3, and 95.358 kW for Node 4. The power size of the distributed power supply connected to the node is 600 kW.
The voltage comparison test of power grid energy consumption under the four different grid node conditions mentioned above is shown in the Figure 10. The ratio of voltage represents the deviation between the actual voltage and the reference voltage. The closer the deviation value is to 1 pu, the better the stability of the node and the less likely it is to fail. In Figure 10, during the voltage variations testing for four different nodes, the voltage deviation values for different node conditions first decrease, then begin to rise linearly, and finally show a downward trend in the connected voltage deviation. In the comparison of different nodes, the voltage deviation value of Node 3 varies less, and the maximum deviation from maximum to minimum is 0.05 pu. The maximum deviation of nodes that are not connected to distributed power sources can reach 0.09 pu. This indicates that the voltage deviation of the algorithm becomes more severe as the network loss increases. This may be the reason for node failures caused by severe network loss, which also indicates that the more severe the network loss, the more likely nodes are to fail.
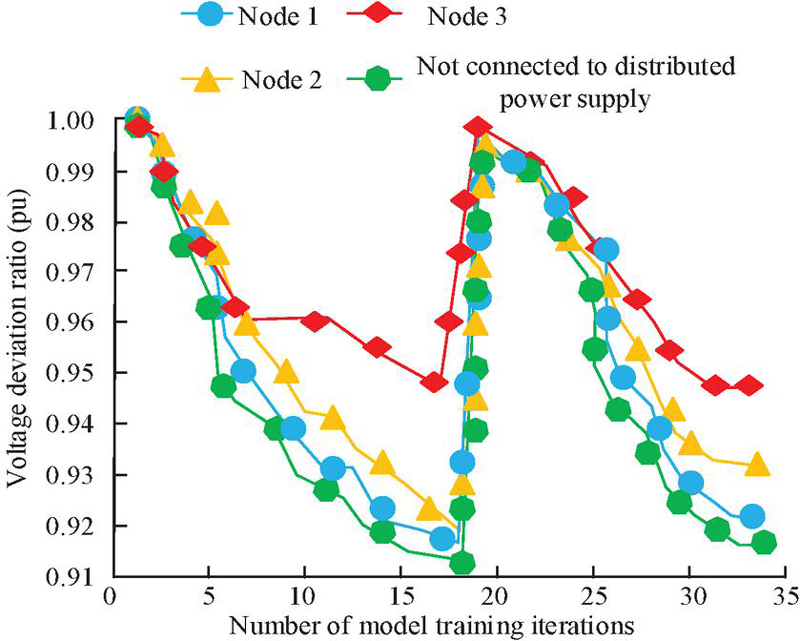
Figure 10 Comparison of voltage changes at different nodes.
Comparing the fault localization time of the four algorithms mentioned above, Figure 11 is obtained. In Figure 11(a), in the single section fault time localization of the algorithm, the proposed algorithm has a shorter localization time, which is basically stable between 1.90 s. The positioning time of GA varies greatly, with a maximum time span of 0.10 s, and its average positioning time is approximately 2.10 s. The single area positioning time of GA is longer compared to the proposed algorithm, with an increase of about 0.20 s in time. This may be due to the longer data processing time of GA. In Figure 11(b), during the multi-segment positioning process, the positioning time of the proposed algorithm is basically stable at around 1.85 s, and the GA is between 1.95 s. Compared to the proposed algorithm, GA increases the multi-segment positioning time by about 0.10 s. However, the multi-segment positioning time in all algorithms is shorter than that of a single segment, which may be due to the installation of more distributed power sources in multi-segment positioning, resulting in faster data processing efficiency. In summary, the proposed algorithm has better fault localization performance in different sections. Due to significant deviations in the testing results of the later sections, 8 sections in the power grid are selected for testing, all of which are close to the distributed power supply section. The fault area is mainly represented by the feeder area in Figure 2, where feeder M1 corresponds to fault area L1, feeder M2 corresponds to fault area L2, and so on.
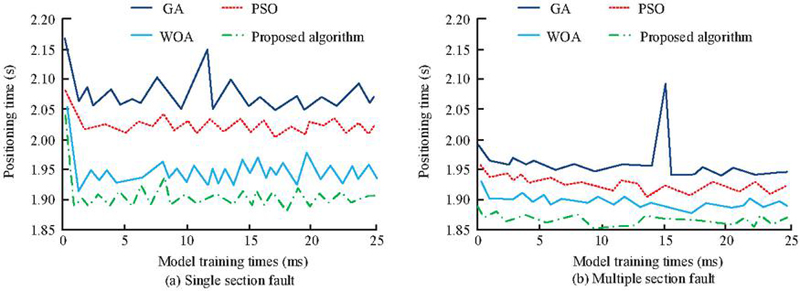
Figure 11 Comparison of fault location time.
In Table 1, the four algorithms show differences in the accuracy of section fault testing. Among them, the fault localization accuracy of the proposed algorithm is the best; for example, it reaches the highest accuracy (94.7%) in fault localization of fault section L2. Compared with GA (86.8%), its accuracy has improved by about 7.9%. The positioning accuracy at fault section L6 is the smallest, with an accuracy of 90.2%, which is about 16.3% higher than GA’s 73.9%. In summary, in the fault location of power grid sections, the proposed algorithm has the best monitoring and positioning performance on the power grid.
Table 1 Comparison of fault diagnosis accuracy in different sections
| Positioning Accuracy (%) | |||||
| Fault Node | Fault Section | GA | PSO | WOA | Proposed Algorithm |
| 1 | L1 | 89.2% | 90.1% | 92.3% | 93.5% |
| 2 | L2 | 86.8% | 88.6% | 91.7% | 94.7% |
| 3 | L3 | 84.8% | 87.4% | 90.6% | 94.5% |
| 4 | L4 | 81.2% | 80.3% | 91.4% | 93.7% |
| 5 | L5 | 78.6% | 83.5% | 91.1% | 93.4% |
| 6 | L6 | 71.5% | 82.8% | 90.2% | 90.2% |
| 7 | L7 | 73.9% | 74.9% | 89.4% | 91.4% |
| 8 | L8 | 66.8% | 69.7% | 90.3% | 91.5% |
4 Conclusion
The study proposes a new algorithm based on the Improved Whale Optimization Algorithm (IWOA) in response to the challenges of power communication monitoring systems in fault location in distribution network segments. The algorithm provides real-time feedback of grid data through the feeder unit system, which enhances the accuracy and real-time data processing. A new fitness evaluation criterion is also introduced to more accurately assess the performance of the algorithm in different grid segments. In addition, the study conducts comparative tests on the algorithm performance of different algorithms and iterative performance tests on several distribution grid segments. The results indicate that in multi-stage fault localization, the objective function value of the proposed algorithm reaches the minimum objective function value of 0 after 10 iterations. Among different algorithms, the segment localization effect of the proposed algorithm was the best, and the number of iterations to achieve the optimal objective function were the smallest.
In the comparison of node voltage deviation, the minimum deviation value of Node 3 was only 0.05 pu. The more severe the network loss, the higher the probability of power grid failure. In single segment fault localization, the maximum time localization difference of the proposed algorithm could reach 0.10s, which was 0.20s shorter than the localization time of GA. In multi-segment positioning, the proposed algorithm shortened the time by 0.10s compared to GA. In terms of the change in fault localization accuracy of the algorithm, the highest accuracy of the proposed algorithm at Fault Section L2 was 94.7%, which was 7.9% higher than that of GA. It can be seen that the new algorithm not only improves the fault monitoring effect of the power communication monitoring system, but also has great significance for the sustainable development and green transformation of the power industry.
Despite the results achieved, there are still some shortcomings in the study, such as how to perform data feedback without using too many feeder units, and the algorithm can only locate the faults without identifying the fault types at present. Therefore, subsequent studies will investigate the use of a limited number of feeder cells for analysis and improve the algorithm performance to enable it to monitor fault types.
Fundings
The research is supported by the Science and Technology Project of State Grid Shanxi Electric Power Company (52051C230003).
References
[1] He Y. Multi-modal information analysis for fault diagnosis with time-series data from power transformer. International Journal of Electrical Power & Energy Systems. 2023, 144(1):108567–108568.
[2] Souza BJ, Stefenon SF, Singh G, Freire RZ. Hybrid-YOLO for classification of insulators defects in transmission lines based on UAV. International Journal of Electrical Power & Energy Systems. 2023, 148(2):108982–108983.
[3] Kumar K, Pande SV, Kumar TC, Saini P, Chaturvedi A, Reddy PC, Shah KB. Intelligent controller design and fault prediction using machine learning model. International Transactions on Electrical Energy Systems. 2023, 2023(1):1056387–1056388.
[4] Borousan F, Hamidan MA. Distributed power generation planning for distribution network using chimp optimization algorithm in order to reliability improvement. Electric Power Systems Research. 2023, 217(1):109–110.
[5] Sun Y, Zhu D, Li Y, Wang R, Ma R. Spatial modelling the location choice of large-scale solar photovoltaic power plants: Application of interpretable machine learning techniques and the national inventory. Energy Conversion and Management. 2023, 289(1):117198–117199.
[6] Wu Z, Lu X. Microgrid Fault Diagnosis Based on Whale Algorithm Optimizing Extreme Learning Machine. Journal of Electrical Engineering & Technology. 2024, 19(3):1827–1836.
[7] Yang P, Wang T, Yang H, Meng C, Zhang H, Cheng L. The performance of electronic current transformer fault diagnosis model: Using an improved whale optimization algorithm and RBF neural network. Electronics. 2023, 12(4):1066–1067.
[8] Nayak PC, Mishra S, Prusty RC, Panda S. Hybrid whale optimization algorithm with simulated annealing for load frequency controller design of hybrid power system. Soft Computing. 2023, 16(6):1–24.
[9] Men Z, Hu C, Li YH, Bai X. A hybrid intelligent gearbox fault diagnosis method based on EWCEEMD and whale optimization algorithm-optimized SVM. International Journal of Structural Integrity. 2023, 14(2):322–36.
[10] Chen X, Cheng L, Liu C, Liu Q, Liu J, Mao Y, Murphy J. A WOA-based optimization approach for task scheduling in cloud computing systems. IEEE Systems journal. 2020, 14(3):3117–3128.
[11] Presekal A, Ştefanov A, Rajkumar VS, Palensky P. Attack graph model for cyber-physical power systems using hybrid deep learning. IEEE Transactions on Smart Grid. 2023, 14(5):4007–4020.
[12] Hasan MK, Habib AA, Shukur Z, Ibrahim F, Islam S, Razzaque MA. Review on cyber-physical and cyber-security system in smart grid: Standards, protocols, constraints, and recommendations. Journal of Network and Computer Applications. 2023, 209(1):103540–103541.
[13] Wagle R, Sharma P, Sharma C, Amin M, Rueda JL, Gonzalez-Longatt F. Optimal power flow-based reactive power control in smart distribution network using real-time cyber-physical co-simulation framework. IET Generation, Transmission & Distribution. 2023, 17(20):4489–4502.
[14] Fernandez JH, Omri A, Di Pietro R. Power grid surveillance: Topology change detection system using power line communications. International Journal of Electrical Power & Energy Systems. 2023, 145(10):108634–108635.
[15] Chakraborty S, Saha AK, Chhabra A. Improving whale optimization algorithm with elite strategy and its application to engineering-design and cloud task scheduling problems. Cognitive Computation. 2023 Sep;15(5):1497–1525.
[16] Singh H, Rai V, Kumar N, Dadheech P, Kotecha K, Selvachandran G, Abraham A. An enhanced whale optimization algorithm for clustering. Multimedia tools and applications. 2023, 82(3):4599–4618.
[17] Yu H, Sun L, Wu B. Microgrid fault diagnosis based on whale optimization algorithm optimizing BP neural network. In Eighth International Conference on Energy System, Electricity, and Power (ESEP 2023) 2024, 13159(5):2130–2135.
[18] Nayak PC, Mishra S, Prusty RC, Panda S. Hybrid whale optimization algorithm with simulated annealing for load frequency controller design of hybrid power system. Soft Computing. 2023, 16(6):1–24.
[19] Hocine T, Saliha C. Hybrid improved whales and sine cosine optimization algorithms for the optimal configuration of distribution networks in the presence of dispersed generation systems before, during, and after short circuit current propagation case study: overhead and underground networks in the laghouat region of Algeria. Electrical Engineering. 2024, 106(1):755–771.
[20] Mahmoud MM, Atia BS, Esmail YM, Ardjoun SA, Anwer N, Omar AI, Alsaif F, Alsulamy S, Mohamed SA. Application of whale optimization algorithm based FOPI controllers for STATCOM and UPQC to mitigate harmonics and voltage instability in modern distribution power grids. Axioms. 2023, 12(5):420–421.
[21] J. Morales Pedraza. The Role of Renewable Energy in the Transition to Green, Low-Carbon Power Generation in Asia, GLCE, 2023,1(2):68–84.
[22] Rana AS, Jnaneswar K, Gadhiraju MK, Kumar N, Wani SA, Thomas MS. Design and Implementation of Low-Cost PMU for Off-Nominal Frequency and DDC in Compliance with IEEE C37. 118 Standard. Distributed Generation & Alternative Energy Journal. 2023, 3(1):519–546.
[23] Nethravathi S, Murali V. A Novel Knapsack Algorithm-Based Energy Routing in a Microgrid. Distributed Generation & Alternative Energy Journal. 2023, 3(1):641–668.
Biographies

Yang Li, born in April 1978, male, from Laizhou City, Shandong Province, China. He obtained his PhD in Mechanical Design and Theory from Harbin Institute of Technology in November 2008. In March 2011, postdoctoral fellow at Inspur Group and Shandong University, with a research focus on data mining.
Work experience: From 2011 to 2012, worked as a pre planning specialist in the System Management Department of Shanxi Electric Power Communication Center. From 2012 to this year, worked as a fourth level employee in the Technical Development Department of the Information and Communication Branch of State Grid Shanxi Electric Power Company.
Academic situation: Published more than 10 articles indexed in EI and SCI, authorized more than 20 patents, completed more than 10 scientific and technological projects, and won two Shanxi Provincial Science and Technology Progress Awards.

Jianliang Zhang, born in June 1981, male, from Wutai, Shanxi, Han ethnicity. He obtained a Bachelor’s degree in Electronic Science and Technology from Jilin University in 2004 and a Master’s degree in Electronic and Communication Engineering from Taiyuan University of Technology in 2013, with a research focus on power communication.
Work experience: From 2006 to 2012, worked as a communication operation and maintenance specialist at Shanxi Electric Power Communication Center. From 2013 to 2022, worked as a technology management specialist at the Information and Communication Branch of State Grid Shanxi Electric Power Company. From 2023 to present, worked as a material management specialist at the Information and Communication Branch of State Grid Shanxi Electric Power Company.
Academic situation: Led or participated in 14 scientific and technological projects undertaken by Shanxi Province, State Grid Corporation of China, and provincial companies; Published 1 book, 6 papers in Chinese core journals, 9 papers indexed by EI, and 8 authorized invention patents; Received one second prize for scientific and technological progress in Shanxi Province and six other provincial and ministerial level innovative achievements.

Meiru Huo, born in October 1987, female, from Fenyang, Shanxi, Han ethnicity. She obtained a Bachelor’s degree in Physics from Shanxi University (National Base) in 2012 and a PhD in Optics from Shanxi University in 2018 (combined master’s and doctoral studies). Her research interests include quantum optics, quantum communication, blockchain, and artificial intelligence technology research and applications.
Work experience: From 2018 to 2020, worked as a communication operation and maintenance specialist at the Information and Communication Branch of State Grid Shanxi Electric Power Company. From 2020 to 2022, worked as a communication dispatch team leader at the Information and Communication Branch of State Grid Shanxi Electric Power Company. From 2022 to present, worked as a digital pre management specialist at the Information and Communication Branch of State Grid Shanxi Electric Power Company.
Academic situation: Accumulated publications in SCI EI. There are a total of 12 papers published in Chinese core journals, 3 authorized invention patents, and nearly 20 awards for various scientific and technological innovation achievements. We have mainly participated in 3 science and technology projects of the State Grid Corporation of China headquarters and 5 science and technology projects of provincial companies.

Chunshan Zhu, born in February 1973, male, from Wuqing, Tianjin, Han ethnicity, obtained a Bachelor’s degree in Communication Engineering from North China Electric Power University in 1995, with a focus on power communication.
Work experience: From 2019 to 2022, served as the Party Secretary of the Information and Communication Branch of State Grid Shanxi Electric Power Company; From 2022 to present, General Manager of Information and Communication Branch of State Grid Shanxi Electric Power Company.
Academic situation: Published 2 papers in Chinese core journals; Authorized 3 invention patents.

Xiaowei Hao, born in September 1982, male, from Yuncheng, Shanxi, Han ethnicity. He obtained a Bachelor’s degree in Electronic Information Engineering from North China Electric Power University in 2004 and a Master’s degree in Electronic and Communication Engineering from Taiyuan University of Technology in 2008, with a focus on power communication.
Work experience: Since 2017, I have been working as a team leader at the Information and Communication Branch of State Grid Shanxi Electric Power Company.
Academic situation: Published 3 papers including Chinese core papers; Authorized 3 invention patents.

Yinghao Gao, July 1990, male, Lvliang City, Shanxi Province, Han ethnicity, obtained a PhD in Optics from Shanxi University in 2019, with a research focus on Communication
Work experience: Since 2019, I have been the team leader of the Communication Center at the Information and Communication Branch of State Grid Shanxi Electric Power Company.
Academic situation: Published 3 SCI papers, 1 patent, researched maintenance ticket reporting tools based on RPA technology, and researched and applied key technologies for power emergency communication based on satellite communication and Beidou positioning.

Leifang Yan, born in November 1990, female, from Shuozhou, Shanxi, Han ethnicity. She obtained a Bachelor’s degree in Communication Engineering from Shandong University in June 2014 and a Master’s degree in Communication and Information Systems from Shandong University in June 2017, with a focus on machine learning.
Work experience: Since 2017, I have been working as a team leader at the Information and Communication Branch of State Grid Shanxi Electric Power Company.
Academic situation: Published 3 SCI papers and 3 core Chinese papers; Authorized 3 invention patents and accepted 5 invention patents; Received 4 excellent paper awards from the Chinese Society of Electrical Engineering and other organizations.

Jian Wu, born in February 1990, male, from Xiangfen, Shanxi, Han ethnicity. He obtained a Bachelor’s degree in Communication Engineering from the University of Electronic Science and Technology of China in 2012 and a Master’s degree in Communication and Information Systems from the same university in 2015. His main research focus is on technologies related to the planning and construction of power communication systems.
Work experience: From 2015 to 2018, worked as a specialist in the Operations and Inspection Center of the Information and Communication Branch of State Grid Shanxi Electric Power Company. From 2018 to 2019, served as the team leader of the Operations and Inspection Center of the Information and Communication Branch of State Grid Shanxi Electric Power Company. From 2019 to present, worked in the Communication Planning and Management Department of the Technology Development Department of the Information and Communication Branch of State Grid Shanxi Electric Power Company.
Academic situation: Published 4 core Chinese papers such as “Intelligent Recognition of Fiber Optic Links Based on Physical Address Encoding”, authorized 6 invention patents, undertaken key research projects of State Grid Shanxi Electric Power Company multiple times, won multiple awards such as the first prize for scientific and technological progress of the provincial company, and was awarded as an excellent engineer in Shanxi’s power industry during the 13th Five Year Plan period.
Distributed Generation & Alternative Energy Journal, Vol. 40_2, 333–360.
doi: 10.13052/dgaej2156-3306.4026
© 2025 River Publishers