Evaluation and Enhancement Method of the Distributed Photovoltaic Carrying Capacity Based on Combined Energy Router
Ziang Zhang1, Ning Han2, Jianfei Chi3, Bin Luo1, Bo Zhou3, Cong Yu1, Chuanjiang Liu1 and Jingyue Wang2,*
1Zhejiang Rongda Electric Power Engineering Co., Ltd, Hangzhou 311400, China
2Jilin Northeast Electric Power University Technology Development Co., Ltd, Jilin 132011, China
3State Grid Zhejiang Electric Power Co., Ltd. Hangzhou Fuyang District Power Supply Company, Hangzhou 311400, China
E-mail: 1344851947@qq.com
*Corresponding Author
Received 24 February 2025; Accepted 29 March 2025
Abstract
As more and more distributed photovoltaic (DPV) systems are connected to distribution substation, it has severely exceeded the limits of the carrying capacity for the DPV in the substation. Consequently, this leads to problems such as reverse power flow, voltage violation, and harmonic pollution at the point of common coupling. To solve these problems, a combined energy router (CER) based on hybrid distribution transformer and energy storage system is proposed. Firstly, the distribution substation architecture with the CER and the power flow direction are introduced. Secondly, the topology and control strategy of the CER are presented. Thirdly, a carrying capacity evaluation model considering different constraints is established based on the limited factors of the DPV carrying capacity. Through linear calculations, the DPV carrying capacity is evaluated under different methods. Additionally, the economic benefits derived from the CER are verified by utilizing electricity prices. Finally, a DPV simulation system based on CER is established in MATLAB/Simulink to verify the feasibility of the proposed method in terms of enhancing the DPV carrying capacity.
Keywords: Distributed photovoltaic carrying capacity, reverse power flow, voltage violation, hybrid distribution transformer, energy storage system, combined energy router, power quality.
1 Introduction
Recently, the International Energy Agency (IEA) released its Renewable Energy Report 2024, highlighting that solar photovoltaics (PV) will emerge as the core driving force behind the rapid global expansion of renewable energy over the next decade. By 2030, it is projected that 80% of the world’s new installed capacity of 5,500 GW of clean energy will come from solar power. Therefore, the proportion of the distributed photovoltaic (DPV) system connected to the distribution substation has been increasing annually. However, at the same time, high-penetration DPV significantly limits the DPV carrying capacity in the distribution substation, leading to a series of problems at the point of common coupling (PCC) within the distribution substation, including reverse power flow, voltage violation, harmonic pollution, and so on [1–3]. These problems not only restrict the DPV carrying capacity of the distribution substation but also pose threats to the safe and stable operation of the entire distribution substation [4, 5].
Therefore, addressing the problems arising from high-penetration DPV has increasingly become the research focus for many scholars, aiming to improve the access capacity of DPV and, consequently, enhance the DPV carrying capacity within the distribution substation. It has been proposed the use of active power filter (APF), dynamic voltage restorer (DVR), static synchronous series compensator (SSSC) and other equipment to solve power quality problems in [6–9]. And [10] proposed a double hierarchical suppression strategy. This strategy makes full use of the reactive power regulation ability of DPV virtual synchronous machine to control the voltage violation and fluctuation caused by high-penetration DPV grid connection, and realizes the increase of DPV access.
The hybrid distribution transformer (HDT) with DPV power generation is shown to promote the utilization of local sustainable energy and address associated power quality problems [11]. And [12] proposed an improved three-phase HDT with LCL filter, and designed a grid current and load voltage control system with better high-frequency harmonic suppression performance. In [13], a direct current (DC) voltage fault-tolerant control method was proposed to ensure that the DC voltage maintained the reference value even if the voltage source inverter failed. Additionally, [14] proposed a composite control scheme accounting for external interference, where two composite controllers regulated grid current and load voltage respectively, enhancing system robustness.
However, as the problem of reverse power flow has not been adequately resolved, HDT can only marginally enhance the DPV carrying capacity. Considering that the energy storage system (ESS) can flexibly adjust the balance of power supply and demand in the distribution substation, the problem of reverse power flow at PCC can be solved by additional configuration of ESS [15]. And [16] points out that integrating ESS in DPV distribution networks not only control the voltage violation problem, but also improve the economy of power grid operation. In addition, ESS can be used to improve the acceptance of distributed generation in distribution networks in [17–19]. In this article, HDT and ESS are integrated into a combined energy router (CER) to enhance the DPV carrying capacity by controlling power quality and reverse power flow.
The carrying capacity of DPV refers to the ability of the distribution substation to accommodate and integrate DPV installed capacity. The assessment of this capacity is of great significance for ensuring the safe and stable operation of the power grid, optimizing resource allocation, and promoting sustainable development [20]. The DPV carrying capacity needs to be evaluated by establishing a model, which usually contains objective functions and constraints. The objective function is set according to the problems verified by the evaluation, such as the maximum access volume of distributed generation or the minimum deviation of various losses. Constraints can be formulated according to the limiting factors of DPV capacity as outlined in industry standards.
There are also differences in the methods used by different literatures to verify the evaluation model. For instance, [21] employs an improved analytic hierarchy process and entropy weight method to calculate comprehensive weights, and conducts a fuzzy comprehensive evaluation of the DPV carrying capacity from three dimensions: power quality, safety, and flexibility. And [22] establishes a DPV calculation model based on deterministic constraints, incorporating voltage deviation constraints and transformer capacity limitations. It also describes the basic principles and model construction of the Monte Carlo algorithm.
The article proposes the CER structure for the first time based on the traditional power frequency transformer. This solution aims to comprehensively control reverse power flow, voltage violation, harmonic pollution and other power quality issues. Furthermore, it can enhance the DPV carrying capacity within the distribution substation.
The rest of this article is organized as follows. In Section 2, the distribution substation architecture with the CER and the power flow direction is introduced. In Section 3, the topology and control strategy of the CER are presented. In Section 4, a DPV carrying capacity evaluation model with objective function and constraints is established. The DPV carrying capacity under different methods is evaluated by linear function, and the advantages of CER in improving the effect are verified combined with economy. And the simulation results verify the feasibility and effectiveness of the proposed CER method in Section 5. Finally, Section 6 concludes this article.
2 Substation Architecture Based on CER
2.1 Substation Architecture
To address the problem of limited carrying capacity, voltage violation, harmonic pollution caused by high-penetration DPV, a method based on CER is proposed to enhance the DPV carrying capacity. The architecture of the distribution substation based on CER is illustrated in Figure 1.
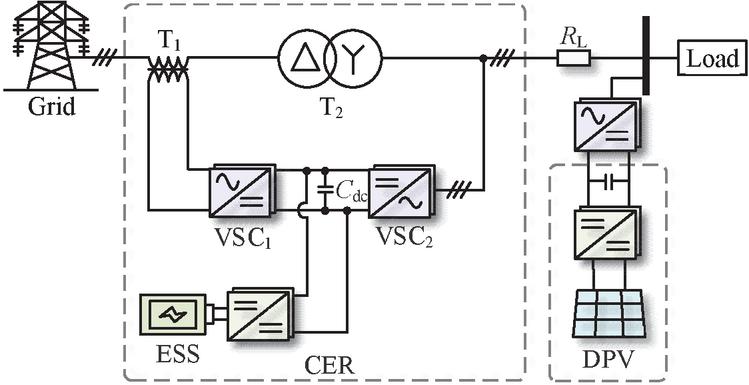
Figure 1 Substation architecture based on CER.
In Figure 1, the CER apparatus comprises a series transformer T, a power frequency transformer T, a front-end voltage source converter (VSC), and a rear-end voltage source converter (VSC). VSC is connected to the grid-side busbar, while VSC is connected to the load node. These two converters are interconnected in a back-to-back configuration through a controlled DC capacitor , from which a DC port is also extracted. The ESS is interfaced with the DC port, and represents the line resistance.
VSC is used to solve voltage violation caused by high-penetration DPV. Meanwhile, VSC realizes the harmonic control of the PCC node and maintains the voltage stability of the DC port. The ESS can discharge excess DPV power to reduce the reverse power flow. It can also maximize the storage of DPV power during the DPV peak periods, increase the capacity of the DPV, and enhance the carrying capacity.
2.2 Power Flow Analysis of the CER Method
Reverse power flow primarily refers to the change in the direction of active power flow from a unidirectional flow to a bidirectional flow. This includes the flow from the grid side to the PCC node, as well as the flow from the DPV system back to the PCC node.
This article proposes that the CER can control the DPV power reverse to the PCC node. Figure 2 shows the power flow direction when power flow is reversed under the CER. It is assumed that the DPV power is greater than the required load. To simplify the analysis, the active power loss of the converter is ignored, and the power flow direction of each part is indicated by the arrows.
In Figure 2, the active power generated by the DPV can not only meet the load demand, but also be charged to the ESS to reduce the waste of DPV. At the same time, the remaining DPV power flows into the grid. The relationship between the active power of each part is as follows:
| (1) |
where, represents the DPV power, represents the power required by the load, represents the power flowing into the ESS, and represents the power reversing to the grid side.
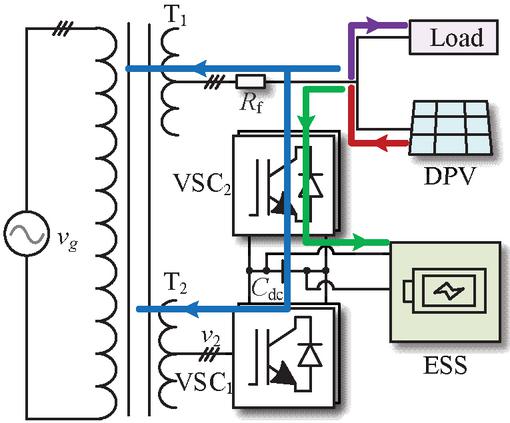
Figure 2 Power flow diagram of the CER when the DPV power is greater than the required load.
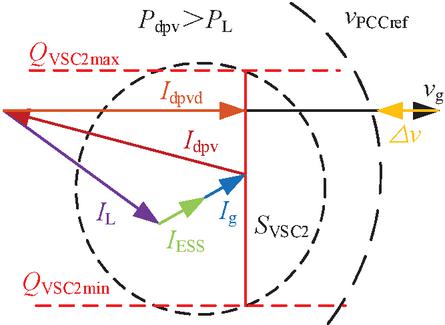
Figure 3 Power phasor diagram of the CER when the DPV power is greater than the required load.
In Figure 2, the red line represents the power generated by the DPV. The purple line represents the power flowing to the load. Some power from VSC flows from the green line to the ESS. A small amount of DPV power flows into the grid, as shown by the blue line.
As shown in Figure 3, due to the reverse DPV power, the PCC node voltage exceeds the limit (). After using the CER, VSC maintains the PCC node voltage to the rated voltage through the compensation voltage . At the same time, VSC can compensate harmonic components at the low voltage side. And the regulation range of the reactive power can be determined according to the instantaneous reactive power theory. In Figure 3, and represents the upper and lower limits of VSC’s reactive power, respectively. represents the current generated by the DPV power, represents the d-axis component of the PV current, represents the load current, stands for the ESS current, and signifies the current on the grid side.
3 Topology and Control Strategy of the CER
3.1 Topology and Control Strategy of VSC
Figure 4 illustrates the topology and control strategy of VSC. And VSC can be regarded as a controllable voltage source, employing a three-phase four-wire configuration. In Figure 4, the three-phase voltages of phases A, B, and C, after the delay processing, become . And then, the amplitude of each phase voltage can be derived. The phase angle can be obtained through a phase-locked loop (PLL). The power frequency transformer in the CER adopts a /Y connection, which results in a 30 phase difference between the grid side voltage and the PCC voltage. Therefore, angle compensation control is required for the voltage.
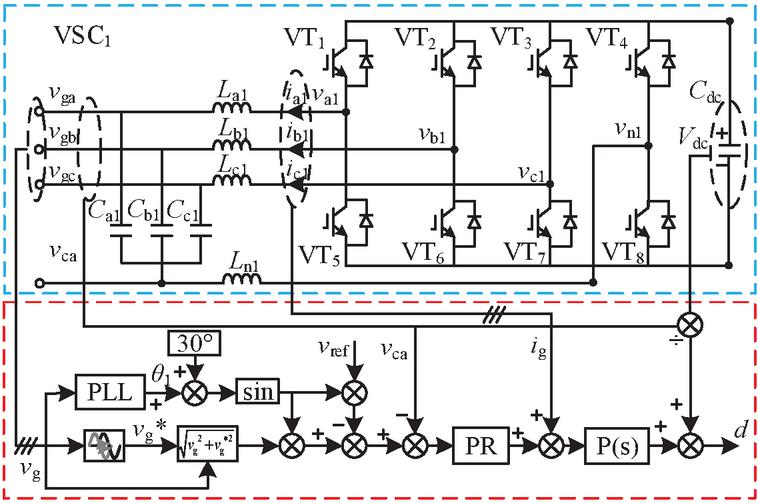
Figure 4 The topology and control strategy of VSC.
When there are significant fluctuations at the PCC voltage, the difference between the fluctuating voltage amplitude and the rated voltage amplitude is used as the reference value for the output voltage at the VSC. The voltage outer loop uses a proportional-resonant (PR) controller to regulate the voltage error, while the current inner loop employs a proportional (P) controller to control the current error. Consequently, this ensures stable voltage operation and high-power quality at the PCC node in the distribution substation.
3.2 Topology and Control Strategy of VSC
Figure 5 illustrates the topology and control strategy of VSC. And VSC can be regarded as a controllable current source, employing a three-phase four-wire system, similar to VSC.
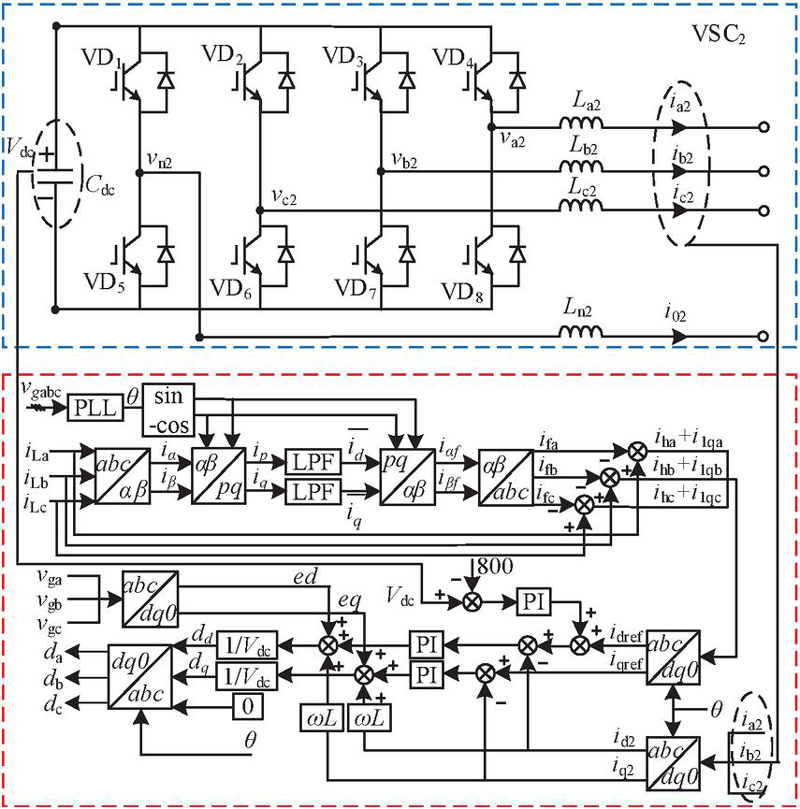
Figure 5 The topology and control strategy of VSC.
The load currents , and , after are transformed using the Clark transform to obtain the currents and in the coordinate system. Through instantaneous power transformation, the instantaneous active current and the instantaneous reactive current are obtained. and are then filtered by a first-order low-pass filter (LPF) to obtain the fundamental current components in the coordinate system. After inverse Clark transformation, the three-phase fundamental current components , and are obtained. By subtracting the fundamental current components , and from the load currents , and , respectively, the harmonic components , , and in the currents are obtained.
The sum of the three-phase harmonic currents , , and the instantaneous reactive current is subjected to Park transformation to generate harmonic current reference values and in the dq coordinate system. The output currents , , of the VSC port undergo the same transformation to obtain the actual compensation currents and . It is an important part of achieve DC voltage control and accurate compensation for harmonic currents.
Among them, stabilizing the DC voltage is related to the active current. By subtracting the reference voltage of 800 V from the measured DC voltage , the error is obtained. This error is then processed through a proportional-integral (PI) controller. And the obtained value is added to the d-axis current reference to achieve harmonic compensation and DC voltage stabilization. During the dq axis transformation, there are coupling components between the harmonic current and . And decoupling control is implemented within the current inner loop to achieve precise harmonic compensation. The reference values and can be output from the current loop. Then, they can be subjected to Park’s inverse transformation to obtain the required duty cycles , , and .
3.3 Topology and Control Strategy of Bidirectional Buck/Boost Converter for ESS
The ESS is integrated into the low voltage DC port of the CER for charging and discharging through a bidirectional Buck/Boost converter, utilizing a power closed-loop control structure. The power difference among the grid, load, and DPV sources represents the deficient power that needs to be supplied by the ESS. This deficient power is divided by the ESS voltage to obtain a standard current , which is then subtracted from the measured current . Through PI control, the duty cycle is determined, leading to the . The controls the operational modes of the bidirectional Buck/Boost converter of the ESS. By delivering power to the ESS, the control of power flow reversal on the line is achieved. The control strategy diagram is shown in Figure 6.
When the DPV power is insufficient to meet the load demand, the ESS discharges power. During this process, the bidirectional Buck/Boost converter operates in Boost mode, enabling the flow of power from the ESS to the DC side. Conversely, when the DPV power is sufficient and excessive, the ESS begins to charge power. At this point, the bidirectional Buck/Boost converter switches to Buck mode, enabling the power to flow from the DC side to the ESS.
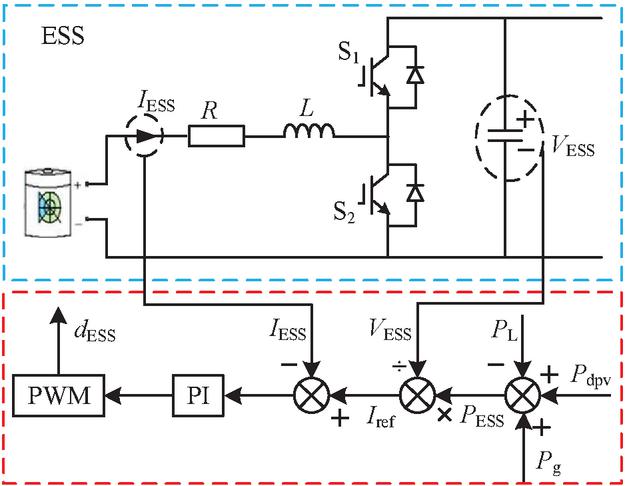
Figure 6 The topology and control strategy of bidirectional Buck/Boost converter for ESS.
4 Evaluation of the DPV Carrying Capacity for Substation Based on CER
4.1 Evaluation Model
The objective function of the evaluation model of the DPV carrying capacity established in this article is the maximum access capacity of DPV and the minimum costs of investment, operation and maintenance for CER. And the constraints include: voltage fluctuation, harmonic current, reverse load rate, etc.
4.1.1 Objective function
(1) DPV access capacity
| (2) |
where represents the active power of the DPV system that can be connected at the PCC.
(2) CER investment, operation, and maintenance costs
The comprehensive investment cost of the DPV, VSC, VSC and ESS is as follows:
| (3) |
where is the investment cost. , , , and represent the investment cost per unit of DPV capacity, VSC capacity, VSC capacity, and ESS respectively. , and represent the capacities of DPV, VSC and VSC, respectively. represents the capacity of the ESS, where the power of the ESS is represented as , and the ESS with a charge-discharge rate of 0.5C is selected.
The comprehensive operation and maintenance costs of the DPV, VSC, VSC and ESS is as follows:
| (4) |
where is the operation and maintenance costs. t represents the service life of each device and r is the discount rate. , , , and represent the investment cost per unit of DPV capacity, VSC capacity, VSC capacity, and ESS respectively. The service life, discount rate, investment cost, operation and maintenance costs can be found in Table 1.
Table 1 The service life, discount rate, investment cost, operation and maintenance costs of CER in the distribution substation
| Parameter | Symbol | Unit Price |
| Investment, operation and maintenance costs of VSC capacity | 1200 RMB/kWh | |
| Investment, operation and maintenance costs of VSC capacity | , | 1000 RMB/kWh |
| Investment, operation and maintenance costs of ESS capacity | 800 RMB/kWh | |
| operation and maintenance costs of VSC capacity | 1800 RMB/kWh | |
| operation and maintenance costs of VSC capacity | , | 1000 RMB/kWh |
| operation and maintenance costs of ESS capacity | 1000 RMB/kWh | |
| service life | t | 20 years |
| discount rate | , , , | 1000 RMB/year |
| where renminbi (RMB) is the international standard for China’s currency. | ||
The minimum objective function for investment operation and maintenance cost is obtained by adding the above two cost sub objective functions:
| (5) |
Utilizing the linear weighted combination method, the total optimization objective function can be expressed as:
| (6) |
where F represents the ultimate optimization objective function. Since the order of magnitude of the two sub objective functions may not be the same, set the weight coefficient for each sub objective function. Specifically, and are the weight coefficients of each sub objective function respectively.
4.1.2 Constraints
(1) Voltage fluctuation rate constraint The voltage fluctuation caused by the DPV is defined as the voltage fluctuation rate, which is represented by D. The national standard stipulates that the fluctuation rate of three-phase voltage below 0.38 kV voltage shall not exceed 7%.
| (7) | |
| (8) |
where represents the line resistance between the load and the PCC node. represents the load power. represents the rated voltage for the 0.38 kV voltage. represents the capacity of VSC to regulate voltage within limits, and I represents the current flowing through the line.
(2) Harmonic current constraint
| (9) |
where represents the power flow capacity of the line in the reverse direction. represents the capacity of VSC for controlling harmonic pollution.
Table 2 The harmonic current limit for the current injected into the PCC node in a 0.38 kV voltage distribution substation
| Order of harmonics | 2 | 3 | 4 | 5 | 6 | 7 | 8 | 9 |
| Allowable harmonic current value /A | 78 | 62 | 39 | 62 | 26 | 44 | 19 | 21 |
| Order of harmonics | 10 | 11 | 12 | 13 | 14 | 15 | 16 | 17 |
| Allowable harmonic current value /A | 16 | 28 | 13 | 24 | 11 | 12 | 9.7 | 18 |
Table 3 The harmonic voltage content ratio for each harmonic order in a 0.38 kV voltage distribution substation
| Content of Each Harmonic Voltage | ||
| Total Harmonic Distortion Rate of Power Grid | Odd-order | Even-order |
| 5.0 | 4.0 | 2.0 |
And represents the harmonic current limit for the current injected into the power grid, as specified in the line standard (refers to Table 2). represents the harmonic voltage content ratio for each harmonic order of the DPV output power, as specified in line standard (refers to Table 3).
(3) Reverse load rate constraint The reverse load rate is defined as the ratio of the power flowing from the 0.38 kV side to the 10 kV side at the PCC node to the transformer’s rated capacity, represented by . The line standard stipulates that the reverse load rate shall not exceed 80%.
| (10) |
where represents the equivalent load at the PCC node, and represents the transformer capacity.
(4) Capacity constraint of VSC
| (11) |
where, this article sets the capacity margin of VSC, VSC and ESS as 1.1 times.
(5) Capacity constraint of VSC
| (12) |
(6) Capacity constraint of ESS
| (13) |
The DPV power exceeding the load demand needs to be directed into the ESS via VSC for charging. Therefore, the capacity of VSC is intimately correlated to the ESS capacity.
Due to space limitations, the above content only describes the evaluation model for the integration of the CER into the distribution substation, referred to as Method 1. The evaluation models for the other two methods, namely Method 2 (integrating traditional power frequency transformers into the distribution substation) and Method 3 (integrating HDT into the distribution station), can be found in Table 4.
Table 4 The objective functions and constraints of the Method 2 and Method 3
| Method 2 | Method 3 | |
| Objective 1: DPV access capacity | ||
| Objective 2: investment cost | ||
| Objective 2: operation, and maintenance costs | ||
| Voltage fluctuation rate constraint | ||
| Harmonic current constraint | ||
| Reverse load rate constraint | ||
| Capacity constraint of VSC | / | |
| Capacity constraint of VSC | / |
4.2 Analysis on the Enhancement of DPV Carrying Capacity
To further quantitatively evaluate the impact of Method 1 on carrying capacity, this section analyzes a 10 kV/0.38 kV distribution substation. Assuming a load power of kW, the maximum capacity of the DPV in the distribution substation is evaluated under three different methods.
The comparison of the carrying capacity enhancement effects between the proposed CER method, the traditional power frequency transformer, and the HDT method is shown in Figure 7. When Method 2 is used, the maximum capacity that can be connected to the DPV in the distribution substation is approximately 200 kW. When Method 3 is used, voltage violation and harmonic pollution can be properly managed. At this point, the DPV that can be connected in the distribution substation increases by about 50 kW, showing a slight enhancement.
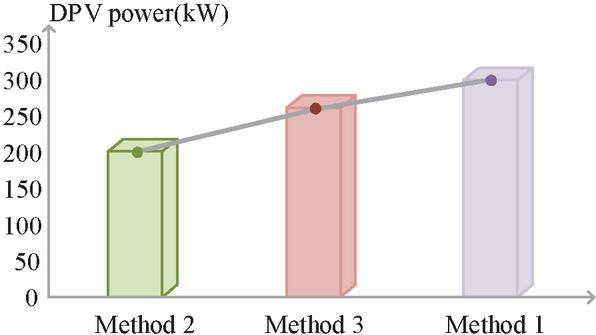
Figure 7 Comparison diagram of the maximum carrying capacity of DPV in three methods. Method 1: CER. Method 2: traditional power frequency transformer. Method 3: HDT.
When CER is integrated into the distribution substation, not only can the aforementioned voltage violation and harmonic pollution be properly managed, but the issue of reverse power flow is also mitigated. As a result, the DPV capacity in the distribution substation reaches nearly 300 kW, surpassing both Method 2 and Method 3. Clearly, the CER method demonstrates significant advantages in both comprehensive power quality management and carrying capacity enhancement.
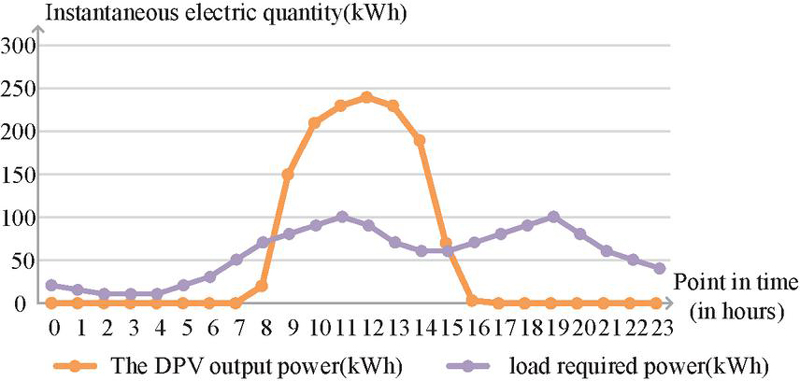
Figure 8 The DPV output power curve and load required power curve in a typical day.
Table 5 The electricity prices at different time periods
| Time Slot | Electricity Prices |
| Off-peak period 23:0007:00 | 0.34 RMB/kWh |
| Mid-peak period 11:0017:00, 21:0023:00 | 0.52 RMB/kWh |
| Peak period 07:0011:00, 17:0021:00 | 0.62 RMB/kWh |
As illustrated in Figure 8, taking the DPV output power and load required power as an example. A comparison of the daily revenue before and after the implementation of the CER method in a 300 kW DPV distribution substation is presented. This comparison is based on the electricity prices at different time periods provided in Table 5.
When the CER is connected to the distribution substation, the power grid supplies energy to meet the load during the off-peak period from 23:00 to 07:00. There is no DPV generation, and the electricity cost is 52.7 RMB. During this same period, the ESS accumulates low-cost electric energy. During the peak period from 07:00 to 09:00, ESS is efficiently used to meet part of the load, resulting in an additional electricity cost of only 39.6 RMB. From 09:00 to 16:00, when the DPV power generation meets the load requirement, it can be used to charge the ESS.
The CER also controls the power quality at the node, allowing some of the DPV power to be safely fed back to the grid within the constraints. During this period, a profit of 377.8 RMB is generated. The stored electricity can be used during the peak period from 17:00 to 21:00. The insufficient portion is supplied by the grid, resulting in an electricity cost of 224.6 RMB. During the remaining period, the electricity cost is 34.84 RMB. Based on the above calculation, a profit of 26.06 RMB can be earned from the electricity costs for the day.
If the system is not connected to DPV and CER, the daily electricity cost on a sunny day is 740.7 RMB. Therefore, connecting DPV and CER is equivalent to saving 766.76 RMB in one day. The load on cloudy and rainy days is calculated at 1.1 times that of sunny days, and the DPV power generation is significantly reduced. Using the same method for analysis, cloudy and rainy days can save 254.52 RMB and 99.44 RMB in electricity costs, respectively.
If DPV generation is not considered during rainy days, the ESS can still generate a profit of 30.4 RMB per day. Calculating over a year with 240 sunny days and 125 cloudy days, a total profit of 34,832 RMB can be achieved, which is quite substantial.
Calculated based on 150 sunny days, 150 cloudy days, and 65 rainy days within a year, a total savings of 159,700 RMB can be obtained, with high benefits. Although the DPV and CER requires the investment capital of 488,800 RMB, its long-term use maximizes the utilization of DPV generation. Combined with electricity prices and efficient power usage, the investment proves to be highly beneficial.
5 Example Demonstration and Simulation Verification
To verify the feasibility and effectiveness of the proposed CER in enhancing the DVP carrying capacity, a 10 kV/0.38 kV the distribution substation is established in the MATLAB/Simulink simulation platform. The simulation parameters are detailed in Table 6.
Table 6 Simulation system parameters
| Parameter | Symbol | Value |
| Line resistance | 0.03 | |
| Primary voltage of transformer | 8164V | |
| Secondary voltage of transformer | 311V | |
| Power factor | cos | 0.97 |
| DC voltage reference value | 800V | |
| Initial state of charge (SOC) of ESS | SOC | 60% |
| Upper limit value of SOC | SOC | 80% |
| Lower limit value of SOC | SOC | 20% |
Table 7 Operational states of the distribution substation at different stages
| Stage | Symbol | /kW | Participation of CER |
| A | 0.2s–0.4s | 50 | |
| B | 0.4s–0.6s | 50 | |
| C | 0.6s–0.8s | 100 | |
| D | 0.8s–1.0s | 100 | |
| E | 1.0s–1.2s | 100 |
According to the different periods of and CER operational states, they are divided into five distinct stages, as shown in Table 7.
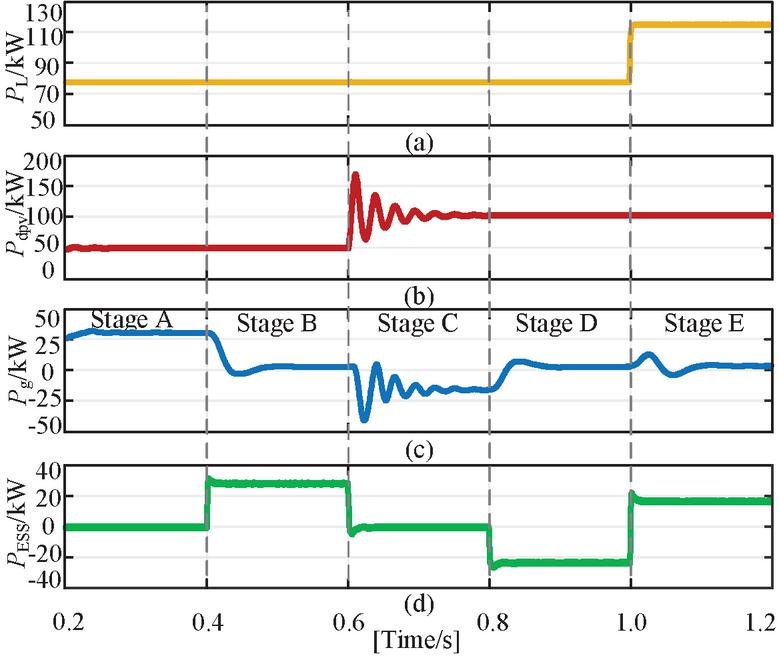
Figure 9 The simulation waveform under CER method during five stages. (a) . (b) . (c) . (d) .
5.1 Reverse Power Flow Control in the Distribution Substation
Figure 9 shows the simulation waveform under CER method during five stages. Subfigures (a), (b), (c), and (d) depict the load power (), DPV power (), grid power (), and ESS power (), respectively. Assuming that the power flowing out of the grid and the ESS is positive.
As illustrated in Figure 9(a), the connected to the distribution substation increases from 77.6 kW to 116.4 kW at 1.0s. Figure 9(b) presents the DPV power waveform, indicating that the increases from 50 kW to 100 kW at 0.6s.
During stage A, the 50 kW DPV power is insufficient to meet the load demand, and the CER is not participated in the operation. Consequently, the grid supplied the remaining power to the load, as shown in Figure 9(c).
In stage B, the CER participated in the operation. The ESS supplies power to the load instead of the grid. Figure 9(d) shows that the is positive at this time.
As illustrated in Figure 9(c), during stage C, the DPV power is more than required by the load. During this stage, the CER is not participated, and the excess flows into the grid.
In stage D, the CER is participated in operation, and the excess flows into the ESS for charging. Therefore, in Figure 9(c) returns to 0, while in Figure 9(d) is in a negative charging state.
During the stage E, with the CER participating, a small amount of power is reversed to the grid when the increases, but this don’t result in significant fluctuations. Through the proposed CER, the reverse power flow is reduced, and the smooth grid integration of the DPV system.
5.2 Voltage Violation Control in the Distribution Substation
Figure 10 presents the simulation waveform of the DC voltage between VSC and VSC. During the five stages of dynamic transition, experiences brief fluctuations. However, remains consistently maintained at approximately 800V, confirming that the DC voltage is well-controlled.
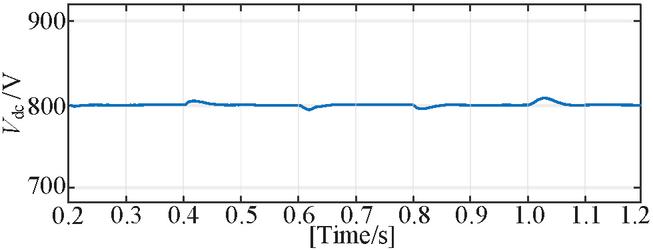
Figure 10 The simulation waveform diagram of DC voltage.
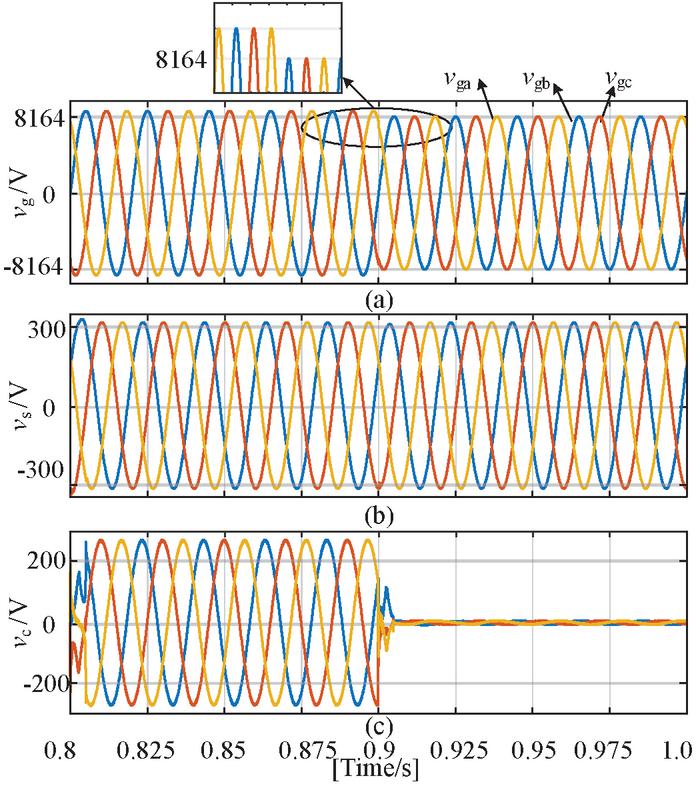
Figure 11 The simulation waveform diagram of voltage control. (a) The simulation waveform diagram of the three-phase voltages at the grid side. (b) The simulation waveform diagram of the secondary side voltage. (c) The simulation waveform diagram of the compensation voltage of VSC.
Figure 11(a) illustrates the three-phase voltages at the grid side, with a voltage violation set from 0.8s to 0.9s, where the grid voltage violation to 110% of the rated value. The CER is participated in the operation of the distribution substation. Figure 11(b) shows the voltage waveform on the secondary side after controlling the voltage violation problem. Due to the effective compensation of the CER, the secondary side voltage can remain stable and unaffected by voltage fluctuations on the grid side. Figure 11(c) displays the compensation voltage waveform of VSC. Therefore, it can be observed that after VSC participates in operation and provides voltage compensation, the voltage at the distribution substation remains stable within the normal range.
5.3 Harmonic Control in the Distribution Substation
As illustrated in Figure 12, when the distribution substation is stage C, a significant increase in DPV reverse power flow causes higher-order harmonic currents to increase. At this point, the total harmonic distortion (THD) of the grid current reaches 5.15%, exceeding the line standard constraint (refers to Table 2) and affecting the normal operation of the distribution substation.
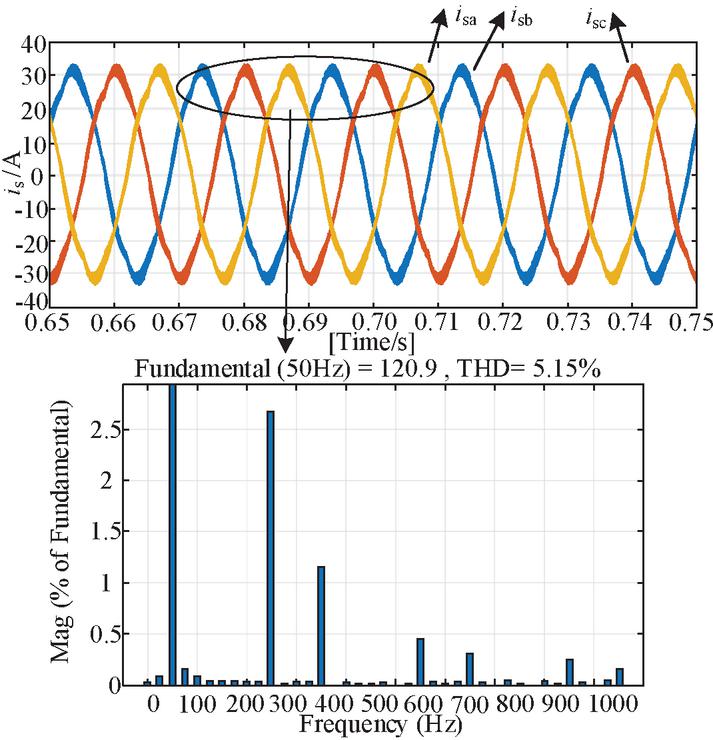
Figure 12 The diagram of harmonic pollution and FFT analysis.
Figure 13 displays the diagram of compensated current and FFT analysis, representing stage D. At this stage, both the reverse power flow and voltage violation have been adequately addressed. The harmonic content in the power grid current has been efficiently compensated, resulting in a standard sine wave with a THD of 3.22%, which is notably lower compared to traditional power frequency transformers.
To sum up, the simulation results show that the CER proposed in this article can effectively carry out harmonic control, achieve power quality control through voltage violation and harmonic pollution control. Additionally, it further verifies that the amount of DPV access can be effectively improved combined with power changes.
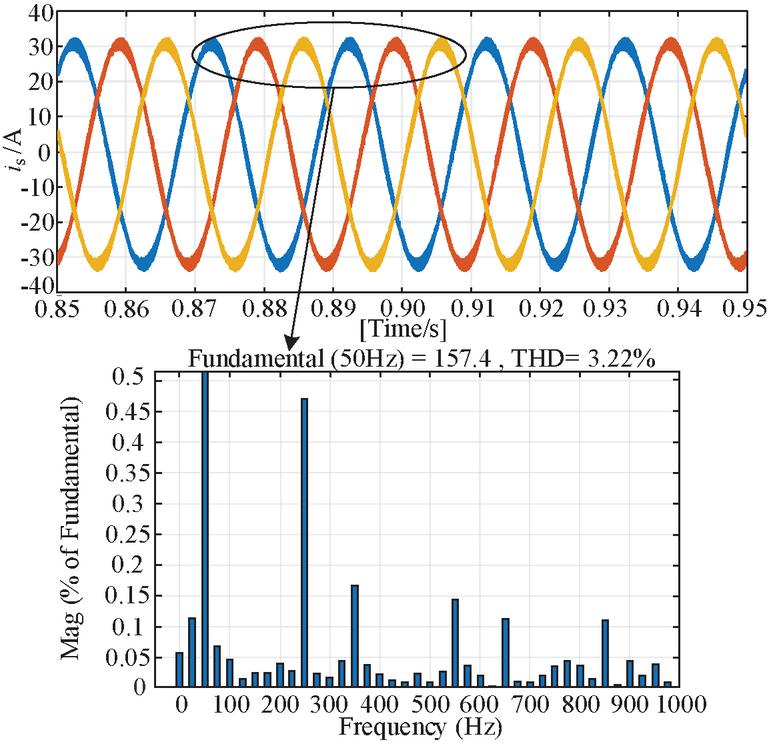
Figure 13 The diagram of compensated current and FFT analysis.
6 Conclusions
This article proposes a CER based on the traditional power frequency transformer in the distribution substation. It can comprehensively control the problems of power quality and reverse power flow, and achieve an enhancement of the DPV carrying capacity within the distribution substation. In the above sections, the distribution substation architecture with the CER and the power flow are illustrated. And the topology and control strategy of the CER are presented. In addition, a DPV carrying capacity evaluation model with objective function and constraints is established. The correctness of the proposed CER is verified through model evaluation and simulation results. And the proposed CER has the following advantages.
(1) The proposed CER can improve the power quality at the PCC node by compensating the node voltage and controlling voltage violation at the PCC node, ensuring they remain within the specified limits. It can also significantly reduce the harmonic content in the current, achieving harmonic current compensation.
(2) The proposed CER can reduce the reverse power flow of the PCC nodes in distribution substation and effectively enhance the DPV carrying capacity. This method enables ESS to store the reversed DPV power, thereby controlling the fluctuations in reverse power flow caused by DPV and load changes. Consequently, this not only ensures the maximization of the DPV utilization and enhances the carrying capacity of the DPV but also maintains the safe and stable operation of the distribution substation.
Funding
This research was supported by Zhejiang Rongda Electric Power Engineering Co., Ltd. under the Science and Technology Project “Research on Key Technologies and Equipment Development of combined energy router for intelligent distribution substation areas” (No. DY2024-11).
References
[1] O. Pinzón-Quintero, D. Gaviria-Ospina, A. Parrado-Duque, R. Rodríguez-Velásquez, and G. Osma-Pinto, “Assessment of power quality parameters and indicators at the point of common coupling in a low voltage power grid with photovoltaic generation emulated,” Electric Power Systems Research, vol. 203, pp. 107679, Feb. 2022.
[2] D. Wu, J. Su, Z. Chen, and H. Liu, “Effects of distributed generation on carbon emission reduction of distribution network,” Distributed Generation & Alternative Energy Journal, vol. 39, no. 1, pp. 57–82, Oct. 2023.
[3] S.H. Kulkarni, B.J. Jirage, and T.R. Anil, “Alternative energy options for India- a multi-criteria decision analysis to rank energy alternatives using analytic hierarchy process and fuzzy Logic with an emphasis to distributed generation,” Cogeneration & Distributed Generation Journal, vol. 32, no. 2, pp. 29–55, Mar. 2017.
[4] M. Munish, “Optimization of distributed generation based hybrid renewable energy system for a DC micro-Grid using particle swarm optimization,” Distributed Generation & Alternative Energy Journal, vol. 33, no. 4, pp. 7–25, Oct. 2018.
[5] A.A. Adebiyi, and I.E. Davidson, “Analysis of solar irradiation impact on grid-tied photovoltaic system’s power quality characteristics,” 2023 31st Southern African Universities Power Engineering Conference (SAUPEC), Johannesburg, South Africa, Jan. 2023, pp. 1–5.
[6] M. Golla, K. Chandrasekaran, and S.P. Simon, “PV integrated universal active power filter for power quality enhancement and effective power management,” Energy for Sustainable Development. Vol. 61, pp. 104–117, Apr. 2021.
[7] H. El Karch, Y. Abouelmahjoub, Y. Mchaouar, S. El Beid, F. Giri, and M. Elouafi, “Advanced nonlinear control of shunt active power filter connected to PV system via DC/DC converter,” IFAC-Papers on Line, vol. 58, no. 13, pp. 104–109, Jan. 2024.
[8] J.J. Inamdar, and K.I. Annapoorani, “Terminal sliding mode control for dynamic voltage restorer.” Distributed Generation & Alternative Energy Journal, vol. 37, no. 3, pp. 771–792, Feb. 2022.
[9] E.H. Sadiq, L.A. Mohammed, and H.M. Taha, “Enhancing power transmission efficiency using static synchronous series compensators: a comprehensive Review,” Journal of Intelligent Systems and Control, vol. 3, no. 2, pp. 71–83, Jun. 2024.
[10] Y. Li, Y. Sun, K. Li, J. Zhuang, Y. Liang, and Y. Pang, “Analysis and suppression of voltage violation and fluctuation with distributed photovoltaic integration,” Symmetry, vol. 13, no. 10, pp. 1894, Oct. 2021.
[11] L. Zhang, Y. Liu, D. Liang, P. Kou, Y. Wang, Y. Gao, D. Li, and H. Liu, “Local and remote cooperative control of hybrid distribution transformers integrating photovoltaics in active distribution networks,” IEEE Transactions on Sustainable Energy, vol. 13, no. 4, pp. 2012–2026, Oct. 2022.
[12] Y. Liu, L. Zhang, D. Liang, H. Jin, S. Li, and S. Jia, “Quasi-Proportional-Resonant control for the hybrid distribution transformer with LCL-Type converters,” IEEE Transactions on Industry Applications, vol. 58, no. 5, pp. 6368–6385, Sep. 2022.
[13] L. Zhang, D. Liang, Q. Wen, H. Liu, Y. Liu, Y. Gao, Z. Wu, C. Wang, and L. Tang, “Multiple protection strategies for hybrid distribution transformer based on DC-link voltage fault-tolerant control,” In 2021 IEEE Energy Conversion Congress and Exposition (ECCE), Vancouver, Canada, Oct. 2021, pp. 1274–1279.
[14] Y. Liu, D. Liang, P. Kou, M. Zhang, S. Cai, K. Zhou, Y. Liang, Q. Chen, and C. Yang, “Compound control system of hybrid distribution transformer,” IEEE Transactions on Industry Applications, vol. 56, no. 6, pp. 6360–6373, Nov. 2020.
[15] Y. Zhang, M. Wu, and K. Li, “Calculation of the carrying capacity of distributed power generation in distribution network under carbon peaking and carbon neutrality goals,” In ECITech 2022; The 2022 International Conference on Electrical, Control and Information Technology, Kunming, China, Mar. 2022, pp. 1–6.
[16] M.M. Rana, M. Uddin, M.R. Sarkar, G.M. Shafiullah, H. Mo, and M. Atef, “A review on hybrid photovoltaic–battery energy storage system: current status, challenges, and future directions,” Journal of Energy Storage, vol. 51, pp. 104597, July. 2022.
[17] S.K. Yadav, K.B. Yadav, and A. Priyadarshi, “Performance analysis of three-phase solar PV, BESS, and wind integrated UP-QC for power quality improvement,” Computers and Electrical Engineering, vol. 116, pp. 109230, May. 2024.
[18] Y. Li, B. Wang, Y. Chen, Y. Du, J. Du, Q. Liao, Y. Wu, Z. Zhou, Q. Lu, L. Zhu, and Y. Lin, “Improving distributed network resilience with energy storage: an optimal planning strategy based on subjective and objective weight method,” Distributed Generation & Alternative Energy Journal, vol. 39, no. 5, pp. 1015–1044, Dec. 2024.
[19] F. Zhou, Z. Tang, X. Zhang, L. Chou, and D. Tan, “An energy storage system for regulating the maximum demand of traction substations,” Energies, vol. 18, no. 1, pp. 131, Jan. 2025.
[20] Y. Xu, J. He, Y. Liu, Z. Li, W. Cai, and X. Peng, “Evaluation method for hosting capacity of rooftop photovoltaic considering photovoltaic potential in distribution system,” Energies, vol. 16, no. 7, pp. 7677, Nov. 2023.
[21] X. Hu, L. Lin, J. Zhou, J. Wang, W. Su, X. Cao, “A fuzzy comprehensive evaluation method for assessing the carrying capacity of distributed photovoltaic,” In 2024 5th International Conference on Artificial Intelligence and Electromechanical Automation (AIEA), Shenzhen, China, Jun. 2024, pp. 494–499.
[22] C. Zhu, D. Shao, L. Wang, Y. Wang, “Distributed photovoltaic hosting capacity calculation of distribution network based on deterministic constraints,” In 2023 5th International Conference on Electrical Engineering and Control Technologies (CEECT), Chengdu, China, Dec. 2023, pp. 26–30.
Biographies
Ziang Zhang, a senior engineer, works at Zhejiang Rongda Electric Power Engineering Co., Ltd. His research direction focuses on the application of distributed power sources in distribution substations.
Ning Han, received the bachelor’s degree in Applied Chemistry from Northeast Electric Power University in 2022. She is currently pursuing a master’s degree in Electrical Engineering at Northeast Electric Power University. Her research focuses on the application of photovoltaic and energy storage technologies in power systems.
Jianfei Chi, a senior engineer, is employed at State Grid Zhejiang Electric Power Co., Ltd., Hangzhou Fuyang District Power Supply Company. His research interest lies in the flexible application of power electronic devices in distribution substations.
Bin Luo, a senior engineer, works at Zhejiang Rongda Electric Power Engineering Co., Ltd. His research focuses on the integration of distributed power sources with energy storage technologies.
Bo Zhou, an intermediate engineer, is employed at State Grid Zhejiang Electric Power Co., Ltd., Hangzhou Fuyang District Power Supply Company. His research direction is microgrids and virtual power plants.
Cong Yu, an intermediate engineer, works at Zhejiang Rongda Electric Power Engineering Co., Ltd. His research focuses on the impact of distributed power sources on distribution networks and corresponding countermeasures.
Chuanjiang Liu, an intermediate engineer, works at Zhejiang Rongda Electric Power Engineering Co., Ltd. His research direction is the construction and optimization of distributed power generation systems.
Jingyue Wang, received the bachelor’s degree in Electrical Engineering from Northeast Electric Power University in 2018 and the master’s degree in the same field in 2022. She is currently pursuing a doctoral degree in Electrical Engineering at Northeast Electric Power University. Her research focuses on flexible power conversion technology using power electronics and its application in medium-voltage photovoltaic grid-connected systems.
Distributed Generation & Alternative Energy Journal, Vol. 40_2, 279–306.
doi: 10.13052/dgaej2156-3306.4024
© 2025 River Publishers