Distribution Network Scheduling Model Taking Into Account Power Generation Prediction of New Energy and Flexible Loads
Lianrong Pan*, Xiao Yang, Yuan Fu, Xin Wei and Shangbin Yuan
Electric Power Dispatching and Control Center Guangxi Power Grid Co., Ltd, Nanning, 530000, China
E-mail: plr2024@163.com
*Corresponding Author
Received 27 February 2025; Accepted 11 April 2025
Abstract
The distribution network’s stable operation is vital for consumers. The short-term high load of wind power grid connection and irrigation well groups pose an overload risk for the distribution network (DN). Therefore, a DN scheduling model based on improved particle swarm optimization (PSO) algorithm is proposed in this paper. This model predicts wind power generation and calculates the load of the well groups using a Monte Carlo algorithm. An improved PSO algorithm, based on Pareto optimality, is used to search for multi-objective optimal solutions in DN scheduling. This model controls the operation status of the wells achieving an intelligent DN scheduling. When the number of wells were 300 and 500, the total load of the DN model after power scheduling was reduced by 23.5% and 28.5%, respectively, when compared to unregulated scheduling. This intelligent DN scheduling model is crucial for improving the power system’s scheduling efficiency and reliability.
Keywords: Distributed energy, particle swarm optimization algorithm, mechanical well, flexible load, distribution network, wind power.
1 Introduction
Distributed wind power, which has characteristics of randomness and intermittency, is widely integrated into the modern power grid. Moreover, with the rapid addition of well-based irrigation loads in the past five years, the power grid has grown rapidly with a growth rate of nearly 10%. High power demands cause heavy fluctuations to occur in the distribution network (DN) load, posing great challenges to DN scheduling [1]. The DN scheduling method based on microgrids can efficiently balance loads in local areas and improve the utilization of distributed energy [2, 3]. However, this method usually does not take into account the short-term high loads caused by well irrigation. This method has a high dependence on the external power grid and is easily affected by unstable distributed power sources.
Particle swarm optimization (PSO) algorithm in machine learning simulates the method of bird swarms sharing information for foraging to find an optimal solution. PSO algorithm can be used for DN scheduling to find an optimal solution [4]. Furthermore, the Pareto algorithm can handle multiple conflicting objectives and provide decision-makers with balanced solutions, making it very suitable for multi-objective scheduling in DN [5]. These two algorithms are widely used in multiple fields. Many scholars have studied DN scheduling, PSO, and Pareto optimal algorithms. When using Hadoop architecture for big data analysis, using a large number of different distributed computing systems cannot maximize computing power. Therefore, Sonia and Rajendra [6] proposed a scheduling algorithm based on Binary Hypergraphed Particle Swarm Optimization (BHDPSO). Employing this BHDPSO scheduler, the data locality in big data analysis was improved by 39.81%, and the execution time was reduced by 18.3%. The results indicate that the scheduling algorithm accelerates data processing speed and improves data accessibility, thereby enhancing the efficiency and performance of Hadoop big data analysis. Therefore, PSO algorithm has a great potential for application in optimal resource scheduling. The performance of wireless sensors deteriorates under obstacles. Therefore, Rahul and Bharat [7] proposed an improved PSO algorithm to achieve optimal coverage with the minimum quantity of nodes. After simulation tests, compared with the standard PSO algorithm, the coverage ability of the research algorithm was improved by 16% under the obstacles. Hoseinpoor and Ghaznavi [8] designed the Pareto algorithm for solving three objective functions to deal with the difficulty of adding objective constraints to solve for the optimal solution in multi-objective programming problems. This algorithm’s effectiveness was verified through tests, which could be used for optimizing three or more standard functions. Therefore, Pareto algorithm had advantages in computational aspects of multi-objective problems. Regarding the issue of balancing energy consumption and time cost when using manufacturing equipment, Qiao et al. [9] proposed an optimization model based on Pareto algorithm and ant colony algorithms. The effectiveness of the improved Pareto algorithm was verified through simulation tests. The electromagnetic transient simulation tool had low computational efficiency in the dynamic regulation of large-scale distributed energy. Regarding this, Wenbo et al. [10] proposed a distributed energy dynamic response framework based on the Hierarchical Engine for Large-scale Infrastructure Co-Simulation (HELICS) platform and transmission and distribution (T&D) simulator. The model accuracy was evaluated and the framework’s effectiveness was validated in simulation test of large-scale transmission and distribution systems. The renewable new energy’s complex energy conversion and volatility cause difficulties in energy system management. Regarding this, Chen et al. [11] proposed a flexible scheduling method with multiple practical scales. The operating cost of the energy system was reduced by 9.07%. Therefore, the method of flexible scheduling effectively improved the flexibility and economy of the system.
The above research indicates that many scholars have conducted relevant studies on PSO Pareto algorithms and DN scheduling. However, there is very little research on DN scheduling that combines the three for considering integration of new energy and flexible loads. Therefore, this study combines PSO and Pareto algorithms to find multi-objective optimal solutions in DN scheduling. By using a Pareto-based optimal solution to control the flexible load of the well groups, a power generation prediction and DN scheduling model is constructed. The research innovation lies in the improved PSO algorithm having adaptive inertia weights and time factors. This allows the algorithm to accelerate search speed in the early stages and conduct more refined searches in the later stages, greatly improving computational efficiency.
The paper is organized in five parts. First, the introduction presents the previous research achievements in DN scheduling and briefly describes the proposed load scheduling model. Second, the power generation prediction method and the DN scheduling model and mechanism based on improved PSO are introduced. Then, in Section 3, the proposed research model is tested. Section 4 discusses the simulation test results. Finally, in Section 5, a conclusion of the research results is provided.
2 Methods and Materials
Due to the disorderly electricity consumption of the well groups and the unstable output of renewable energy, the traditional microgrid DN scheduling method is not effective under the influence of distributed power sources [12, 13]. To solve this multi-objective optimization problem of renewable energy generation prediction and DN flexible scheduling, an improved PSO algorithm based on Pareto is designed [14, 15]. A prediction method for wind power generation is established based on wind speed. A calculation method for the electricity consumption of well groups is established using the Monte Carlo algorithm. An improved method is utilized to deal with the Pareto optimal solution in DN scheduling. Consequently, the operation of the well groups will be controlled to achieve the function of scheduling the DN load.
2.1 Optimal Solution Solving Algorithm for DN Scheduling Based on Improved PSO
PSO algorithm works randomly in the search target, maintains global search capability, avoids getting stuck in local optima through information sharing, and finds global optima through iteration. PSO algorithm is skilled at handling optimal resource scheduling problems [16]. PSO algorithm simulates bird flocks to find the optimal solution. A solution to each optimization problem can be viewed as a particle in the bird swarm search space. PSO algorithm was introduced to obtain the optimal strategy for DN scheduling. Figure 1 shows the mechanism diagram of the PSO algorithm.
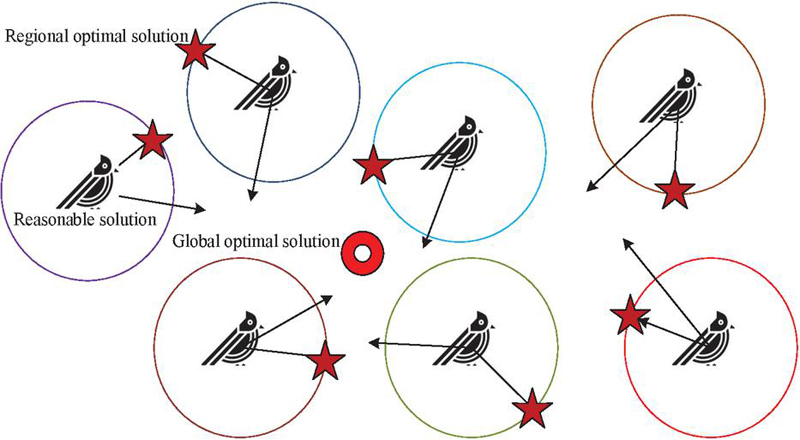
Figure 1 Mechanism of particle swarm optimization (PSO) algorithm.
In Figure 1, each bird with information on its position, velocity, and fitness values represents a potential solution to the problem. Each individual bird finds the regional optimal solution within its own search range and finds the global optimal solution through information sharing. Particles swim in the search space, updating their speed and position by updating individual and global extremes. Individual extremum represents the optimal solution found by the particle itself, while global extremum represents the global optimal solution. The particle velocity is represented by Equation (1).
| (1) |
In Equation (1), is the velocity of particle at the iteration. The particle position is represented by Equation (2).
| (2) |
In Equation (2), is the position of particle at the iteration. After each iteration, the particle velocity update is represented by Equation (3).
| (3) |
In Equation (3), is the inertia weight of the particle; and are learning factors; represents the optimal position of particle at the ( iteration; is the optimal position for the particle swarm at the ( iteration; and are random numbers within 0–1; is the particle update speed. The position update of particles after each iteration is represented by Equation (4).
| (4) |
In Equation (4), is the particle’s updated position, with a default time factor of 1. Therefore, is determined by the speed and position of the previous iteration. is a particle’s inertia weight. In particle search, if the velocity is too high, particles are prone to jumping out of the optimal solution range, while if the velocity is too low, they will fall into local optima. To avoid this issue, particles’ velocity and position range are set to minimum and maximum limits and . Figure 2 shows the flow chart of the PSO algorithm.
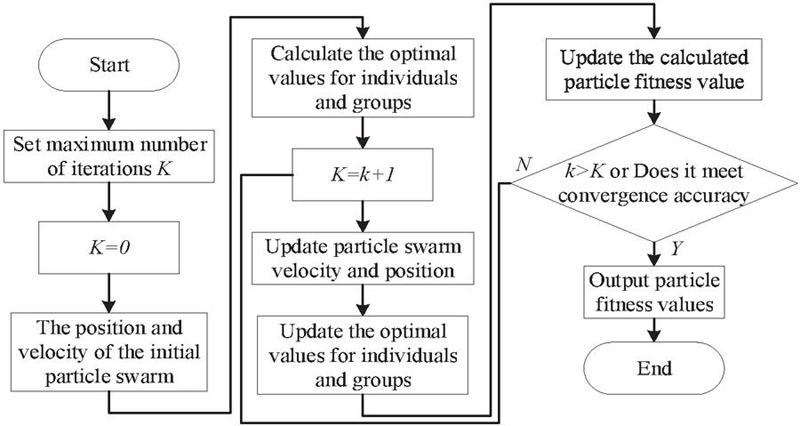
Figure 2 Flow Chart of particle swarm optimization (PSO) algorithm.
In Figure 2, the PSO algorithm first initializes the inertia weight, learning factor, spatial dimension, and number of iterations. A fitness value is calculated based on an objective function. The optimal positions of individuals and groups are calculated. If the optimal solution is not obtained, then iteration is continued. When convergence is completed or a maximum number of iterations is reached, the optimal fitness of the particle is obtained. However, PSO algorithm has a weak convergence ability and is prone to falling into local optima, and unable to find the optimal scheduling solution in DN scheduling. Therefore, this study improves PSO algorithm’s inertia weight and learning factor and introduces a flight time factor. An inertia weight represents the speed dependence of a particle on the previous iteration. A larger weight value is more convenient for a global search, but the local convergence ability will decrease. A smaller weight value can improve convergence accuracy and is beneficial for a local search. Therefore, this study optimizes the inertia weight. The adaptive inertia weight w is represented by Equation (5).
| (5) |
In Equation (5), is the current iteration count; is the maximum number of iterations; the adaptive inertia weight calculation method includes both linear and nonlinear dynamic adjustments; and are the minimum and maximum inertia weights, respectively. Improving PSO algorithm through adaptive adjustment of inertia weights, fast global search in the early stage increases convergence efficiency, and high-precision local search in the later stage ensures that the solution obtained is the global optimal solution as much as possible. In this way, the improved PSO can achieve both computational efficiency and accuracy in solving the optimal solution objective of DN scheduling. The learning factors represents the proportion of the particle’s own experience to the group’s experience, expressed as the particle’s dependence on the entire group. If global learning factor is too large, the particle independence is insufficient. If individual learning factors is too large, particles tend to move around. Therefore, this study optimizes asynchronous changes in learning factors. The improved learning factor is represented by Equation (6).
| (6) |
In Equation (6), the starting value of the learning factors is and , and the ending value is and . Through asynchronous changes in learning factors, is more convenient for global fast search in the early stages of iteration. In the later stages of iteration, is more convenient for local fine search. The role of learning factors is similar to adaptive inertia weights, but the optimization direction of learning factors is the search experience of particles. The time factor represents the search step size for the same particle, and the larger the time factor, the wider the range of particle search. Therefore, the study also makes adaptive improvements to the time factor T, which is represented by Equation (7).
| (7) |
In Equation (7), the time factor gradually decreases as the iteration number increases. According to Equation (4), the new position update is represented by Equation (8).
| (8) |
In Equation (8), by changing the time factor, the search speed can also be accelerated in the early stages and more refined search can be carried out in the later stages. The optimization of the flight time factor emphasizes improving the exploration and development capabilities of particles in the search space. DN scheduling is an extremely complex problem, and PSO algorithm can only find approximate optimal solutions. The improvement of PSO by three methods can jointly promote the accuracy of finding the optimal solution for DN scheduling. The research object is DN scheduling that considers new energy electricity and well groups’ flexible load, which belongs to a complex multi-objective problem, PSO algorithm is prone to premature convergence. The most common way to solve multi-objective problems is to increase weight coefficients to transform the problem into solving a single objective. However, it is difficult to set the weights of each part in DN. Therefore, further improvement of PSO is studied by optimizing it through Pareto to obtain a set of optimal solutions [17]. Figure 3 shows a multi-objective PSO algorithm based on Pareto.
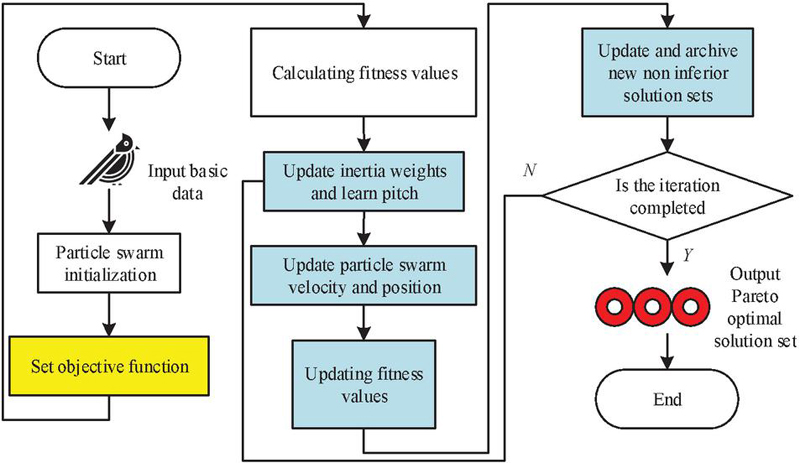
Figure 3 Multi-objective particle swarm optimization algorithm based on Pareto.
In Figure 3, based on Pareto PSO, data and population initialization are first performed. A multi-objective correlation function is established and calculated using the Pareto method. Afterwards, based on PSO, the optimal solution is found. During the iteration, the fitness value of the particles is calculated. The velocity, position, learning factor, and inertia weight of the particles are updated. By repeating the above process, the optimal solution set is obtained before the maximum iteration is reached.
2.2 Construction of DN Scheduling Model Based on Improved PSO
The DN scheduling model needs to consider wind power generation’s power and well groups’ flexible load. Therefore, the objective functions of the improved PSO algorithm based on Pareto include minimizing the mean square deviation of the equivalent load of a power system connected to new energy, minimizing the electricity consumption of the well group, and simultaneously minimizing both. To establish an objective function for the well group’s electricity consumption in the model, it is necessary to analyze the overall operation of the well group. According to statistical data, the starting operation time of the well group follows a normal distribution of working hours. The probability density of starting working hours is represented by Equation (9).
| (9) |
The working hours of the well groups follow a logarithmic normal distribution. The probability density of working hours is represented by Equation (10).
| (10) |
According to Equations (9) and (10), Figures 4(a) and 4(b) show the daily probability density distribution versus the start working time of the well (in hours) and well operation time (in minutes) of the well groups, respectively.
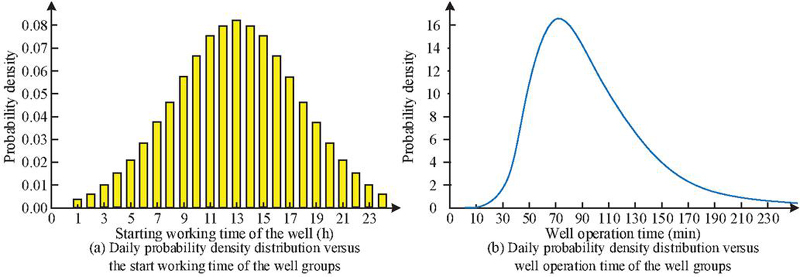
Figure 4 Probability density distribution map of the starting working time of the well group.
In Figure 4(a), 11:00–15:00 hrs. is the period of the day with the highest temperature, during which period most wells start working. In Figure 4(b), most wells have a working time of 75 minutes, with the working time of the wells concentrated between 60–100 minutes. The Monte Carlo algorithm is guided by mathematical statistics and probability theory, using the central limit law and the law of large numbers to sample from a known probability distribution model and solve for the estimated amount of event occurrence. This algorithm can effectively handle high-dimensional and nonlinear problems through probability simulation and integral estimation. Therefore, this study introduces the Monte Carlo algorithm to calculate the daily power of the well group. The well power during period is represented by Equation (11).
| (11) |
In Equation (11), is the well; represents the total number of well groups. According to Equation (11), the daily power of the well group is represented by Equation (12).
| (12) |
According to Equation (12), the electricity load of the well group in DN is calculated. The wind power generation power in DN is calculated based on the local wind speed. The power of wind power generation is affected by the equipment structure and wind speed. This area’s wind power equipment is determined. Therefore, this study calculates unstable wind speeds to obtain wind power generation power. According to the results of other studies, the wind speed follows an approximately a Weibull distribution, represented by Equation (13).
| (13) |
In Equation (13), is a shape parameter; is a scale parameter; is the actual wind speed. The local meteorological and geographical characteristics determine and . Figure 5 shows how and affect wind power generation capacity under a single variable.
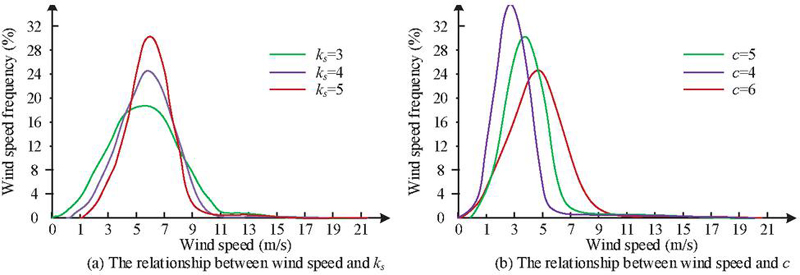
Figure 5 Analysis of the impact of k and c on wind power generation capacity.
Figure 5(a) shows the relationship between wind speed frequency and the shape parameter . As increases, the wind speed becomes more concentrated and the wind turbine’s power generation capacity becomes stronger.
Figure 5(b) shows the relationship between wind speed frequency and the scale parameter c. A larger means higher average wind speed and stronger power generation capacity of the wind turbine.
The wind power generation power based on wind speed is represented by Equation (14).
| (14) |
In Equation (14), is the actual wind speed; is the rated wind speed; is the wind speed at which the cut in occurs; is the wind speed cut out; is the rated power generation. Coefficients , , and are represented by Equation (15).
| (15) |
According to Equation (15), when the wind speed is greater than , the turbine is in a protected state with zero power. When the wind speed is greater than and less than , the greater the wind speed, the greater the power generated by the wind turbine. When the wind speed is equal to , the turbine reaches its rated power. When the wind speed is greater than and less than , the turbine power remains at its rated value because the power has reached the rated state. Based on the wind turbine’s power generation and the well group’s power consumption in DN, the equivalent DN load is represented by Equation (16).
| (16) |
In Equation (16), is the basic load of DN. is the equivalent load of DN. DN multi-objective optimization scheduling is represented by Equation (17).
| (17) | |
In Equation (17), is the first objective function; and are the constraint conditions, namely power’s upper and lower limits respectively for wind power generation and well group loads. The operating power is higher than 0 and less than the total rated power, that is, . . Therefore, based on a multi-objective function solved by Pareto and PSO algorithms, the minimum electricity consumption of the well group is represented by Equation (18).
| (18) |
This is done to make the load changes of the DN more stable and less volatile, which is more conducive to the stable operation of the power grid.
The second objective function is the minimum equivalent load Mean Squared Error (MSE) of the system, represented by Equation (2.2).
| (19) |
The third objective function is to minimize the mean square deviation of the electricity consumption of the well group and the equivalent load of the system; this can balance the power consumption of high-power well clusters with the fluctuations of the power grid system. By using Pareto-based PSO algorithm, the DN optimal scheduling strategy that takes into account wind power generation and well groups that can be found from the objective function. Finally, the intelligent transformation of the well group can avoid excessive DN load by timely powering off according to the DN load. A power prediction and DN scheduling model based on improved PSO algorithm is constructed, considering wind power generation and well groups’ flexible loads. Figure 6 shows the overall framework of the model.
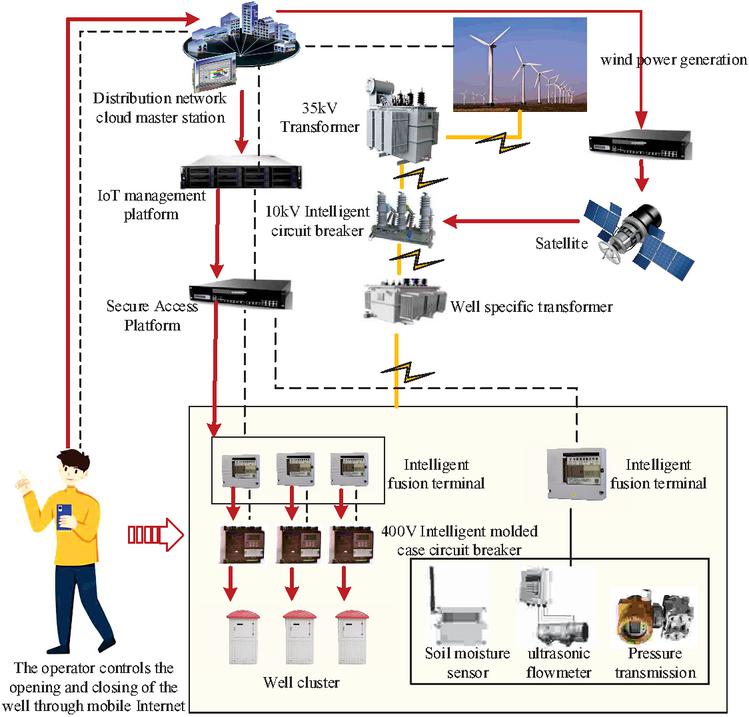
Figure 6 A framework for power forecasting and DN scheduling models that take into account flexible loads of wind power generation and well groups.
In Figure 6, a red line represents a control line, a dashed line represents an information line, and a yellow line represents the power circuit. Through model research, it is possible to predict the power of wind power generation and the load of computer wells. A multi-objective optimal solution, based on Pareto’s PSO algorithm well group and DN equivalent loads, is used. Then, the operator selectively controls the intelligent molded case circuit breaker to power off some of the wells on the mobile Internet end, combined with the sensor data on the Internet-of-Things end. When the DN load is too heavy, the operator can also cut off the line’s power through the intelligent circuit breaker connected to the satellite to avoid DN overload.
3 Results
This study conducted relevant tests to verify the model performance. This study first conducted a comparative test on the improved PSO algorithm to check its computational efficiency. Then, a simulation test was performed to predict the wind power generation power and test the power generation prediction accuracy based on the weather forecast of the test location. Finally, in the simulation test, the well group was connected and the scheduling effect of the research model in considering wind power generation and flexible load of the well group was tried.
3.1 Test Environment and Parameter Settings
The study used the well-known Griewank function to test the performance of the algorithm. In the test, a group of wells and a wind power station in the experimental location were selected to participate in the DN scheduling simulation test. The wind power data for wind power generation comes from meteorological forecasts. The simulation software used is MATLAB. The number of wells in the well group is set to 500. The rated power of the well is 30 kW. In the simulation tests, the number of particle swarm populations is set to 500. The inertia weight is adjusted linearly and dynamically. Set , , and learning factor , . The maximum number of iterations is set to 100. The basic load of DN is obtained from Table 1.
Table 1 The basic load of a certain DN line
| Time | Time | Time | |||
| Interval (hr) | Load (kW) | Interval (hr) | Load (kW) | Interval (hr) | Load (kW) |
| 1 | 4188 | 9 | 3311 | 17 | 4190 |
| 2 | 3092 | 10 | 3733 | 18 | 4111 |
| 3 | 3785 | 11 | 3699 | 19 | 3839 |
| 4 | 3280 | 12 | 4148 | 20 | 4500 |
| 5 | 3281 | 13 | 4421 | 21 | 4817 |
| 6 | 2874 | 14 | 4630 | 22 | 5113 |
| 7 | 2859 | 15 | 4679 | 23 | 5210 |
| 8 | 2908 | 16 | 4459 | 24 | 4419 |
The tests selected an unimproved PSO for comparison testing with the Pareto and PSO-based research design. In the simulation test, the research model was compared with an unscheduled DN load situation. The calculation efficiency and prediction accuracy of the fitness value analysis algorithm were selected to evaluate the predictability of wind power generation power. Peak valley difference rate, electricity consumption, total load value, and load mean square were selected as criteria to measure the scheduling ability of the DN scheduling model.
3.2 Analysis of Computational Efficiency and Wind Power Generation Prediction Ability of Improved PSO
The Griewank function (which is a commonly employed function in optimization studies) is a typical multimodal function with a large number of local minima and only one unique global minimum. Therefore, this function was chosen as the test function. Figure 7 shows the comparative test results of the basic PSO and the improved PSO algorithms.
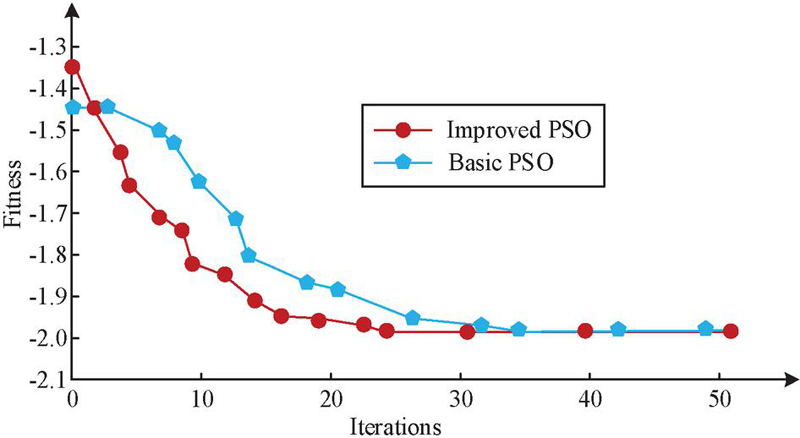
Figure 7 Basic PSO and Improved PSO Performance tracking curves.
In Figure 7, at the beginning of the iteration, the fitness value of PSO was 1.44, and convergence was achieved in 34 iterations to find the minimum value. The improved PSO curve was mostly located below the PSO, indicating a faster convergence speed of the algorithm. The proposed algorithm (using the Pareto algorithm with PSO) found the global minimum after only 24 iterations, and the study significantly improved the search accuracy and convergence speed of the PSO algorithm.
In the DN scheduling model, the output of wind power generation was easier to calculate than the load of well groups. Figure 8 shows the predicted power of wind power generation based on meteorological data.
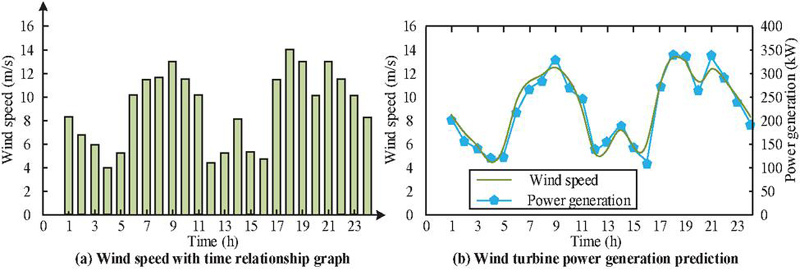
Figure 8 Predicting wind turbine power generation based on wind power.
Figure 8(a) shows a plot of wind speed versus time of day. It is seen that the wind speed was fluctuating between a minimum wind speed of 4 m/s and a maximum wind speed of 14 m/s.
Figure 8(b) shows the fitting graph of wind speed and wind power generation versus time of day. There is a strong correlation between wind speed and the power generation indicating that wind power generation can be accurately predicted through wind speed. The predicted maximum power of wind power generation was 348 kW, the minimum power was 100 kW, and the prediction accuracy was 96.13%.
3.3 Performance Analysis of an Improved PSO DN Scheduling Model
The above tests show that both the improved PSO and the wind power prediction method could meet the DN model’s scheduling needs. To verify the DN scheduling model that took into account the flexible loads of wind power generation and well groups, simulation tests were conducted on the model. According to the load diagram of the well group in Figure 4, the peak electricity consumption period was from 11:00 to 15:00 hrs. The DN scheduling simulation test sets the scheduling value of the well group during this period to reduce the load by 30%. Figure 9 shows the Pareto optimal solution set for the test.
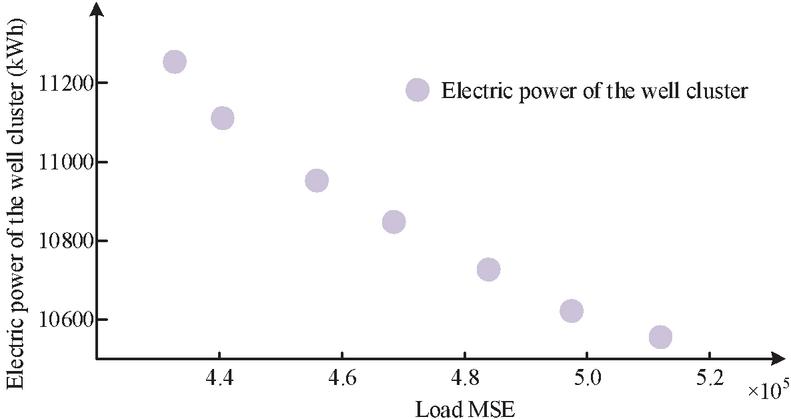
Figure 9 Pareto-optimal set.
In Figure 9, when the MSE of the load was 4.4 10, the electricity consumption of the well group was 11126 kWh. As the MSE of the load increased, the electricity consumption of the well group gradually decreased. From this, it can be seen that the MSE of load is inversely proportional to the electricity consumption of the well group. In scheduling, increasing the MSE of load requires reducing the number of wells in the well group through a control system.
A simulation test was conducted to regulate the peak hours of machine wells from 11:00 to 15:00 hrs. The transfer threshold of the machine well group was set at 30% to ensure that it did not affect normal agricultural planting demand. The simulation results of the DN load are shown in Figure 10.
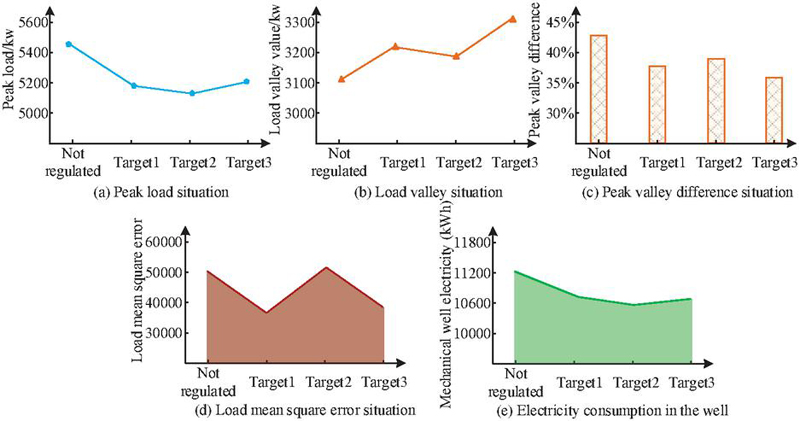
Figure 10 The total travel time results of various model comparison tests.
In Figure 10(a), the DN peak load without scheduling (Unregulated case) was 5467 kW, while the DN load peak scheduled under the three objectives (indicated as Targets 1 to 3 in the figure) was lower than the unregulated case, with Target 2 being the lowest at 5158 kW).
In Figure 10(b), the load valleys scheduled under the three Targets were all higher than the unregulated case at 3100 kW.
In Figure 10(c), the peak valley difference of scheduling under all three Targets was lower than the unregulated case at 42.5%.
In Figure 10(d), when using Target 1 scheduling, the MSE of the load was reduced by 31.0% compared to the unregulated case without scheduling. When using Target 3 scheduling, the load MSE decreased by 24.1%.
In Figure 10(e), the electricity consumption of the well group using Target 3 fell between that for Targets 1 and 2.
From this, it can be seen that the DN scheduling model established by optimizing PSO with Pareto algorithm plays a very good role in peak shaving and valley filling, reducing the overload risk of the DN.
To further validate the model’s scheduling effect, further tests were conducted with different wells, as shown in Figure 11.
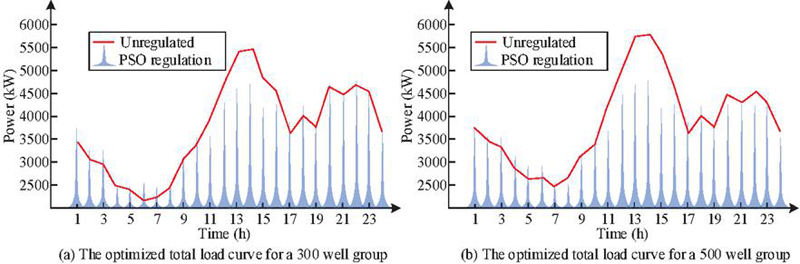
Figure 11 Model control effect of 300 and 500 wells.
Figure 11(a) shows the comparison of unregulated and PSO regulated scheduling effect of 300 wells group. During the peak electricity consumption period from 11:00 to 15:00 hrs, after improving the PSO DN scheduling model, the total load was reduced by 23.5%.
Figure 11(b) shows the comparison of unregulated and PSO regulated scheduling effect of 500 wells group. During peak electricity usage, after DN scheduling, the total load decreased by 28.5%.
From this, it can be seen that in the DN scheduling, after improving the PSO to calculate the optimal peak shaving solution, the operator can effectively control the total load of the DN and avoid overload by using the Internet-of- Things to cut off the power of the intelligent plastic shell circuit breaker.
4 Discussions
A comparative analysis was conducted on the performance of improved PSO and conventional PSO, and simulation tests were conducted on the DN scheduling model. The improved PSO algorithm needed 24 iterations to find the global minimum Griewank function, while the conventional PSO required 34 iterations. The results indicated that the improved PSO was more efficient in finding the optimal solution. These results were similar to the research conclusion of Wang et al. using GWO-PSO to solve the optimal hidden layer neurons in BP networks [18]. Therefore, the improved PSO based on Pareto optimality can enhance the optimization ability.
In the wind power generation prediction’s accuracy analysis, the predicted maximum power of wind power generation was 348 kW, the minimum power was 100 kW, and the prediction accuracy was 96.13%. These results were similar to the conclusions of Tang et al. in constructing wind speed prediction models and error prediction models based on GRU [19]. Therefore, the power of wind power generation could be accurately predicted through wind speed. Therefore, scientific scheduling of DN loads could be achieved through predicted values to reduce fluctuations in wind power output.
Finally, in the performance analysis of the DN scheduling model based on improved PSO, the electricity consumption of the well and the load MSE of DN were inversely proportional. In the scheduling effect of 300 wells, the total load decreased by 23.5%. In the scheduling effect of 500 wells, the total load decreased by 28.5%. The conclusions drawn by Nasrollahi et al. in their construction of a DN scheduling model considering distributed energy and electric vehicle charging loads in 2022 were similar [20]. Therefore, based on the improved PSO DN scheduling model, when considering the two unstable factors of wind power generation and well group load, DN scheduling could be accurately carried out, effectively avoiding DN line overload. The intelligent DN scheduling model could directly cut off power on the line or combine with sensing data from the Internet of Things to control the power outage of some wells, ensuring the stable and safe operation of DN.
5 Conclusions
The wind power generation’s output has fluctuations, and the well group’s power is comparatively large. Short-term concentrated operation causes DN overload, which poses a challenge to the safe operation of DN. In the study, a wind power generation prediction method was established using meteorological data for wind speed. A Monte Carlo algorithm was used to calculate the electricity consumption of the well group. A DN scheduling model that took into account wind power generation and well group loads were established through an improved PSO based on Pareto. Simulation tests were conducted. The designed adaptive PSO improved the ability to find the optimal Pareto. The DN scheduling model, which took into account wind power output and well group load, could effectively control the operation of well groups and reduce DN load through the Internet of Things in the event of wind power output fluctuations. Therefore, the proposed model can enable the orderly participation of well groups in DN scheduling and change the disorderly electricity consumption state of well groups under the comprehensive basic load and wind power fluctuation output. Meanwhile, this research model can reduce the risk of DN line overload and provide assurance for the stable operation of DN. In practical environments, due to differences in groundwater levels, the power of the well group is not constant. The load scheduling model for the established well group assumes that the power of the wells remains constant. Although it has a small impact on the overall test results, it is also an objective fact that actually exists.
References
[1] Zhou Y, Zhang Y, Zhu Y, Huang W, Chen S, Ma G. Capacity evaluation of hydropower for accommodating wind-photovoltaic power generation in the dry season. IET Renewable Power Generation, 2023, 17(14):3424–3441.
[2] Bonyani M, Ghanbarian M, Simab M. Blockchain technology based exchanged information security for demand-side management of grid-connected microgrid using model predictive control. IET Generation, Transmission & Distribution, 2022, 17(21):4677–4687.
[3] Zhu N, Hu P, Liu S, Jiang D, Liang Y, Li Z. Emergency reserve constrained optimal allocation of energy storage in a novel honeycomb-like microgrid cluster with volatile renewable energy resources. IET Generation, Transmission & Distribution, 2022, 16(2):305–318.
[4] Zhong B, Li J, Cai X, Chen T, An Q, Chen M. Structural design optimization of cfrp/al hybrid co-cured high-speed flywheel with the particle swarm optimization algorithm. Polymer Composites, 2023, 344(4):2161–2172.
[5] Ztürk M. Maruf. Tuning parameters of Apache Spark with Gauss–Pareto-based multi-objective optimization. Knowledge and Information Systems, 2024, 66(2):1065–1090.
[6] Sharma S, Bharti R. Two phased Yarn scheduling with novel binary hypergraphed PSO. The Journal of Supercomputing, 2023, 79(18):20712–20746.
[7] Priyadarshi R, Gupta B. 2-D coverage optimization in obstacle-based FOI in WSN using modified PSO. Journal of Supercomputing, 2023, 79(5):4847–4869.
[8] Hoseinpoor N, Ghaznavi M. A flexible objective-constraint approach and a new algorithm for constructing the Pareto Front of multi-objective optimization problems. Acta Mathematica Scientia, 2024, 44(2): 702–720.
[9] Qiao D, Wang Y, Pei J, Wen X. Research on green single machine scheduling based on improved ant colony algorithm, 2022, 55(1):35–48.
[10] Wang W, Fang X, Cui H, Li F, Liu Y, Overbye T J. Transmission-and-distribution dynamic co-simulation framework for distributed energy resource frequency response. IEEE Transactions on Smart Grid, 2022, 13(1):482–495.
[11] Chen Z, Hu Y, Tai N, Fan F, Huang W. Flexible dispatching method for park-level integrated energy systems considering energy cascade utilization. IET Generation, Transmission & Distribution, 2023, 17(2):497–514.
[12] Barani M, Vadlamudi V V. Analytical approach for adequacy assessment of cyber-physical multi-microgrid distribution systems with distributed generation. Electric Power Systems Research, 2022, 212(10):1–11.
[13] Shi H T, Su G, Pan J, Feng K, Zhou J. A novel microgrid power quality assessment model based on multivariate gaussian distribution and local sensitivity analysis. IET Power Electronics, 2023, 16(1):145–156.
[14] Gupta P P, Kalkhambkar V, Sharma K C, Jain P, Bhakar R. Optimal electric vehicles charging scheduling for energy and reserve markets considering wind uncertainty and generator contingency. International Journal of Energy Research, 2022, 46(4):4516–4539.
[15] Nasiri N, Zeynali S, Ravadanegh S N, Marzband, M. A tactical scheduling framework for wind farm-integrated multi-energy systems to take part in natural gas and wholesale electricity markets as a price setter. IET Generation, Transmission & Distribution, 2022, 16(9):1849–1864.
[16] Sun R, Yang T. Hybrid parameter-based PSO flexible needle percutaneous puncture path planning. Journal of Supercomputing, 2024, 80(4):5408–5427.
[17] Zhiruo Z, Lei C, Xiliang C, Jun L, Legui Z. Improvement of madrl equilibrium based on pareto optimization. The Computer Journal, 2023, 66(7):1573–1585.
[18] Wang D, Fan X, Guo Y, Lu X, Wang C, Ding W. Quality prediction and control of thin-walled shell injection molding based on gwo-pso, aco-bp, and nsga-ii. Journal of Polymer Engineering, 2022, 42(9):86–94.
[19] Tang G, Wu Y, Li C, Wong P K, An X. A novel wind speed interval prediction based on error prediction method. IEEE Transactions on Industrial Informatics, 2023, 17(14):3568–3581.
[20] Nasrollahi M, Arandian B, Baharizadeh M. Robust optimum distribution network scheduling with distributed generations, electric vehicles, and storage units. International Journal of Energy Research, 2022, 46(7):9431–9443.
Biographies

Lianrong Pan, Born in January 1985, Male, Guilin City from Guangxi province, Han nationality, received hisbachelor’s degree from Tianjin University in 2004, majoring in Automation, received his master’s degree from Tianjin University in 2008, majoring in Power system and Automation.
He is currently an engineer of Electric Power Grid Dispatching and Control Center of Guangxi Power Grid Corporation, Nanning, China. His research interests are virtual power plant dispatching operation control, distribution network dispatching professional management, dispatching personnel training.
September 2008 to July 2011, worked as a deputy dispatcher in the power dispatch control center of Liuzhou Power Supply Bureau, From July 2011 to present, Guangxi power grid electric power dispatching control center has been the practice dispatcher, sub-value dispatcher, positive dispatcher, Chief dispatcher.
He has published 10 academic articles, participated in 6 research projects, and 3 other academic studies research and achievements.

Xiao Yang, born in February 1995, male, Qingyang City of Gansu Province, Han nationality, Bachelor degree in Electrical Engineering and Automation from Guangxi University in July 2017, Master degree in Electrical Machinery and Appliances from Guangxi University in July 2020, researching power system stability.
2020–2021, trainee dispatcher of Electric Power Grid Dispatching and Control Center of Guangxi Power Grid Corporation, 2021–2024, deputy dispatcher of Electric Power Grid Dispatching and Control Center of Guangxi Power Grid Corporation, 2024 to present, positive dispatcher of Electric Power Grid Dispatching and Control Center of Guangxi Power Grid Corporation.
He has published 4 academic articles, participated in 1 scientific research project.

Yuan Fu, born in June, 1994, male, from Beihai, Guangxi, Han ethnicity, engineer, master. He obtained a bachelor’s degree in Electrical Engineering and Automation from Chengdu University of Technology in 2017 and a master’s degree in Electrical Engineering from South China University of Technology in 2020, with a focus on power dispatch and operation technology.
Work experience: From 2020 to 2024, worked as a dispatcher at the Electric Power Dispatching and Control Center of Guangxi Power Grid Co., Ltd.
Academic situation: He has published 10 academic articles, participated in 6 scientific research projects, granted 1 patent, and obtained 2 other academic research and achievements.

Xin Wei, Born in August 1992, Male, Gui ping City from Guangxi province, Han nationality, Bachelor degree in Electrical Engineering and Automation from Huazhong University of Science and Technology in 2015, Master degree in Electrical Engineering and Automation from Huazhong University of Science and Technology in 2019. The research direction is power system stability.
2019–2020, trainee dispatcher of Electric Power Grid Dispatching and Control Center of Guangxi Power Grid Corporation; 2020–2024, deputy dispatcher of Electric Power Grid Dispatching and Control Center of Guangxi Power Grid Corporation; 2024 to present, positive dispatcher of Electric Power Grid Dispatching and Control Center of Guangxi Power Grid Corporation.
He has published 6 academic articles, participated in 4 research projects, and 2 other academic studies research and achievements.

Shangbin Yuan, born in July, 1996, male, Hejin City, Shanxi Province, Han nationality, received the B.S. degree in electrical engineering and automation from Taiyuan University of Technology in 2018, and the M.S. degree in electrical engineering from Xi’an Jiaotong University in 2021.
2021 to present, He works currently at Electric Power Grid Dispatching and Control Center of Guangxi Power Grid Corporation. His research interests include the self-healing control and the service restoration for distribution network.
He has published 2 academic articles and obtained 1 other academic research and achievements.
Distributed Generation & Alternative Energy Journal, Vol. 40_2, 401–426.
doi: 10.13052/dgaej2156-3306.4028
© 2025 River Publishers