Research on the Optimal Location of Urban Electric Vehicle Charging Stations Based on the Whale Optimization Algorithm in the Context of Green Energy
Fangheng Xu1,* and Wen Zhang2
1Zhejiang Industry Polytechnic College, Shaoxing, Zhejiang, 312000, China
2State Grid Corporation of China Shaoxing Power Supply Company, Zhejiang, 312000, China
E-mail: sxxfh1980 @126.com
*Corresponding Author
Received 21 March 2025; Accepted 05 March 2025
Abstract
With the gradual increase in the number of new energy vehicles in cities, the current location and number of urban charging piles have seriously affected the residents’ demand for charging due to the limitations of urban population and urban roads. Based on the perspective of economic operation and user experience, a charging pile location model based on charging pile maintenance cost and user satisfaction is proposed, and the whale optimisation algorithm is used to seek the optimal location. Since the whale optimization algorithm has the disadvantage of fast convergence and easy to fall into local optimum, we propose a new algorithm based on Tent population initialization and adaptive factor optimization-Tent Adapt Whale Optimization Alogrithm (TAWOA)-to improve the performance of the algorithm as a whole, and in the simulation experiments, the performance of TAWOA is improved compared with that of ACO, PSO, and WOA in the three benchmark functions, and in the charging pile siting, TAWOA algorithm is able to obtain better results than WOA, which can effectively reduce the number of charging piles and reduce energy consumption.
Keywords: Green energy, whale optimization algorithm, charging stations.
1 Introduction
With the development of the world economy, environmental pollution, energy security and other issues are becoming increasingly prominent. It has become a trend to seek a green and sustainable shift of energy in the field of transport [1], and electric vehicles, which are powered by renewable and low-polluting electric energy, have become an important choice to replace traditional fuel vehicles. It has the advantages of cleanliness and sustainability, which are favored by various countries [2, 3], but owing to the technical limitations of its battery module, it is slightly insufficient in range compared with fuel motor vehicles. Although charging piles have gradually been adopted in cities to solve this problem, the phenomenon of idle charging piles still exists, charging infrastructure coverage is not high, the number of charging piles used and the ratio of fast and slow pile configurations is unreasonable, etc. How to establish the location of low-cost, user-satisfied electric vehicle charging piles is particularly important, from the essence of the site selection optimization problem to the NP problem, and the use of metaheuristic algorithms in one of the best ways to solve this type of problem [4]. Compared with algorithms such as the ant colony algorithm, the particle swarm algorithm, etc., the whale optimization algorithm [5], as a new metaheuristic algorithm that has emerged in recent years, has achieved better application results in various fields. On this basis, we use the whale optimization algorithm to solve the optimization study of charging pile siting. The main contributions of this paper are as follows: (1) Elaborate a new charging pile siting model, which starts from the perspective of economic operation and user experience and is the main object for considering the two main factors of charging pile maintenance cost and user satisfaction. (2) Aiming at the situation in which the WOA algorithm has fast convergence speed and easily falls into the local optimum, a WOA-based optimization algorithm, the TAWOA, is proposed, which adopts the Tent population initialization and the optimization strategy on the basis of the self-adaptive factor a, which improves the algorithm’s performance overall. (3) Simulation experiments use benchmark functions to test the performance of the TAWOA, verifying the superiority of the algorithm, while simulating the effect of the TAWOA in optimizing site selection under different scenarios.
2 Related Research
(1) Site selection optimization based on the coverage model To maximize the coverage demand target in a given area, [6] established a maximum coverage model to plan the number of EV charging stations to be allocated. Reference [7] proposed a flow-based ensemble coverage model to provide a scientific and economical layout scheme for new energy exchange stations and hydrogen charging stations. Reference [8] integrated charging efficiency and time into a flow-set-based coverage model and studied the problem of siting and configuring slow-speed charging stations with respect to electric motorbikes. Reference [9] constructed a charging station siting model capable of solving multitype parameter configuration optimization. Reference [10] established a full-coverage model in which origin-destination trips can cover vehicle mileage and used the Benders decomposition algorithm to solve the charging station siting problem optimally. Reference [11] proposed how to conduct site selection effectively in the context of smart cities from the perspective of green energy.
(2) Siting charging facilities on the basis of user travel behavior Reference [12] established a simulated optimal model from the perspective of user travel and charging behavior, with the goal of maximizing the service level indicators of electric vehicle charging stations. Reference [13] proposed an evaluation model based on charging user travel behavior in the context of considering EV mileage anxiety. Reference [14] used taxi data and constructed an electric taxi charging facility siting model on the basis of spatiotemporal demand coverage. Reference [15] used a machine learning model with the SHAP method to predict the locations of electric vehicle charging stations while fully considering user travel behavior. Reference [16] proposed setup planning for electric vehicle charging piles on the basis of user travel behavior.
(3) Electric vehicle charging station location model based on multiobjective optimization Reference [17] integrated the travel behavior of new energy vehicle owners and the popularity of electric vehicles, proposed a modeling method based on GIS geospatial thinking, and solved the optimal scheme for the location of charging stations. Reference [18] used the SPEA-II algorithm to solve the constructed siting model and obtained the Pareto solution set of the model after sufficient iteration. Reference [19] constructed a corresponding charging facility layout optimization model on the basis of the charging behaviors of new energy vehicle owners and used a multiobjective optimization algorithm as the site selection model solution method. Reference [20] proposed a multiobjective electric vehicle charging facility location model suitable for new energy vehicle owners traveling in a city and used a multiobjective optimization algorithm to solve the model to obtain the location plan. Reference [21] constructed a new charging facility siting model and used an improved chicken flock teaching algorithm to solve the multiobjective optimization model. Reference [22] constructed an electric vehicle charging station siting model that minimizes the comprehensive cost by considering the weights of different demand interest points. Reference [23] used a genetic algorithm and fuzzy hierarchical analysis to optimize the location and capacity of electric vehicle charging stations to obtain optimal location results.
The above research results provide an in-depth analysis of multiple factors affecting the optimal location of charging piles and analyze the current problems of urban charging piles, and the sorting of these results provides a better reference for the charging pile siting model we propose.
3 Charging Pile Siting Model
With the continuous growth of EV ownership, rational planning for charging pile siting has become a key issue to ensure the healthy development of the EV industry. A scientific charging pile siting model should consider not only the construction cost but also the long-term maintenance cost and user satisfaction. On the basis of the above two key factors, this model is designed to minimize maintenance costs and maximize user satisfaction, providing a more comprehensive and reasonable decision-making basis for the location of charging piles. To better carry out targeted research, we assume that the model adheres to the following provisions:
(1) Demand points are clear: the locations of multiple EV demand points (e.g., residential areas, commercial areas, office areas), the projected charging demand, and the user’s expectation of charging convenience are known.
(2) Limited candidate locations: There are a series of predetermined candidate locations for charging pile construction.
(3) Variable service range: The service range of each charging pile is affected by its power, the surrounding environment and other factors and can be estimated via a certain function.
(4) Known construction and maintenance costs: the cost of constructing charging piles at each candidate location and the subsequent maintenance costs are known, and the maintenance costs are related to the frequency of use of charging piles.
(5) User satisfaction is quantified: User satisfaction can be quantified by factors such as the distance from the demand point to the charging pile and the waiting time.
(6) Charging demand can be split: the charging demand of a demand point can be jointly satisfied by multiple charging piles.
To better understand the charging pile model proposed in this paper, we illustrate the relevant parameters, using to denote the set of demand points and as the number of demand points and to denote the set of candidate charging pile locations and as the number of candidate locations. The parameters are shown in Table 1:
Table 1 Description of relevant parameters
| Parameter | Description |
| the demand for charging at demand point | |
| Cost of constructing charging posts at Candidate Location | |
| Candidate Location Maintenance cost per unit of service volume of constructed charging piles, | |
| Service capacity (i.e., the maximum amount of charging demand that can be met) of the charging posts constructed at Candidate Location | |
| Distance from demand point to candidate position | |
| When a charging post is constructed at candidate location , then , otherwise | |
| Indicates the amount of charging demand to be met at demand point by the charging posts constructed at candidate location . | |
| Coefficient of influence of distance on user satisfaction | |
| Trade-off factor between maintenance costs and user satisfaction |
(1) Maintenance cost function The maintenance cost is the cost incurred during the operation of a charging pile to ensure its normal operation. This is related to the construction location of the charging piles and the service volume that each charging pile provides to each demand point. Each candidate location for the construction of a charging pile has a corresponding maintenance cost per unit of service volume, and the corresponding maintenance cost is incurred only when a charging pile is constructed at that location (i.e., decision variable ). The maintenance cost increases as the charging service volume provided by the charging piles for the demand points increases, so the maintenance costs for all locations where charging piles have been constructed need to be summed to obtain the total maintenance cost. The formula for the maintenance cost is given below:
| (1) |
(2) User satisfaction function User satisfaction is an important indicator of the reasonableness of charging pile siting, which is affected mainly by the distance from the demand point to the charging pile. In general, the closer the distance from the demand point is to the charging pile, the higher the user satisfaction. To quantify user satisfaction, we measure it by calculating the relative distance from each demand point to each charging post. For each demand point , whose distance to candidate location is , we use to denote the satisfaction of this demand point when the charging pile at candidate location is used, where is the maximum distance from demand point to all candidate locations. Then, the satisfaction is weighted according to the proportion of the charging demand satisfied by candidate location at demand point to the total charging demand at that demand point, and finally, the total user satisfaction is obtained by weighting and summing the satisfaction of all demand points and candidate locations. The user satisfaction formula is as follows:
| (2) |
(3) Objective function The objective of this model is to simultaneously minimize maintenance costs and maximize user satisfaction while accounting for construction costs. Since the objective function needs to take into account two conflicting objectives (minimizing maintenance costs and maximizing user satisfaction), we use a linear weighting approach to transform it into a single objective function.
| (3) |
where A and B denote the weights of the two functions, and the sum is 1.
4 Improved Whale Optimization Algorithm for Optimizing the Site Selection Model
4.1 Whale Optimization Algorithm
The whale optimization algorithm is a population intelligence optimization algorithm proposed by Mirjalili and Lewis in 2016. The main idea of this algorithm is to simulate the whole movement process of whales in the sea while catching food. The algorithm consists of three phases: encircling predation, bubble attack and food seeking. The WOA is widely adopted because of its simple principle, easy implementation and few parameter settings. In the algorithm, the population size of the whales is set as , the search space is dimensional, the arbitrary position of the th whale in the th dimensional space is , , and the corresponding position of the prey is the global optimal solution.
(1) Surrounding predation In the initial phase of the algorithm, the current optimal position is defined as the prey, all other whales around it are surrounded toward the optimal individual, and the mathematical model of this phase is expressed as follows.
| (4) |
where denotes the prey position, denotes the bracketing step, denotes the current number of iterations, and the mathematical formulas for and are expressed as follows.
| (5) | |
| (6) |
In the above equation, and denote random numbers between [0, 1], respectively, and is the convergence factor that gradually decreases from 2 to 0. The expression is as follows:
| (7) |
where and denote the current and maximum number of iterations, respectively.
(2) Bubble attack Whales complete prey attacks in the sea by spewing enormous bubbles of water from themselves. It consists of two main methods, i.e., the contraction encircling mechanism and the spiral updating mechanism. The contraction encirclement mechanism is realized by Equations (6)–(7), and the spiral updating position method mainly simulates the whale’s spiral movement in the sea. The mathematical model of this action is expressed as follows:
| (8) |
where denotes the distance between an individual whale and its current prey, denotes an integer constant used to bound the shape of the spiral, and denotes a random number between -1 and 1. Since whales have both constrictive encirclement and spiral movements, the probability of both movement choices is 0.5.
(3) Food-seeking stage In this phase, when each individual whale randomly selects the position of surrounding individuals for a random search, the mathematical model is as follows:
| (9) |
where denotes the randomized individual whale position vector.
4.2 Improved Whale Optimization Algorithm – TAWOA
Like most of the metaheuristic algorithms, whale optimization algorithms easily fall into the local optimum, especially when dealing with high-dimensional problems, for which the algorithm’s global search ability is weak; in some cases, the algorithm suffers from a slow convergence speed, resulting in a long running time. To further improve the performance of the algorithm, it is proposed to carry out research in two aspects: population initialization and adaptive factor optimization.
(1) Population initialization For intelligent optimization algorithms, good or bad initialization of the population directly affects the algorithm’s solution accuracy and convergence speed. The current whale optimization algorithm does not specialize in population initialization, which affects the performance of the algorithm to a certain extent. In this paper, with the advantage of the chaos algorithm in randomness and traversal, tent chaos mapping is used to initialize the population, and the expression is as follows:
| (10) | |
| (11) |
In Equation (10), a new population of individuals is generated via Tent chaos.
(2) Adaptive convergence factor The whale algorithm results indicate that the size of the value is affected by the influence of . When the value of is small, the algorithm easily falls into the local optimum, and when the value of is large, the algorithm has a better global search ability. To avoid this situation, the value expression is reset, and the value of the expression is as follows:
| (12) |
where is the maximum number of iterations, is the current number of iterations, and is the initial value of 2. As the number of iterations gradually increases, the value of gradually increases, the local search ability of the algorithm gradually weakens, and the global search ability gradually strengthens. When the value of gradually decreases, the local search ability of the algorithm gradually strengthens, and the global search ability gradually weakens. This can prevent the algorithm from falling into the local optimum and, at the same time, improve the ability of the algorithm to obtain the global solution.
(3) Algorithm complexity analysis The time complexity of the algorithm comes from two main parts: in the initialization of the population, Tent needs ; in the iteration process, it needs to calculate the fitness and update the position for each one, so the time complexity of the whole algorithm is . In terms of space complexity, the size of the optimal solution is , and the optimal solution of the fitness is , so the complexity of the algorithm in space is . where denotes the population size, denotes the dimension, and denotes the maximum number of iterations.
4.3 Optimization Objective Function Design Optimization of Electric Vehicle Charging Pile Locations Via an Improved Whale Optimization Algorithm
To better obtain the location of the optimal charging pile, we use the improved whale optimization algorithm to optimize the model site selection function to obtain the optimal location. The steps are as follows:
Step 1: Determine the EV charging pile siting problem. The goal is to find the optimal charging pile construction location and charging allocation scheme for each demand point on the basis of the construction cost, maintenance cost and user satisfaction.
Step 2: Initialize the TAWOA model coefficients, such as the number of populations and the maximum number of iterations;
Step 3: Take two decision variables and as a group as whale optimization algorithm individuals;
Step 4: Perform solution operations on the TAWOA model with the electric vehicle charging station siting function as the fitness function;
Step 5: Initialize the tent population for the TAWOA;
Step 6: Optimization of individuals via an adaptive convergence factor;
Step 7: Determine whether the end condition is reached; if the location of the optimal individual is output, decode to obtain the optimal and values, i.e., determine the optimal charging pile construction location and charging allocation scheme for each demand point. Otherwise, return to step 5.
5 Simulation Experiments
To better verify the effect of the algorithm in this paper, we first verify the performance of the algorithm and then verify the effect of the charging pile siting model via the algorithm. The hardware platform selected CPU is Core i7, the memory is 16GDDR4, the hard drive capacity is 1T, the software environment is Windows 10, and the simulation software is MATLAB 2024a.
5.1 Performance of the TAWOA
To be able to better optimize the location of charging piles for electric vehicles, we validate the performance of the TAWOA by comparing ACO, PSO, the WOA and the TAWOA. The commonly used Step function, Sphere function and Ackley function are chosen for comparison. We choose the commonly used Step function, Sphere function and Ackley function as the test functions, mainly because these functions are commonly used in the testing of various algorithms, and the test results have a certain degree of persuasiveness. In the ACO algorithm, the number of ants is set to 50, the pheromone evaporation rate is 0.5, the pheromone factor is 1, the heuristic factor is 2, and the probability is 0.9. In the PSO algorithm, the number of particles is set to 50, the inertia weight is 0.7, and the cognitive coefficient and social coefficient are 1.4. In the WOA, the value of parameter is 2, and the probability is 0.5. In the TAWOA algorithm, Tent is set to 0.1. We choose 4 indicators, the maximum value, maximum value, average value and standard value, as criteria. The results are shown in Table 2.
Table 2 Performance comparison of the four algorithms
| Function | Algorithm | Dim | Minvalue | Maxvale | Average | Standardized Value |
| Step | ACO | 2 | 28.5 | 2179 | 2142.108 | 248.6216 |
| 10 | 2521.4 | 10889 | 10799.48 | 838.0741 | ||
| 50 | 19471 | 54452 | 54100.18 | 3497.8 | ||
| PSO | 2 | 0 | 26.9 | 0.404 | 2.8172 | |
| 10 | 10 | 673.2 | 32.123 | 88.62312 | ||
| 50 | 966.9 | 6854.2 | 1199.893 | 803.2846 | ||
| WOA | 2 | 0 | 0 | 0 | 0 | |
| 10 | 1.0000 | 0 | 0.0333 | 0.0186 | ||
| 50 | 1.0000 | 0 | 0.0333 | 0.0186 | ||
| TAWOA | 2 | 0 | 0 | 0 | 0 | |
| 10 | 0 | 0 | 0 | 0 | ||
| 50 | 0 | 0 | 0 | 0 | ||
| Sphere | ACO | 2 | 53.45316 | 2147.376 | 2117.472 | 224.3414 |
| 10 | 2654.215 | 10737.29 | 10653.72 | 810.321 | ||
| 50 | 20191.87 | 53687.12 | 53346.07 | 3349.316 | ||
| PSO | 2 | 0 | 22.6721 | 0.28987 | 2.33227 | |
| 10 | 2.21259 | 943.4288 | 35.2843 | 125.8362 | ||
| 50 | 953.1772 | 7220.328 | 1245.006 | 911.9131 | ||
| WOA | 2 | 0 | 0 | 0 | 0 | |
| 10 | 0.2365 | 0 | 0.0347 | 0.0586 | ||
| 50 | 19.8165 | 0.0025 | 1.2477 | 3.6025 | ||
| TAWOA | 2 | 0 | 0 | 0 | 0 | |
| 10 | 0 | 0 | 0 | 0 | ||
| 50 | 0 | 0 | 0 | 0 | ||
| Ackley | ACO | 2 | 12.86832 | 21.5714 | 21.43746 | 0.97873 |
| 10 | 20.58872 | 21.5712 | 21.5549 | 0.10392 | ||
| 50 | 21.23706 | 21.5703 | 21.56512 | 0.03546 | ||
| PSO | 2 | 0 | 8.61741 | 0.31769 | 1.22638 | |
| 10 | 6.16192 | 18.17342 | 7.2551 | 2.45873 | ||
| 50 | 14.264 | 19.87434 | 14.67009 | 1.01612 | ||
| WOA | 2 | 0 | 0 | 0 | 0 | |
| 10 | 0.0031 | 0 | 0.0002 | 0.0006 | ||
| 50 | 0.0015 | 0 | 0.0002 | 0.0003 | ||
| TAWOA | 2 | 0 | 0 | 0 | 0 | |
| 10 | 0.0001 | 0 | 0 | 0 | ||
| 50 | 0.0007 | 0 | 0.0001 | 0.0002 |
The above data indicate that the TAWOA and WOA proposed in this paper yield better performance results for the three classical test functions. With respect to the step function, the WOA and TAWOA significantly outperform the ACO and PSO algorithms, and the TAWOA significantly outperforms the WOA on dimensions of 10 and 50. For the Sphere function, the WOA and TAWOA still outperform the ACO and PSO algorithms, but for dimensions 10 and 50, the TAWOA has a significant advantage over the WOA, which shows that the algorithms in this paper have excellent performance. In the Ackley function, the WOA and TAWOA still outperform the ACO and PSO algorithms, but the PSO algorithm also reaches the minimum value of 0 when the dimension is 2; however, it is still inferior to the WOA and TAWOA in terms of the other metrics, and the TAWOA has four metrics superior to the WOA when the dimensions are 10 and 50 dimensions. In general, the TAWOA shows that the improved algorithm has good performance because the WOA has good performance.
To further illustrate the performance of the TAWOA, we compare the basic whale optimization algorithm (WOA), the adaptive whale optimization algorithm (AWOA) and the algorithm of this paper, setting the number of iterations to 500, and the changes in the optimal fitness values of the three algorithms in 10 and 50 dimensions are shown in Figures 1(a–c) and 2(a–c). The figure shows that the three algorithms ultimately converge to 0, which indicates that the three algorithms have better fitness values. In the Step function and the Sphere function, although the fitness values of the WOA and AWOA are better than that of the TAWOA, which is 0, the difference between the TAWOA and the above two algorithms is not very large. In the Ackley function, the TAWOA is significantly better than the two algorithms are. The optimal fitness value of the TAWOA algorithm is better than the two algorithms, and the optimal fitness value is better than the two algorithms. algorithm, the optimal adaptation value can quickly converge to 0 compared with the WOA and AWOA algorithms, which shows that the TAWOA can improve the performance of the algorithm through the initialization of the Tent population and the change in the adaptive sinusoidal function.
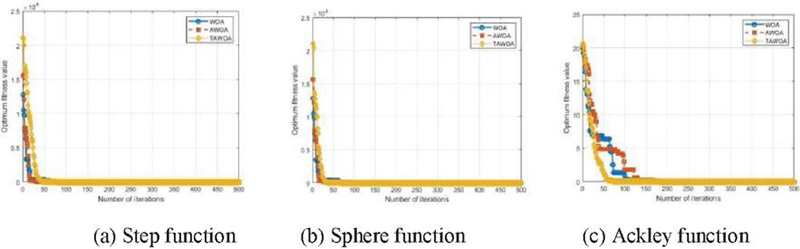
Figure 1 Comparison of the optimal fitness values of the three algorithms under 10-dimensional conditions.
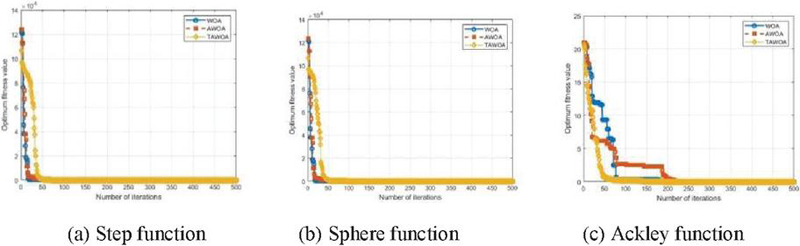
Figure 2 Comparison of the optimal fitness values of the three algorithms under 50-dimensional conditions.
Table 3 Scenarios with varying charge demand 1
| Scenario Elements | Value |
| Number of demand points | 3 |
| Number of candidate locations | 2 |
| 3 demand points correspond to charging demand, respectively | 10, 20, 30 |
| 2 candidate locations correspond to construction cost | 50, 60 |
| 2 candidate locations correspond to the maintenance cost per unit service capacity of charging pile | 2, 3 |
| Service capacity of charging piles at 2 candidate locations | 25, 35 |
| Distance from 3 demand points to 2 candidate locations | 10, 20; 15, 25; 20, 30 |
Table 4 Scenario with the same charging demand 1
| Scenario Elements | Value |
| Number of demand points | 3 |
| Number of candidate locations | 2 |
| 3 demand points correspond to charging demand, respectively | 10, 10, 10 |
| 2 candidate locations correspond to construction cost | 50, 60 |
| 2 candidate locations correspond to the maintenance cost per unit service capacity of charging pile | 2, 3 |
| Service capacity of charging piles at 2 candidate locations | 25, 35 |
| Distance from 3 demand points to 2 candidate locations | 10, 20; 15, 25; 20, 30 |
Table 5 Scenarios with varying charge demand 2
| Scenario Elements | Value |
| Number of demand points | 5 |
| Number of candidate locations | 3 |
| 5 demand points correspond to charging demand, respectively | 10, 20, 30, 40, 50 |
| 3 candidate locations correspond to construction cost | 40, 50, 60 |
| 3 candidate locations correspond to the maintenance cost per unit service capacity of charging pile | 2, 3, 4 |
| Service capacity of charging piles at 3 candidate locations | 25, 35, 40 |
| Distance from 5 demand points to 5 candidate locations | 10, 20, 15; 15, 25, 20; 20, 30, 10; 20, 30, 25; 20, 30, 40 |
Table 6 Scenario with the same charging demand 2
| Scenario Elements | Value |
| Number of demand points | 5 |
| Number of candidate locations | 3 |
| 5 demand points correspond to charging demand, respectively | 10, 10, 10, 10, 10 |
| 3 candidate locations correspond to construction cost | 40, 50, 60 |
| 3 candidate locations correspond to the maintenance cost per unit service capacity of charging pile | 2, 3, 4 |
| Service capacity of charging piles at 3 candidate locations | 25, 35, 40 |
| Distance from 5 demand points to 5 candidate locations | 10, 20, 15; 15, 25, 20; 20, 30, 10; 20, 30, 25; 20, 30, 40 |
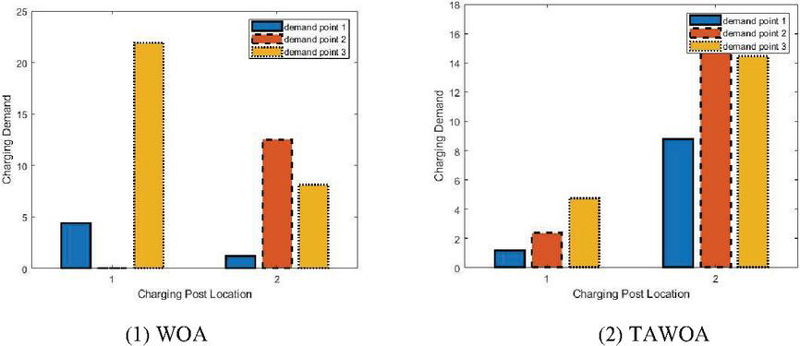
Figure 3 Scenarios with varying charge demand 1.
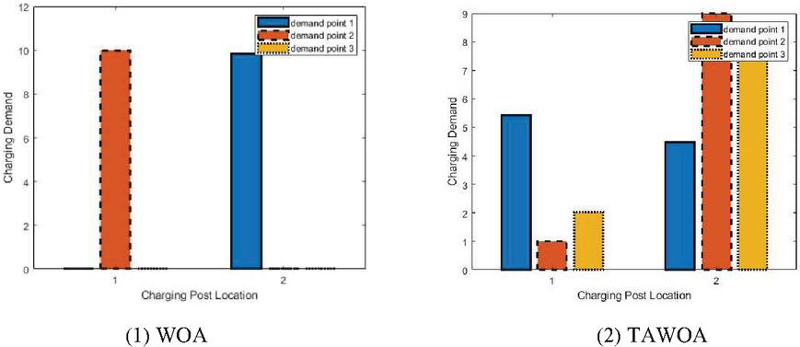
Figure 4 Scenario with the same charging demand 1.
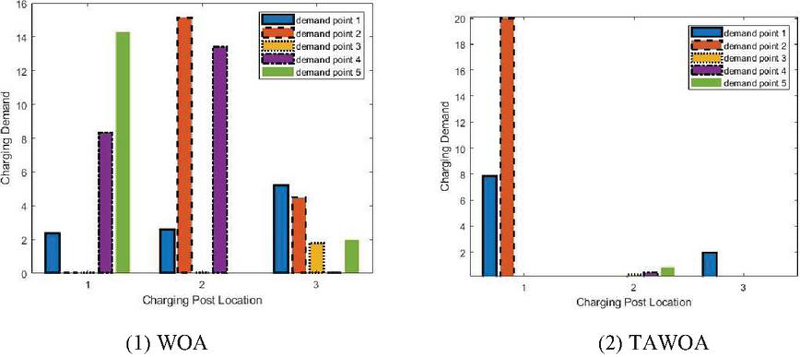
Figure 5 Scenarios with varying charge demand 2.
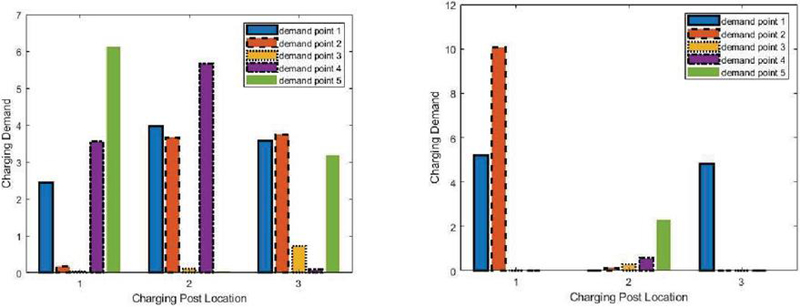
Figure 6 Scenario with the same charging demand 3.
5.2 Site Selection Performance
To better illustrate the superiority of the TAWOA in siting, we set up scenarios in which the demand points and candidate locations are not too large, considering the current urban population and urban roads, and this arrangement is more practically relevant for the siting of charging piles in cities. Tables 3–6 simulate the charging demand in 2 different scenarios. To better illustrate the superiority of the algorithm, Figure 3 shows 2 candidate locations with different charging demands, and Figure 4 shows 2 candidate locations with the same charging demand points. From Figure 3(a), the WOA is superior to the TAWOA in terms of charging amount demand for 3 demand points at 2 candidate positions, especially at the 2nd demand point, which is almost 0. From Figure 3(b), each charging position requires a certain amount of charging, and from Figure 4(a), the WOA is 0 at 2 of the demand points, whereas from Figure 4(b), the TAWOA has electricity demand at 2 demand points. Figure 5 shows the case of demand with different amounts of charge at 3 candidate locations, and Figure 6 shows the case of demand with the same amount of charge at 3 candidate locations. Figure 5(a) shows that the WOA algorithm has 0 values at the 2nd demand point, 3rd demand point and 4th demand point at these candidate locations, whereas in Figure 5(b), the TAWOA has almost 0 values at the demand point at these candidate locations. In Figure 6(a), although the demand of the charging quantity is the same, only 2 demand points are 0 in number when the WOA is used, whereas in Figure 6(b), the demand of the charging quantity is 0 when the TAWOA has more points with a demand charging quantity of 0, which shows that the algorithm has better results than the WOA does. From the above comparison situation, the TAWOA is significantly better than the WOA after it has been optimized, especially under the condition that the number of candidate locations increases, the advantage is more obvious.
We choose four benchmark test functions (as shown in Table 1) as the comparison objects in different dimensions. The number of iterations is also set to 1000 and the population size is 200, and the comparison data are shown in Table 2.
6 Conclusions
A charging pile siting optimization model based on the TAWOA is proposed, which is able to adapt to the address selection of urban charging piles and can obtain a better low maintenance cost and user satisfaction. In the next step, we expand the siting objective function to consider more factors, such as traffic flow, population density, and traffic facility scenarios, to further improve the application scenarios of the model and meet more charging pile-siting requirements.
References
[1] F. Kong, X. Liu, ‘A survey on green-energy-aware power management for datacenters’, ACM Computing Surveys (CSUR), Vol. 47, No. 2, pp. 1–38, November, 2014
[2] B.E. Lebrouhi, E. Schall, B. Lamrani, et al., ‘Energy transition in France’, Sustainability, Vol. 14, No. 10, pp. 5818–5845. April, 2022.
[3] A. Orlov, S. Kallbekken, ‘The impact of consumer attitudes toward energy efficiency on car choice:Survey results from Norway’, Journal of cleaner production, Vol. 214, pp. 816–822, March, 2019.
[4] S. Ghaemifard, A. Ghannadiasl, ‘Usages of metaheuristic algorithms in investigating civil infrastructure optimization models;a review’, AI in Civil Engineering, Vol. 3, No. 1, pp. 17–35, October, 2024.
[5] S. Mirjalili, A. Lewis, ‘The whale optimization algorithm’, Advances in engineering software, Vol. 95, pp. 51–67, May, 2016.
[6] Z. Moghaddam, I. Ahmad, D. Habibi, et al., ‘Smart charging strategy for electric vehicle charging stations, ‘IEEE Transactions on transportation electrification, Vol. 4, No. 1, pp. 76–88, March, 2017.
[7] Y.W. Wang, C.C. Lin, ‘Locating road-vehicle refueling stations’, Transportation Research Part E: Logistics and Transportation Review, Vol. 45, No. 5, pp. 821–829. September, 2009.
[8] Y.W. Wang, ‘Locating flow-recharging stations at tourist destinations to serve recreational travelers’, International Journal of Sustainable Transportation, Vol. 5, No. 3, pp. 153–171, February, 2011.
[9] Y.W. Wang, C.C. Lin, ‘Locating multiple types of recharging stations for battery-powered electric vehicle transport’, Transportation Research Part E: Logistics and Transportation Review, Vol. 58, pp. 76–87, November, 2013.
[10] Ö.B. Kiay, F. Gzara, S.A. Alumur, ‘Full cover charging station location problem with routing’, Transportation Research Part B: Methodological, Vol. 144, pp. 1–22, February, 2021.
[11] M. Abdel-Basset, A. Gamal, I.M. Hezam, et al., ‘Sustainability assessment of optimal location of electric vehicle charge stations: a conceptual framework for green energy into smart cities’, Environment, Development and Sustainability, Vol. 26, No. 5, pp. 11475–11513, May, 2024.
[12] X. Xi, R. Sioshansi, V. Marano, ‘Simulation-optimization model for location of a public electric vehicle charging infrastructure’, Transportation Research Part D: Transport and Environment, Vol. 22, pp. 60–69, July, 2013.
[13] J. Dong, C. Liu, Z. Lin, ‘Charging infrastructure planning for promoting battery electric vehicles: An activity-based approach using multiday travel data’, Transportation Research Part C: Emerging Technologies, Vol. 38, pp. 44–55, January, 2014.
[14] W. Tu, Q. Li, Z. Fang, et al., ‘Optimizing the locations of electric taxi charging stations: A spatial-temporal demand coverage approach’, Transportation Research Part C: Emerging Technologies, Vol. 65, pp. 172–189, April, 2016.
[15] I. Ullah, K. Liu, T. Yamamoto, et al., ‘Modeling of machine learning with SHAP approach for electric vehicle charging station choice behavior prediction’, Travel Behavior and Society, Vol. 31, pp. 78–92, April, 2023.
[16] X. Ouyang, M. Xu, ‘Promoting green transportation under the belt and Road Initiative: Locating charging stations considering electric vehicle users’travel behavior’, Transport Policy, Vol. 116, pp. 58–80, February, 2022.
[17] A. Namdeo, A. Tiwary, R. Dziurla, ‘Spatial planning of public charging points using multidimensional analysis of early adopters of electric vehicles for a city region’, Technological Forecasting and Social Change, Vol. 89, pp. 188–200, November, 2014.
[18] R. Shi, K.Y. Lee, ‘Multiobjective optimization of electric vehicle fast charging stations with SPEA-II’, IFAC-PapersOnLine, Vol. 48, No. 30, pp. 535–540, May, 2015.
[19] P.A.L. Hidalgo, M. Ostendorp, M. Lienkamp, ‘Optimizing the charging station placement by considering the user’s charging behavior’, Proc. In 2016 lEEE International Energy Conference. IEEE, pp. 1–7, 2016.
[20] L. Wang, C. Yang, Y. Zhang, et al., ‘Research on multi-objective planning of electric vehicle charging stations considering the condition of urban traffic network, ‘Energy Reports, vol. 8, pp. 11825–11839, November, 2022.
[21] S. Deb, X.Z. Gao, K. Tammi, et al., ‘A novel chicken swarm and teaching learning based algorithm for electric vehicle charging station placement problem’, Energy, Vol. 220, pp. 119645–119675, April, 2021.
[22] A. Pal, A. Bhattacharya, A.K. Chakraborty, ‘Allocation of electric vehicle charging station considering uncertainties’, Sustainable Energy, Grids and Networks, Vol. 25, pp. 100422–100450, March, 2021.
[23] M. Choi, Y.V. Fan, D. Lee, et al., ‘Location and capacity optimization of EV charging stations using genetic algorithms and fuzzy analytic hierarchy process’, Clean Technologies and Environmental Policy, pp. 1–14, August, 2024.
Biographies

Fangheng Xu received his bachelor’s degree in computer science and technology from Three Gorges University in 2004 and his master’s degree in computer application technology from Three Gorges University in 2007. He is currently a associate professor in the Zhejiang Industry Polytechnic College, and his research interests are computer networks, computer applications, network security, artificial intelligence and cloud computing. In this work, he is mainly responsible for proposing the main modeling ideas and methods.

Wen Zhang received her bachelor’s degree in electrical engineering and automation from Three Gorges University in 2004 and her master’s degree in electrical system automation from Three Gorges University in 2007. She is currently a senior engineer in the State Grid Corporation of China Shaoxing Power Supply Company and her research interests are computer networks, computer applications, electrical system automation, power system network and smart grid. In this work, he is mainly responsible for provides data related to power equipment.
Distributed Generation & Alternative Energy Journal, Vol. 40_1, 193–212.
doi: 10.13052/dgaej2156-3306.4018
© 2025 River Publishers