Microgrid Scheduling Based on BAS-APSO Considering Wind Power Output Characteristics
Cheng Yang*, Yang Yi, Zhennan Yang, Jinchang Chen and Lu Miao
Guangdong Power Dispatching Control Center, Guangzhou, 510000, China
E-mail: Yang11134@126.com; XUuu1111@126.com; Yang_20244@126.com; Chen_J8888@126.com; Huyuyang44@126.com
*Corresponding Author
Received 21 March 2025; Accepted 18 August 2025
Abstract
With the improvement of economic and social development level, microgrids have also experienced rapid development, but their optimization scheduling still faces huge challenges. Therefore, research has explored the multi-objective scheduling of microgrids. Firstly, a multi-objective optimization scheduling model for microgrids was established. Then, the particle swarm optimization algorithm is enhanced by combining dynamic inertia weights and the Beetle antenna search algorithm. When solving the Rosenbrock and Griebank functions, the proposed method had a fast convergence speed, taking 0.368s and 0.845s respectively, and could obtain a Pareto solution set that satisfies the convergence conditions. Improved particle swarm optimization algorithm could solve for lower fee optimization scheduling results in three different objective functions. The algorithm demonstrates efficacy in the domain of microgrid scheduling optimization. The research results contribute to maintaining the efficient and stable operation of microgrids and reducing operating fees.
Keywords: Microgrid scheduling, particle swarm optimization, wind power generation, inertial weight, beetle antenna search.
1 Introduction
Currently, renewable energy is significant for promoting regional economic development. Microgrids are an effective way to consume renewable energy, which can minimize environmental pollution. A microgrid is comprised of a number of discrete components [1]. The integration of microgrids and renewable energy not only improves the efficiency and reliability of the power system, but also promotes the green transformation of the energy structure. Through the flexible operation and intelligent management of microgrids, renewable energy can be better utilized, dependence on traditional energy can be reduced, and efficient energy utilization and sustainable development can be achieved. However, as microgrids continue to scale up in size, inherent limitations regarding their anti-interference capabilities and individual capacity constraints have become increasingly apparent. In response to these challenges, grid-connected microgrid configurations have emerged as an effective solution. In grid connected mode, microgrids have dual identities as “loads” and “power sources”, relying on the large grid to maintain their voltage and frequency stability [2]. It is of paramount importance to implement microgrid scheduling to facilitate the extensive integration of distributed power sources and renewable energy, and to ensure the reliable provision of diverse energy forms to consumers. Microgrid scheduling refers to the management and regulation of energy flow within a microgrid to achieve self-balancing, self-management, and multiple operating modes.
Antoniadou, Plytaria, K. et al. constructed an optimization model with the objective of determining the optimal energy and flexibility scheduling of residential microgrids, and maximizing the expected benefits of flexibility. The model was tested. The economic value generated by the proposed model is at least 7% of the operating fee of building microgrids [3]. Zhang H et al. proposed a Multi-Objective Optimization (MOO) strategy with penalty boundary intersection, considering the frequency dynamics of load voltage and islanding awareness, to address the security and economic challenges faced by microgrid scheduling. The proposed strategy could meet voltage and frequency stability requirements and reduce economic fees [4]. Basak et al. believes that microgrids can ensure the full utilization of renewable energy. Therefore, they analyzed low-voltage microgrid systems in three different scenarios and proposed a comprehensive intelligent optimization algorithm. This method can reduce power generation fees by 15% [5]. Shezan SA et al. evaluated the optimization of microgrid scheduling by estimating the size of components and the operating characteristics of microgrids, and used improved genetic algorithms to implement different power scheduling techniques. Load tracking had a good effect on microgrid scheduling optimization, which was helpful for estimating the combination of resource generation loads [6]. Hou S et al. built a MOO microgrid optimization framework for modern microgrid scheduling optimization, combining demand side management, forecasting technology, and economic environment scheduling, and simulated the application scenarios of microgrids. The proposed framework could provide a load demand curve and provide more environmentally friendly and low-fee solutions [7]. Wu et al. proposed a microgrid source load scheduling strategy and demand response optimization scheduling model to explore the potential energy load interaction between microgrids and electric vehicles under the background of green emission reduction, considering the features of carbon capture systems and renewable energy generation technologies. The proposed strategy could effectively improve the efficiency [8].
Through the application of intelligent algorithms, microgrids can better utilize renewable energy, reduce dependence on traditional energy, achieve optimal energy allocation, and adapt to changes in uncertain factors in microgrids [9]. Ali Z M et al. modeled a microgrid through Monte Carlo simulation, and optimized the power management of the microgrid using grasshopper optimization algorithm. The proposed algorithm could effectively solve the model to provide feasible solutions that could reduce the operating fees and environmental pollution of microgrids [10]. Zhang Y et al. analyzed the MOO problem of microgrids composed of renewable energy sources under islanding and grid connected operating conditions, and suggested a model that introduced Gaussian mutation and sine mapping to solve the low accuracy problem of traditional algorithms. The proposed algorithm had good effectiveness and economy [11]. Khalil AE et al. constructed a MOO tuning strategy to address the issue of poor frequency stability in isolated microgrids, taking into account the control signals of the microgrid controller. The proposed strategy could keep the isolated microgrid system stable and had good effectiveness and sensitivity [12]. Tabak A proposed a frequency deviation and control signal minimization method to address the lack of research on microgrid frequency control using MOO algorithms. The proposed method was superior to traditional MOO genetic algorithms and had good robustness [13]. Rai A et al. proposed using a fuzzy cascaded to address the stability and performance degradation caused by insufficient damping in multi regional microgrid systems. The proposed method were ultimately validated through a simulation analysis [14]. Sahoo GK et al. proposed a grassland dog optimization algorithm to enhance the gain parameters of the proportional integral controller for the control problem of microgrids, promoting the integration of hybrid renewable energy in microgrids. The proposed method could improve power factor, enhance power control, and reduce voltage deviation, thereby providing certain technical support for real-time applications in microgrid systems [15].
In summary, although there is currently a large amount of research applying intelligent optimization algorithms to microgrid regulation, the power load in microgrids has time-varying and uncertain characteristics, which poses higher requirements for optimizing scheduling strategies. In this context, to improve the efficiency of the daily operation of microgrids, a MOO scheduling model is established in this study, and the Adaptive Particle Swarm Optimization (APSO) with the Beetle Antenna Search (BAS) algorithm is proposed to handle the model. The research aims to propose an effective MOO method for microgrids, to enhance the microgrid operation and reduce operating fees. The innovation of this study lies in the introduction of inertia weight normal distribution attenuation strategy to balance the local and global optimal performance of PSO algorithm. At the initial stage of the search, greater weight is assigned to the PSO algorithm for global search. As the search progresses, the weight gradually decreases, allowing the algorithm to focus more on local search. At the same time, combining the BAS algorithm with less computational complexity to improve the convergence speed of the PSO algorithm, a more efficient BAS-APSO algorithm can be designed to solve complex microgrid optimization scheduling problems.
2 Methods and Materials
To explore the optimization scheduling problem of microgrid systems, this study considers the characteristics of wind power output to (?) build a MOO scheduling model for microgrids. Then, computer intelligent optimization algorithms with good search performance are utilized to solve the model.
2.1 Construction of MOO Scheduling Model for Microgrid
A microgrid is a system that connects distributed energy sources, typically with clear electrical boundaries and a common coupling point with the main grid. It can be connected to the main grid or operate in “islanding mode”, aiming to achieve flexible and efficient application of distributed power sources. Microgrid technology refers to a system that connects dispersed power generation resources, functioning as a localized and self-sufficient energy system that includes not only power generation resources, but also storage systems and controllable loads, with a control system that can coordinate operations [16]. The common microgrid structure is shown in Figure 1.
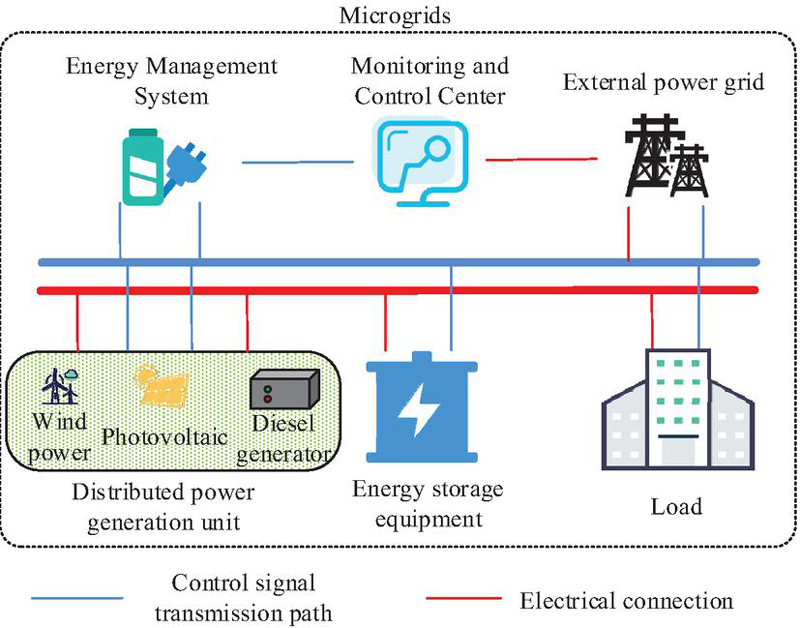
Figure 1 Structural diagram of microgrid.
Diesel generators play a role as backup energy in microgrids, mainly providing stable power support in case of insufficient or faulty renewable energy supply, and achieving complementary utilization of energy with new energy generation technologies. The intermittency and uncontrollability of renewable energy are the core reasons for insufficient power supply, for example, due to fluctuations in natural conditions or equipment failures, the real-time power generation of clean energy such as wind and photovoltaic cannot meet the current load demand. Wind Power Generation (WPG) refers to converting the kinetic energy of wind into electrical energy. Weibull distribution is a probability distribution model commonly used for wind speed analysis, which can better describe the randomness and uncertainty of wind speed. It transforms the uncertainty of wind speed into the form of probability distribution, and considers this uncertainty in the optimization model. Therefore, for WPG units in microgrid systems, the Weibull function is used to build a mathematical model, as shown in formula (1).
| (1) |
In Equation (1), represents the gamma function; denotes the wind speed of the impeller; is the shape parameter; represents the standard deviation of the wind speed; represents the distribution parameter; represents the average wind speed. The relationship between wind speed and wind turbine output power is shown in Equation (2).
| (2) |
In Equation (2), and are the cut in wind speed and cut-out wind speed; and are the decision factors for actual wind speed; is rated wind speed; is rated power. The calculation of and is shown in Equation (3).
| (3) |
For the convenience of calculation, the relationship curve between and is linearized. The kinetic energy of wind is proportional to the square of the wind speed, and the air quality swept by a wind turbine per unit time is proportional to the wind speed. Therefore, this study assumes that the output power of a wind turbine is proportional to the cube of the wind speed , that is . Where is the proportionality constant. At the rated wind speed , the power reaches the rated power , and by substituting it into the above equation, is obtained. By substituting into Equation (2), the relationship between and is shown in Equation (4).
| (4) |
Photovoltaic Power Generation (PVG) represents another widely utilized clean energy generation technology [17, 18]. PVG is related with various factors such as external environment and internal factors, resulting in fluctuations in the output status of PVG. The expression of the output current is shown in Equation (5).
| (5) |
In Equation (5), represents the output current; represents the photocurrent; represents the saturation current; represents the unit electron charge; represents the p-n junction curve coefficient; represents the Boltzmann constant; represents the operating temperature of the solar panel; represents the voltage; represents the resistance when the components are connected in series; represents the resistance when the components are connected in parallel. In a grid connected microgrid, Equation (6) shows the PVG ’s output power.
| (6) |
In Equation (6), is the output active power; represents the derating factor; and both represent the solar radiation’s intensity; represents the solar panel’s temperature coefficient; and both represent the battery temperature. The deployment of Energy Storage (ES) devices has the potential to optimize the utilization of electrical energy within the power system. The mathematical model of the ESdevice is shown in Equation (7).
| (7) |
In Equation (7), and are the remaining capacity at time and ; and are charging efficiency and discharging efficiency, respectively; is charging and discharging power. The power load refers to the set of power consumed by various electrical facilities in the power system at a certain time, and the load model is a mathematical and statistical model established based on load data and other relevant information to describe the changes in power load [19]. The power load of a microgrid system is shown in Equation (8).
| (8) |
In Equation (8), is the standard deviation of load power; represents the average value of load power. However, due to the limited regulation ability of microgrids for high energy loads, their participation in demand side response is not considered in the study. The specific calculation of response output per unit time is shown in Equation (9).
| (9) |
In Equation (9), is the quantity of users; and respectively represent the instantaneous response state and instantaneous response power of user at time . With the above analysis, this study takes the output characteristics of distributed WPG, PVG, and diesel generators as the basis, and sets two scheduling objectives: economic and environmental protection. This study considers the output characteristics of a single distributed energy source as the baseline performance for independent operation, without considering the interaction effects between components. In Figure 2, the study first constructs the topology of a grid connected microgrid, where each distributed generation unit, ESdevice, and various loads are connected to the microgrid bus through Direct Current to Alternating Current (DC-AC) and alternating Current to Direct Current C-DC) converters.
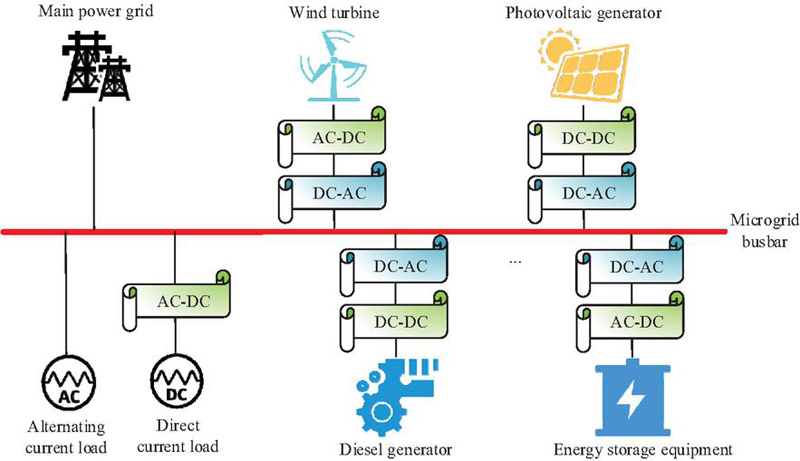
Figure 2 Topology structure of grid connected microgrid.
In cost function modeling, cost calculation is based on hours as the basic time unit, and the objective function value represents the total cost within a complete scheduling period (24 hours). All operating costs are calculated in real-time based on the power and corresponding unit price during the period and accumulated. Equation (10) shows the objective function for minimizing the microgrid ’s operating fee.
| (10) |
In Equation (10), represents interaction’s overall fee; represents the diesel generators’ overall fee; represents the ES’s maintenance fee. Equation (11) shows the calculation of each fee.
| (11) |
In Equation (11), and represent the purchase and sale prices of electricity for microgrids and large grids; and represent the purchase and sale power of microgrids and large grids, respectively; represents the maintenance fee of diesel generators; represents the fuel fee; denotes the ES’s operation and maintenance fee coefficient; is the ES’s power. The objective function for minimizing is shown in Equation (12).
| (12) |
In Equation (12), is the pollutant treatment for the large power grid’s fee; is the pollutant treatment for diesel generators’ fee; is the treating class pollutants’ fee coefficient; is the class pollutants’ emissions. Equation (13) shows the expression for the total power balance constraint of the system.
| (13) |
In Equation (13), represents the output power; represents the interconnection line’s transmission power. The objective function does not define a single mode, and the optimized dispatching model constructed dynamically characterizes the operation state through the transmission power of the tie line. When its value is non-zero, it is the grid connection mode, and when it is zero, it will automatically switch to the island mode. The optimization process always aims to minimize the total system cost, while covering the operational constraints of both modes to ensure that the solution is feasible in any mode. The specific optimization and scheduling strategy for microgrid is illustrated in Figure 3.
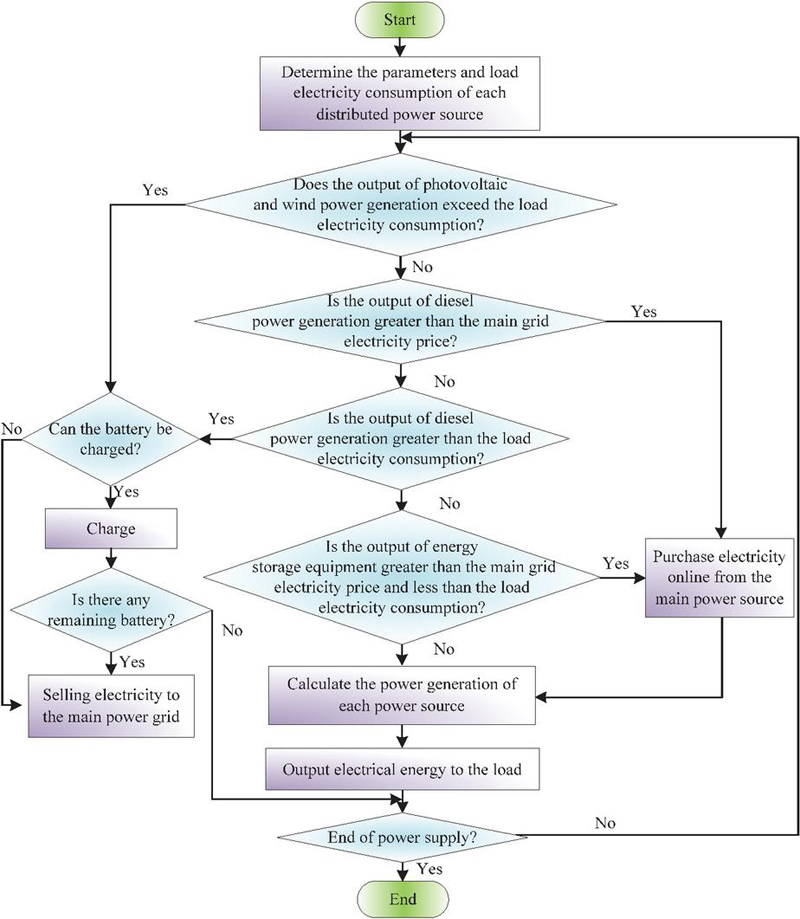
Figure 3 Optimization and scheduling strategy for grid connected microgrids.
In Figure 3, the algorithm is applied to a single microgrid level, and the optimization scheduling strategy first determines the output of PVG, WPG, diesel power generation, and ES equipment. Secondly, determine whether the battery can be charged. The feasibility of battery charging needs to meet both the conditions of the system being in grid connected mode and the real-time state of charge of the battery being below 100%. This mechanism dynamically determines charging and discharging behavior through real-time monitoring of SOC values and grid connected status, ensuring a balance between safety and economy. Then, calculate the power generation. Finally, considering the profit issue of microgrids, when the power generation output is greater than the load consumption and during peak periods, priority should be given to selling electricity to the grid. When in a flat valley period, priority should be given to charging the battery, and any excess electricity should be sold to the grid. Online power purchase “refers to importing electricity from the main power grid.
2.2 Optimization and Scheduling Solution of Microgrid Based on BAS-APSO
The mathematical model for microgrid optimization scheduling established in this study has a high level of complexity. To effectively solve it, an intelligent optimization algorithm that can adapt to different problem requirements and has good search performance is adopted in this study. The PSO algorithm has the advantages of easy implementation and fewer parameters, making it suitable for rapid development and application. It can handle nonlinear and multimodal optimization problems, and is very suitable for complex energy management scenarios in microgrids. Therefore, the study adopts PSO algorithm to solve the mathematical model of microgrid optimization scheduling. PSO originates from the study of bird hunting behavior and can move individuals in a group to good areas based on their adaptability to the environment [20]. Assuming there exists a -dimensional space. Once all iteration operations are completed, the optimal solution can be output. The optimal state of all particles in the population is calculated as shown in Equation (14).
| (14) |
In Equation (14), represents the optimal solution, which is the position marker when the population iterates to the best solution. Figure 4 presents the flowchart of the PSO.
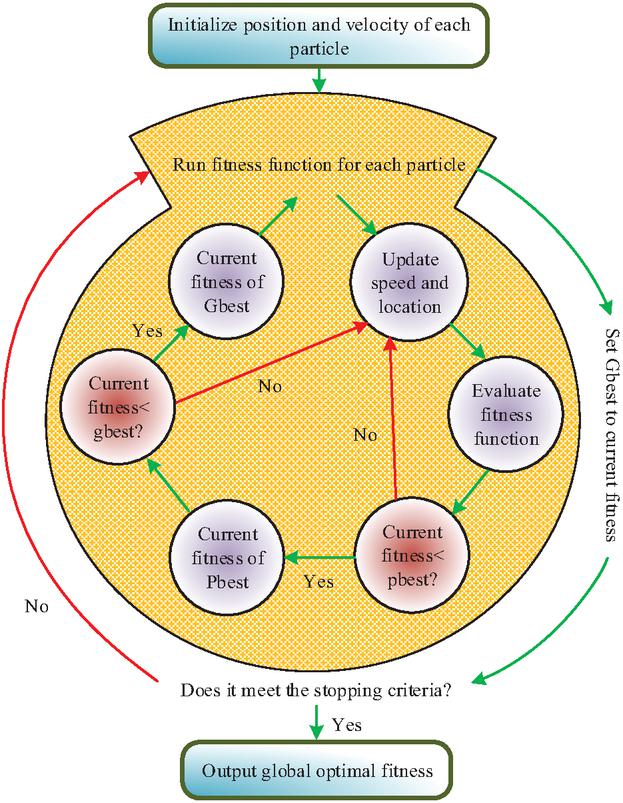
Figure 4 Flowchart of PSO.
The inertia weight of traditional PSO algorithms are usually fixed or linearly attenuated, and cannot be adjusted according to the actual convergence of the algorithm, resulting in low solution accuracy. Specifically, in the early stages of the PSO algorithm, high inertia weights are advantageous for global search. But if the inertia weight cannot be dynamically reduced according to the actual convergence situation, the particles cannot fully utilize the extremum for local search in the later stage, resulting in lower solution accuracy. At the same time, when the particle swarm approaches the local optimum, the inertia weight cannot be reduced in time to limit the inertia of particles, making it difficult for particles to effectively escape from the local optimum region, and the algorithm is prone to getting stuck in the local optimum. The normal distribution attenuation strategy dynamically adjusts the inertia weight through the normal distribution curve. The characteristics of the normal distribution curve make the inertia weight larger in the early stage of iteration, which is helpful for global search. As the number of iterations increases, the inertia weight gradually decreases, thereby enhancing the local search capability. Therefore, the study introduced an inertia weight normal distribution attenuation strategy to balance the local and global optimal performance, as shown in Equation (15).
| (15) |
In Equation (15), represents the dynamic attenuation value of the inertia weight, represents the largest iteration. Through systematic parameter sensitivity analysis, the convergence performance of different inertia weight dynamic attenuation values (0.1–0.9) was compared on a standard test function. It was found that when the value was 0.4433, the attenuation characteristics of the normal distribution curve were most suitable for the PSO search mechanism, which could achieve the best balance between global exploration and local development of the algorithm. Improvements are made to the traditional PSO using and , as shown in Equation (16).
| (16) |
Although the PSO algorithm can escape from local optima through the mechanism of updating particle velocity and position, it also has limitations such as sensitivity to parameter settings and complex calculations. The BAS algorithm can automatically adjust parameters based on the dynamic characteristics of the controlled object, and quickly respond to the dynamic changes of the controlled object, improving the response speed and accuracy of the control system and having good anti-interference ability. Therefore, in order to improve the convergence speed of PSO algorithm, the study also introduced the BAS algorithm with less computational complexity. The BAS algorithm is a biologically inspired optimization algorithm. Longhorn beetles sense the intensity of food odors through two antennae and adjust their flight direction to find food sources. It has been widely used in multi-objective energy management of microgrids [21]. Assuming the variable is , to normalize the vector, create a separate unit direction vector as presented in Equation (17).
| (17) |
In Equation (17), represents the random function; represents the dimension. To better describe the motion of the beetle antennae, the search area was modeled, as shown in Equation (18).
| (18) |
In Equation (18), represents the right antenna search area; represents the antenna search capability; represents the left antenna search area. To enable the algorithm to perform cyclic search, a position update iterative model was established, as shown in Equation (19).
| (19) |
In Equation (19), represents the search step size. Since and own a remarkable influence on the algorithm’s search results, the study introduces a learning factor to enable and to interact with each other, as illustrated in Equation (20).
| (20) |
In summary, the BAS-APSO proposed by the research institute first searches for a single particle as a beetle and ensures that the initial velocity and position of the beetle are consistent with the particle. Secondly, the fitness functions are analyzed and compared, and position updates are performed. Equation (21) shows the update of speed and position.
| (21) |
In Equation (21), represents the update rate of particles; represents the current position searched by the beetle; indicates the speed. The specific calculation process of the BAS-APSO is shown in Figure 5.
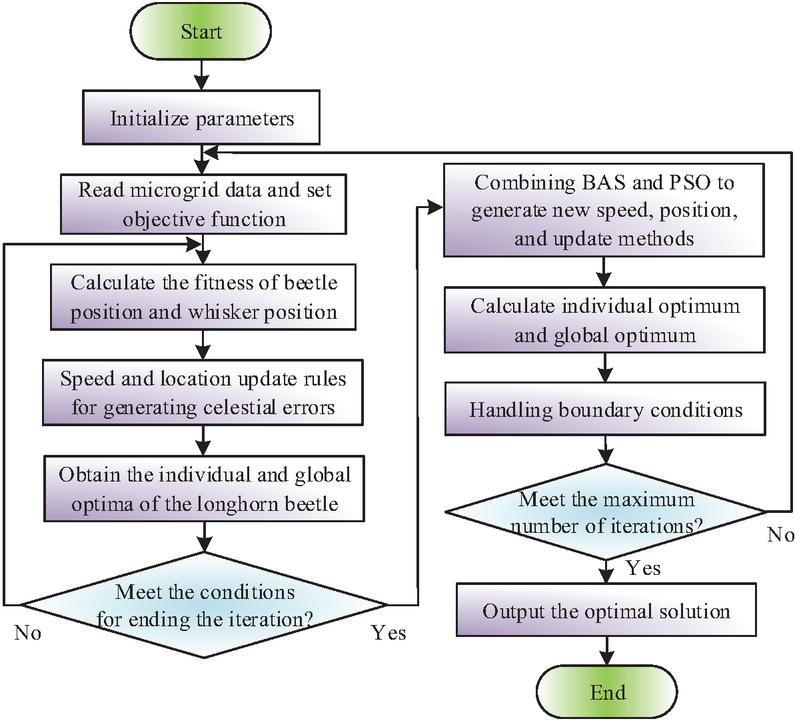
Figure 5 Flowchart of BAS-APSO.
As illustrated in Figure 5, the BAS-APSO initially establishes the objective function based on the output of each component within the microgrid. Subsequently, it reduces the overall fee by optimizing the output of new energy sources and configuring the ES devices’ charging and discharging times. The BAS-APSO algorithm is the core optimizer, with an embedded electricity pricing mechanism in the optimization process. The objective function (formulas (10)–(11)) explicitly includes electricity pricing parameters, and the algorithm actively responds to electricity pricing signals during charge and discharge optimization to achieve cost minimization.
3 Results
This study established a MOO scheduling model for microgrids and proposed BAS-APSO to solve the model. This study presents a two-part analysis. Initially, the performance characteristics of BAS-APSO are evaluated. Subsequently, the algorithm is applied to the constructed model to simulate microgrid optimization scheduling.
3.1 Performance Analysis of BAS-APSO
This study conducted experiments on the Matlab2018a simulation platform using Rosenbrock and Griebank test functions. This study is based on engineering experience of standard test function characteristics and algorithm convergence analysis for parameter setting. Set the dimension to 30 to cover typical mid to high-dimensional optimization problems (such as microgrid multi period decision-making). Set the maximum iteration count to 400 to ensure that most test functions can reach steady state. According to the principle of large sample size in statistics, 30 independent runs can stably evaluate the average performance of the algorithm, so the epoch is set to 30. Three algorithms were compared: traditional PSO algorithm, GA algorithm, and Adaptive Glowworm Swarm Optimization (AGSO), as shown in Figure 6. In Figure 6(a), when solving the Rosenbrock function, the early convergence speed of PSO was the slowest. Although GA converged faster than BAS-APSO in the early stages of iteration, its convergence speed decreased significantly when the number of iterations was around 50. BAS-APSO had a fast convergence speed throughout the entire iteration process and has not fallen into local optima. It could also iterate again at around 280 iterations to search for a better solution. In Figure 6(b), when solving the Griebank function, BAS-APSO had the fastest convergence speed and can quickly complete global optimization at around 100 iterations, obtaining a Pareto solution set that satisfies the convergence conditions. Then, it was possible to escape from local optima and find better solutions. The results indicated that the BAS-APSO had good optimization performance and fast convergence speed.
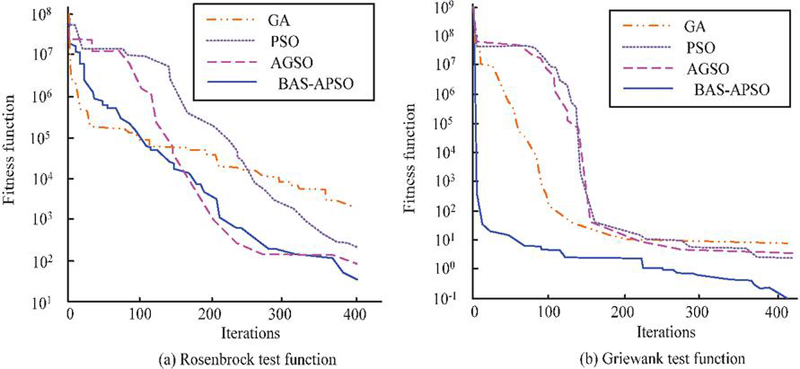
Figure 6 Comparison of convergence curves of four algorithms.
To further investigate the computational efficiency of BAS-APSO, this study compared the time taken by the four algorithms to solve the test function, as shown in Figure 7. In Figure 7, when solving the Rosenbrock and Griebank test functions, BAS-APSO took the shortest time, 0.368 s and 0.845 s, respectively. BAS-APSO had high computational efficiency while ensuring convergence performance.
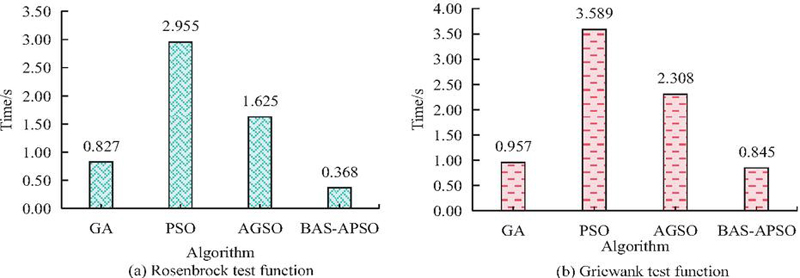
Figure 7 Comparison of solution time for four algorithms.
To further explore the optimization performance of BAS-APSO, this study took a microgrid with a daily operating fee of 1225 yuan as an example, and used the lowest operating fee as the objective function to incorporate the above four algorithms into the MOO scheduling model. The lowest operating fee obtained by the four algorithms is shown in Figure 8. In Figure 8, BAS-APSO could solve for the lowest operating fee of 1225 yuan and tended to converge at around 40 iterations. BAS-APSO could be applied to the optimization scheduling of microgrids, and had good optimization effects and high efficiency, with certain feasibility and effectiveness.
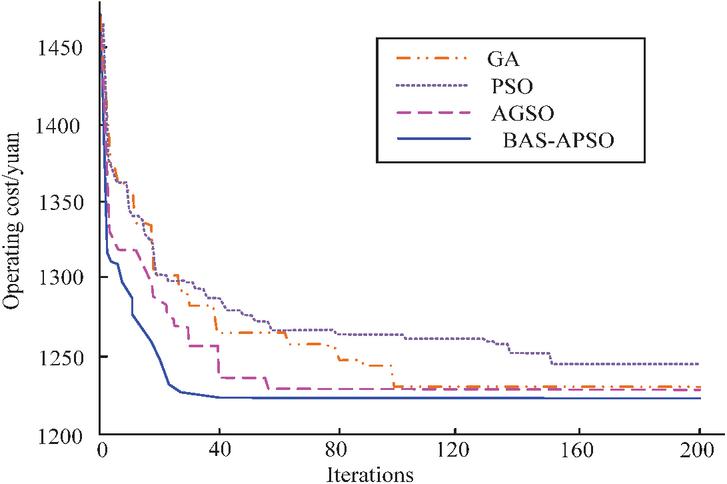
Figure 8 The lowest operating fee solved by four algorithms.
3.2 Simulation Analysis of Microgrid Optimization Scheduling
To investigate the rationality of the suggested microgrid optimization scheduling model, Matlab was used for simulation analysis. This study selected batteries as ES devices, with a minimum capacity of 5 kWh and a maximum capacity of 150 kWh. The maximum output and input power were both 30 kW, and the charge discharge rate was 90%. WPG and PVG had no pollutant emissions, while diesel engine power generation and large power grids produced sulfur dioxide, carbon dioxide, and nitrogen oxides. The treatment fee were 6 yuan/kg, 0.023 yuan/kg, and 8 yuan/kg. Table 1 illustrates the parameters of WPG and PVG.
Table 1 Parameter settings for WPG and PVG
| Parameter | WPG | PVG |
| Power upper limit/kW | 100 | 50 |
| Lower limit of power/kW | 0 | 0 |
| Service life/year | 20 | 20 |
| Loss rate/% | 9 | 7 |
| Installation fee (10000 yuan/kWh) | 0.85 | 0.65 |
| Maintenance fee (yuan/kWh) | 0.03 | 0.02 |
| Operating fee (yuan/kWh) | 0 | 0 |
To investigate the impact of the objective function and the proposed BAS-APSO on the optimization scheduling results of microgrids, this study took the actual daily operation data of a microgrid in a certain city as the initial data for simulation experiments. The optimization scheduling results of different objective functions were analyzed and compared with APSO. When it was to minimize operating fees, the optimization scheduling results of the two algorithms were presented in Figure 9. Comparing Figure 9(a) and 9(b), it can be seen that the power of the Main power grid and Diesel engine solved by the APSO algorithm is higher than that of the BAS-APSO algorithm, while the power of the Photovoltaic is lower than that of the BAS-APSO algorithm. Due to the fact that both the Main Power Grid and Diesel Engine require fuel for energy supply, their operating costs are higher than those of Photovoltaic. Therefore, under the BAS-APSO algorithm, the operating cost of microgrids is lower than that of the APSO algorithm.
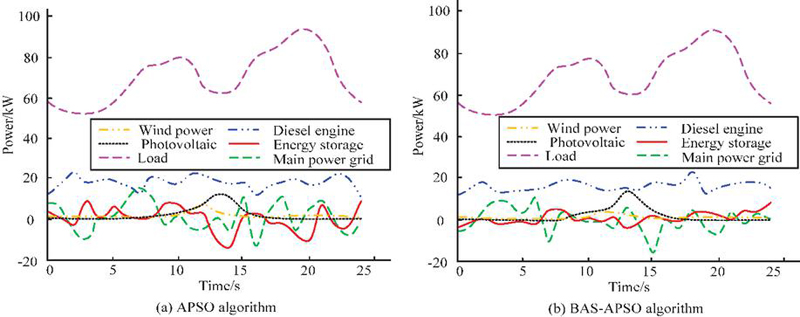
Figure 9 Optimization scheduling results at the lowest operating fee.
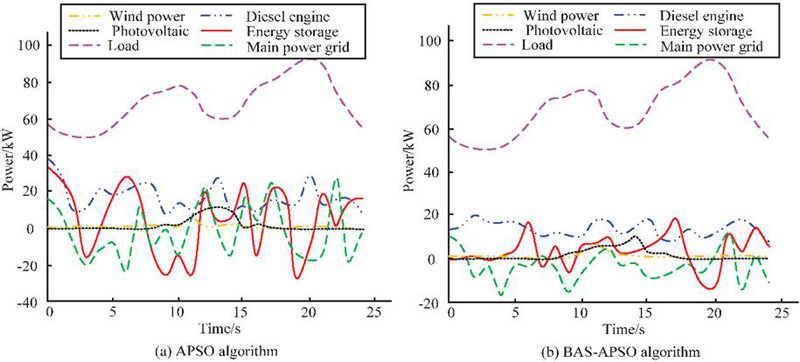
Figure 10 Optimization scheduling results at the lowest fee of environmental protection.
When it was to shorten the environmental protection’s fee, the optimization scheduling results of the two algorithms were presented in Figure 10. The Wind power and Photovoltaic power obtained by BAS-APSO algorithm are higher than those obtained by APSO algorithm, with values of 1.1 kW and 0.1 kW respectively at the 5th second. The Diesel engine, Energy storage, and Main power grid obtained by BAS-APSO algorithm are lower than those obtained by APSO algorithm. This indicates that the degree of dependence of microgrids on renewable energy under the BAS-APSO algorithm is higher than that under the APSO algorithm, resulting in lower environmental protection costs.
When it was to shorten the total fee, the optimization scheduling results of the two algorithms were shown in Figure 11. Comparing Figures 11(a) and 11(b), it can be seen that the Wind power and Photovoltaic power obtained by the BAS-APSO algorithm are higher than those obtained by the APSO algorithm, while the Diesel engine and Main power grid power are lower than those obtained by the APSO algorithm. As a result, the fuel demand is lower and the amount of pollutants generated is also lower. Therefore, the operating cost and environmental protection cost are lower than those obtained by the APSO algorithm. The results indicated that BAS-APSO could solve for lower fee optimization scheduling results in different objective functions, and had certain feasibility and effectiveness.
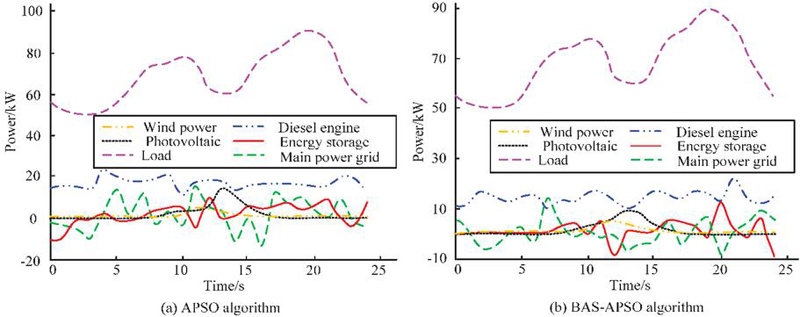
Figure 11 Optimization scheduling results at the lowest total fee.
4 Discussion and Conclusion
Aiming at the optimization scheduling problem of microgrids, a MOO scheduling model is developed, and BAS-APSO is proposed. When solving the Rosenbrock function, BAS-APSO had a fast convergence speed throughout the entire iteration process and had not fallen into local optima. It could also iterate again at around 280 iterations to search for a better solution. When solving the Griebank function, BAS-APSO had the fastest convergence speed and could quickly complete global optimization with around 100 iterations, obtaining a Pareto solution set that meets the convergence conditions. Then, it was possible to escape from local optima and find better solutions. When solving the Rosenbrock and Griebank test functions, BAS-APSO took the shortest time, 0.368 s and 0.845 s respectively. BAS-APSO could solve for the lowest operating fee of 1225 yuan and tended to converge at around 40 iterations. BAS-APSO could solve for lower fee optimization scheduling results in three different objective functions. In summary, the BAS-APSO has certain guiding significance for MOO scheduling of microgrids. But the study only analyzed the microgrid system and did not consider the impact of the external environment, which may lead to certain errors. Therefore, in future research, further exploration of the impact of external environmental factors should be conducted to reduce errors and ensure the smooth operation of microgrids.
References
[1] A. Boche, C. Foucher, L. F. Villa, ‘Understanding microgrid sustainability: A systemic and comprehensive review’, Energies, 15(8), pp. 2906–2906, Apr., 2022.
[2] D. M. Mahmud, S. M. Ahmed, S. Hasan, M. Zeyad, ‘Grid-connected microgrid: design and feasibility analysis for a local community in Bangladesh’, Clean Energy, 6(3), pp. 447–459, Jun., 2022.
[3] K. Antoniadou-Plytaria, D. Steen, O. Carlson, B. Mohandes, M. A. Ghazvini, ‘Scenario-based stochastic optimization for energy and flexibility dispatch of a microgrid’, IEEE Trans. Smart Grid, 13(5), pp. 3328–3341, May., 2022.
[4] H. Zhang, D. Yue, C. Dou, G. P. Hancke, ‘PBI based multi-objective optimization via deep reinforcement elite learning strategy for micro-grid dispatch with frequency dynamics’, IEEE Trans. Power Syst., 38(1), pp. 488–498, Mar., 2022.
[5] S. Basak, B. Dey, B. Bhattacharyya, ‘Demand side management for solving environment constrained economic dispatch of a microgrid system using hybrid MGWOSCACSA algorithm’, CAAI Trans. Intell. Technol., 7(2), pp. 256–267, 2022.
[6] S. A. Shezan, M. F. Ishraque, L. C. Paul, M. R. Sarkar, M. M. Rana, M. Uddin, M. B. Hossain, M. A. Shobug, M. I. Hossain, ‘Assortment of dispatch strategies with the optimization of an islanded hybrid microgrid’, MIST Int. J. Sci. Technol., 10(1), pp. 15–24, Jun., 2022.
[7] S. Hou, S. Fujimura, ‘Day-ahead multi-objective microgrid dispatch optimization based on demand side management via particle swarm optimization’, IEEJ Trans. Elect. Elec. Eng., 18(1), pp. 25–37, 2023.
[8] J. Wu, Q. Zhang, Y. Lu, T. Qin, J. Bai, ‘Source-load coordinated low-carbon economic dispatch of microgrid including electric vehicles’, Sustainability, 15(21), pp. 15287–15287, Oct., 2023.
[9] P. Wen, Y. Xie, L. Huo, A. Tohidi, ‘Optimal and stochastic performance of an energy hub-based microgrid consisting of a solar-powered compressed-air energy storage system and cooling storage system by modified grasshopper optimization algorithm’, Int. J. Hydrogen Energ., 47(27), pp. 13351–13370, Mar., 2022.
[10] Z. M. Ali, M. Al-Dhaifallah, T. Komikawa, ‘Optimal operation and scheduling of a multi-generation microgrid using grasshopper optimization algorithm with cost reduction’, Soft Comput., 26(18), pp. 9369–9384, Jul., 2022.
[11] Y. Zhang, P. Wang, H. Yang, Q. Cui, ‘Optimal dispatching of microgrid based on improved moth-flame optimization algorithm based on sine mapping and Gaussian mutation’, Syst. Sci. Contr. Eng., 10(1), pp. 115–125, Mar., 2022.
[12] A. E. Khalil, T. A. Boghdady, M. H. Alham, D. K. Ibrahim, ‘Enhancing the conventional controllers for load frequency control of isolated microgrids using proposed multi-objective formulation via artificial rabbits optimization algorithm’, IEEE Access, 11, pp. 3472–3493, Jan. 2023.
[13] A. Tabak, ‘Fractional order frequency proportional-integral-derivative control of microgrid consisting of renewable energy sources based on multi-objective grasshopper optimization algorithm’, Trans. Inst. Meas. Contr., 44(2), pp. 378–392, 2022.
[14] A. Rai, D. K. Das, ‘Ennoble class topper optimization algorithm based fuzzy PI-PD controller for micro-grid’, Appl. Intell., 52(6), pp. 6623–6645, 2022.
[15] G. K. Sahoo, S. Choudhury, R. S. Rathore, M. Bajaj, ‘A novel prairie dog-based meta-heuristic optimization algorithm for improved control, better transient response, and power quality enhancement of hybrid microgrids’, Sensors, 23(13), pp. 5973–5973, Jun. 2023.
[16] A. P. Arunkumar, S. Kuppusamy, S. Muthusamy, S. Pandiyan, H. Panchal, P. Nagaiyan, ‘An extensive review on energy management system for microgrids’, Energy Source Part A, 44(2), pp. 4203–4228, May., 2022.
[17] G. A. Cardenas, R. Khezri, A. Mahmoudi, S. Kahourzadeh, ‘Optimal planning of remote microgrids with multi-size split-diesel generators’, Sustainability, 14(5), pp. 2892–2892, Mar., 2022.
[18] J. M. Pedraza, ‘The role of renewable energy in the transition to green, low-carbon power generation in Asia’, Green and Low-Carbon Econ., 1(2), pp. 68–84, Apr., 2023.
[19] A. Gasparin, S. Lukovic, C. Alippi, ‘Deep learning for time series forecasting: The electric load case’, CAAI Trans. Intell. Technol., 7(1), pp. 1–25, 2022.
[20] A. Pradhan, S. K. Bisoy, A. Das, ‘A survey on PSO based meta-heuristic scheduling mechanism in cloud computing environment’, J. King Saud Univ.-Comp. Inform. Sci., 34(8), pp. 4888–4901, Sep., 2022.
[21] Z. Li, S. Li, X. Luo, ‘Using quadratic interpolated beetle antennae search to enhance robot arm calibration accuracy’, IEEE Robot. Autom. Lett., 7(4), pp. 12046–12053, Oct., 2022.
Biographies

Cheng Yang received his Master’s degree in Department of Electrical Engineering from Tsinghua University in 2013. He is currently a senior engineer at Guangdong Power Dispatching Control Center. His research interests include areas such as power system operation analysis and stability contirol.

Yang Yi received her Master’s degree in Power System Engineerting from South China University of Technology in 2008. She is currently a senior engineer at Guangdong Power Dispatching Control Center. Her research interests include areas such as power system operation analysis and scheduling optimization.

Zhennan Yang received his Master’s degree in Electrical & electronic Engineering from University of Leicester in 2016. He is currently a engineer at Guangdong Power Dispatching Control Center. His research interests include areas such as power system operation analysis and stability contirol.

Jinchang Chen received his Bachelor’s degree in Electrical Engineering and Automation from South China University of Technology in 2004. He is currently a senior engineer at Guangdong Power Dispatching Control Center. His research interests include areas such as security and stability control of power system.

Lu Miao received the B.Eng. and Ph.D. degrees from the School of Electrical and Electronic Engineering, Huazhong University of Science and Technology (HUST), Wuhan, China, in 2011 and 2016, respectively. Since 2016 until now, she is a senior engineer with Guangdong Power Dispatching Control Center. Her current research interests include stability and grid integration of renewable energy generations.
Distributed Generation & Alternative Energy Journal, Vol. 41_1, 25–50
doi: 10.13052/dgaej2156-3306.4112
© 2026 River Publishers