Inverse Calculation Analysis of Sediment Wear of Francis Turbine Based on Solid-liquid Two-phase Flow
Maohui Li1, Zhenchen Gong1, Zhenfei Gao1, Xiuying Xu1 and Xueli An2,*
1Guoneng Xinjiang Aksu Hydropower Development Co., Ltd., Aksu 842008, China
2China Institute of Water Resources and Hydropower Research, Beijing 100038, China
E-mail: an_xueli@163.com
*Corresponding Author
Received 23 March 2025; Accepted 10 April 2025
Abstract
A hydropower station is located in the western region of Xinjiang, and the river it is located on has high sediment content, high hardness, and large grain size, leading to serious abrasion of the hydropower station’s turbine. After each flood season, the lower ring and the outlet edge of the turbine blades are seriously worn through, resulting in a shortened maintenance cycle, increased operation and maintenance costs, and a decline in the safety and stability of the turbine operation. The research on the anti-abrasion technology of the hydropower station’s turbine is aimed at establishing a model to estimate the degree of turbine abrasion by sediment. On the one hand, an instrument based on dual-beam infrared scattering light inverse projection imaging technology for monitoring sediment content in the water intake before the turbine, along with a related data management platform, has been installed. This system enables real-time and automatic monitoring of sediment content in the water flowing through the turbine. On the other hand, a two-phase flow numerical simulation based on the Euler-Lagrangian framework is conducted for the entire flow channel to investigate the distribution of wear and the extent of sediment-induced wear on the turbine under varying sediment. This paper focuses on the abrasion characteristics and change of the turbine blades, upper crown clearance, and lower ring clearance at different sediment contents. The results indicate that the wear is primarily concentrated on the lower ring, the blade surfaces adjacent to the lower ring, and the turbine-side region of the lower ring clearance. Additionally, significant wear is observed in the draft tube elbow bottom, the upstream side of the conical pipe, the tongue of the draft tube, the leading edge of the guide vane, and the portion of the seat ring near the draft tube tongue. As the sediment mass flow rate increases, both the extent and the spatial distribution of wear at these locations significantly intensify. The average wear rate on the surface of the turbine blades increases approximately linearly with the sediment mass flow rate. Regarding the wear on the blade surfaces near the lower ring, it is not only associated with the high flow velocity but may also be attributed to the vortex phenomenon induced by flow separation near the blade region.
Keywords: Mixed-flow turbine, sediment wear, CFD, two-phase flow.
1 Introduction
Numerous rivers in western China carry high sediment loads [1–5], which significantly impacts the operational safety of hydropower turbines in sediment-laden rivers. Turbine flow-passing components suffer varying degrees of damage from sediment erosion, manifesting as fish-scale pits, pinholes, and honeycomb-like defects, with severe cases leading to fractures [6–8]. Existing data indicate that 40% of hydropower turbines experience sediment-induced damage. Annual energy losses due to erosion exceed 2108kWh [9–11]. Mitigating sediment erosion has become a critical challenge for hydropower units in high-sediment basins [12].
A hydropower station in western Xinjiang, located on a typical sediment-laden river, faces severe sediment erosion in its runner flow-passing components. As the core turbine component, the runner is particularly vulnerable to erosion [13]. When solid-liquid two-phase flows pass through the turbine, sediment particles impact and abrade component surfaces, causing material loss via mechanical damage and fatigue [14]. This degradation reduces unit efficiency and stability, increases maintenance frequency and workload, compromises operational quality [15], and threatens both safety and economic performance, necessitating urgent research on sediment erosion mitigation.
Researchers commonly employ numerical methods for two-phase flow simulations to study sediment erosion in turbines [16, 17]. Huang [18] conducted sand-water two-phase simulations on a Francis turbine under partial guide vane opening conditions, identifying severe erosion on guide vanes and the runner crown, with numerical results aligning with field observations. Arora [19] found that Francis turbine erosion predominantly affects runners and guide vanes, with runner blade wear concentrated near the upper crown and lower ring at the outlet edge. Sun [20], using the Tabak off erosion model, predicted severe wear in the spiral case tongue, geometrically discontinuous regions, guide vane and blade leading edges, and the draft tube elbow, with the most critical erosion occurring near the runner blade lower ring.
Liao [21] conducted wall erosion simulations in turbine flow passages under varying sediment particle sizes and volume fractions, revealing dense sediment accumulation at the leading edge of runner blades and the pressure side near the lower ring at the blade trailing edge. Ou [22] numerically demonstrated that regions with higher sediment concentration in the runner include the blade leading edge adjacent to the upper crown and lower ring, the inner surface of the lower ring, and the suction side near the lower ring at the blade trailing edge. However, existing studies lack comprehensive analysis of vulnerable components beyond the runner under high sediment loads, neglecting their critical impacts on turbine performance when severely damaged.
Therefore, this study investigates erosion characteristics of flow-passing components at the subject hydropower station, utilizing sediment concentration data from its in-situ turbine erosion monitoring platform. Through CFD numerical simulations, this study predicts sediment erosion patterns and severity on critical hydraulic components under specific operating conditions. The simulated erosion distribution is then compared with field observations to validate the reliability of the CFD model for quantitative erosion analysis. Key analysis targets include: 1. Erosion at the runner lower ring, lower ring-side blade surfaces, and lower ring clearance; 2. Wear patterns in the draft tube elbow bottom, upstream-side cone section, spiral case tongue, guide vane leading edges, and stay vane regions near the tongue
2 Calculation Setting
2.1 Geometric Model
Taking the runner of a certain hydropower station as the research object, the three-dimensional model of the Francis turbine is shown in Figure 1. The turbine model consists of the following components: spiral casing, 13 stay vanes, runner with 14 blades, 16 guide vanes, and draft tube. Meshing was performed for the internal flow passage of the turbine. The boundary layer region adopted 10 layers of hexahedral prism mesh, while the main flow domain employed polyhedral mesh. The grid independence verification is presented in Table 1, with the total number of grids ultimately determined as 21,158,667. Specifically, the runner domain contains 7,295,629 mesh elements, as illustrated in Figure 2.
The verification design condition was selected as Qd 5.85 m/s, with predicted head as the evaluation metric. The relative error is defined as Equation (1):
| (1) |
Where, H is test head, H is calculated water head.
A smaller relative error indicates lower grid-induced numerical uncertainty. The computational mesh is considered validated when r 1%.
Table 1 Grid independence verification
| Grid Quantity | H/m | r/% |
| 1294986 | 102.1 | 2.1 |
| 4126559 | 102.0 | 2 |
| 7295629 | 100.9 | 0.9 |
| 10156541 | 101.5 | 1.5 |
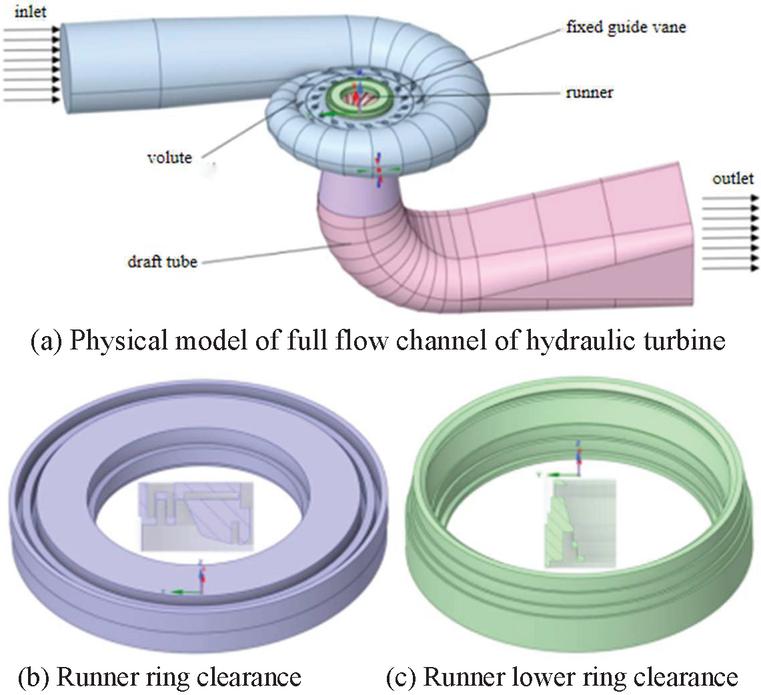
Figure 1 Hydraulic turbine computational model.
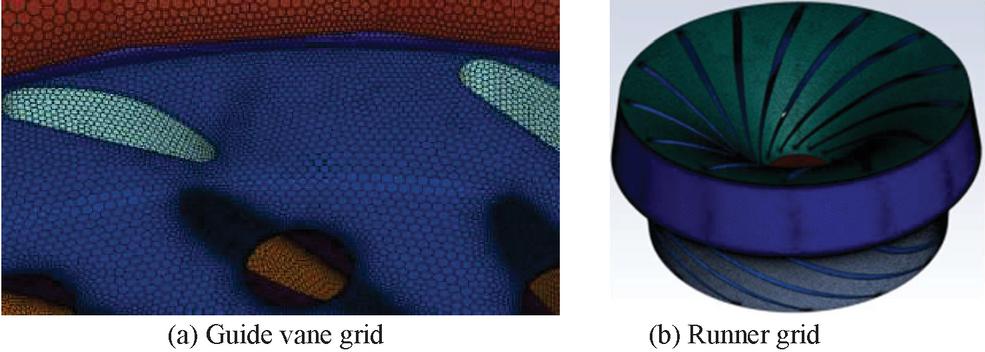
Figure 2 Grid discretization.
2.2 Model Settings
Numerical simulation boundary conditions were determined based on the flow characteristics of sediment-laden water under the hydropower station’s design operating conditions. Unsteady wear simulation calculations were conducted at the rated operating condition with varying sediment mass flow rates. The SST k- turbulence model was employed to close the Navier-Stokes equations, while the Discrete Phase Model (DPM) based on Lagrangian description simulated sand particle motion, considering particle-fluid interactions including drag force and pressure gradient force [23]. The Generic erosion model was adopted with impact angle functions defined by polynomial expressions. All walls used rebound models where tangential and normal restitution coefficients followed polynomial functions of particle impact angles. The runner’s rotation at rated speed 600 r/min was simulated using the Mesh Motion method, with all internal walls set as rotating surfaces. Transient calculations used a timestep of 0.000278 s (equivalent to 1-degree rotor rotation), simulating 15 full revolutions. Pressure inlet/outlet boundary conditions were applied, with sand particles injected at the spiral case inlet and escaping through the draft tube outlet. Sand density was set to 2650 kg/m with particle size distribution matching field-measured reservoir sediments. Particles were treated as inert mass points, with injection velocities matching steady-state water flow velocities at the inlet. Particle tracking duration exceeded computational time to ensure complete trajectory resolution.
2.3 Model Equation
The governing equations describe fluid flow consist of the continuity equation, momentum equations (Navier-Stokes equations), and energy equation. Given that the internal flow within hydraulic turbines can be reasonably approximated as isothermal, only the continuity equation and momentum equation are required. The Eulerian formulations of these equations are expressed as Equations (2)(3).
| (2) | |
| (3) |
Where, is density of liquid; is time; u is instantaneous speed; p is pressure; is tensor of stress SM is Added momentum due to solid phase action. By applying time-averaging to decompose all instantaneous variables into the linear superposition of time-averaged and fluctuating components, the Reynolds-averaged equations for incompressible flow are derived as Equations (4)(5).
| (4) | |
| (5) |
Where, is time mean velocity; is average time pressure; is the dynamic viscosity coefficient; is Reynolds stress tensor. The Reynolds time mean equations have the Reynolds stress second order moment term. In order to make the equations closed, it is necessary to introduce the turbulence Equations (6)(2.3).
| (6) | ||
| (7) |
Where, is the turbulent kinetic energy; is the average value of turbulent velocity; is the coordinate component; is turbulence generation term; ; is the specific dissipation rate; In formula (2.3), the first term on the right is the ac diffusion term.
For the numerical simulation of sediment wear in hydraulic turbine, it is necessary to describe the flow characteristics and interaction of multiphase fluid through the multiphase flow model. For the numerical simulation method based on N-S equation, the multiphase flow model mainly includes the Euler-Euler frame and the Euler-Lagrange frame. The discrete phase model under the Euler-Lagrange framework regards water as a continuous phase and solid phase as a particle with discrete distribution. The continuous phase uses Euler’s method to solve the N-S equation to obtain the relevant flow field parameters, and the discrete phase uses Lagrange method to solve the particle motion equation to obtain the trajectory and distribution, considering the two-way coupling effect when the discrete phase and the continuous phase interact. And unidirectional coupling when only the interaction of the continuous relative discrete phase is considered.
The commonly used methods under Euler-Lagrange framework include Discrete Phase Model (DPM), Dense Discrete Phase Model (DDPM) and Discrete Element Model (DEM). The DPM model requires the discrete phase volume content to be less than 10%.
In this calculation, the DPM model is chosen as the multiphase flow model of sand-water two-phase. Since the main feature of sand particles in water flow is the interaction between sand particles and water, it is weak in the solid-liquid two-phase flow with small concentration. So the interaction between sand particles is ignored. The discrete phase motion trajectory is obtained by calculating the force balance equation of the particles, which can be described by Newton’s second law of particle motion behavior. If the shape of the particles is assumed to be spherical, its governing equation is as follows Equations (8)(11).
| (8) | |
| (9) | |
| (10) | |
| (11) |
Where, Subscript P is the parameter of the particle; mp is particle mass; u is particle Velocity; F is drag force; F is the buoyancy; F is the virtual mass force; F is the pressure gradient force; F is Coriolis force and centrifugal force existing in the rotating system; F is Magnus lift force; F is Staffman lift force; F is Basset force. Re is Reynolds number.
Wall wear analysis is to predict the parameters of wall particles after the calculation of solid-liquid two phase flow. The Generic sediment model is adopted in this calculation, and the calculation expression is as Equation (11):
| (12) | |
| (13) |
Where, is wear rate; is the mass loss of wall material per unit time in per unit area; is the function of particle diameter; is the impact Angle between. is the impact angle function.
2.4 Basic Parameters of the Working Condition
Based on the on-site conditions of the water turbine, the measured particle sizes of sand and gravel, and the sediment mass flow rate, the basic parameters of the obtained calculation model are shown in Table 2.
Table 2 Basic parameters of hydro turbine
| Units | ||
| Runner diameter | 1.8 | m |
| Calculate RPM | 600 | r/min |
| Calculate flow | 5.85 | m/s |
| Number of blades | 14 | |
| Particle size | 0.5 | mm |
| Sediment mass flow | 10,50,120,200 | kg/s |
3 Result Analysis
3.1 Flow Field Analysis
The flow field characteristics in the high-section region between the volute and guide vane domains are presented in Figure 3. It is observed that the overall pressure distribution within the volute and guide vane remains consistent under sediment mass flow rates of 10 kg/s and 200 kg/s. Elevated pressure levels are detected at the volute inlet and its outer periphery, whereas reduced pressures are recorded on the back surface of the active guide vane and adjacent to the runner. Excluding wall-adjacent flows and boundary layer phenomena, the velocity distribution demonstrates an inverse correlation with the pressure distribution, exhibiting a gradual velocity increase from external to internal regions. Notably, localized pressure variations at the volute nose end are attributed to sediment accumulation effects, which may induce vortex formation and enhance local turbulent kinetic energy, thereby suggesting potential increases in energy dissipation. Figures 3(c)3(h) illustrate the wall pressure distributions in the volute and guide vane domains. The data indicates that sediment mass flow rate variations exert negligible influence on wall pressure distribution patterns. Distinct pressure gradients are observed, with localized high-pressure zones concentrated at the leading edges of both fixed and active guide vanes, and low-pressure regions are observed to develop at the trailing edge of the fixed guide vane opposite its leading edge, as well as along the mid-chord and trailing sections of the active guide vane.
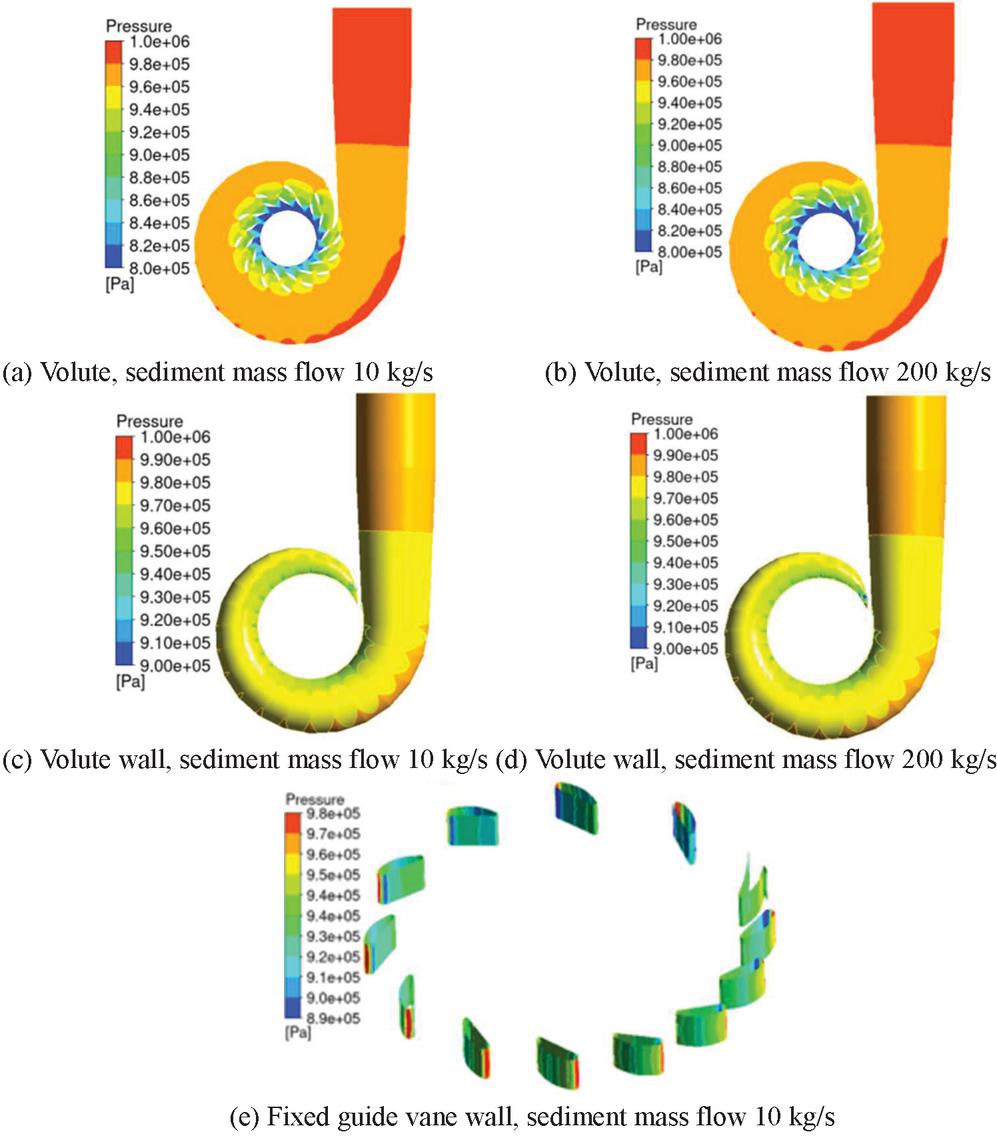
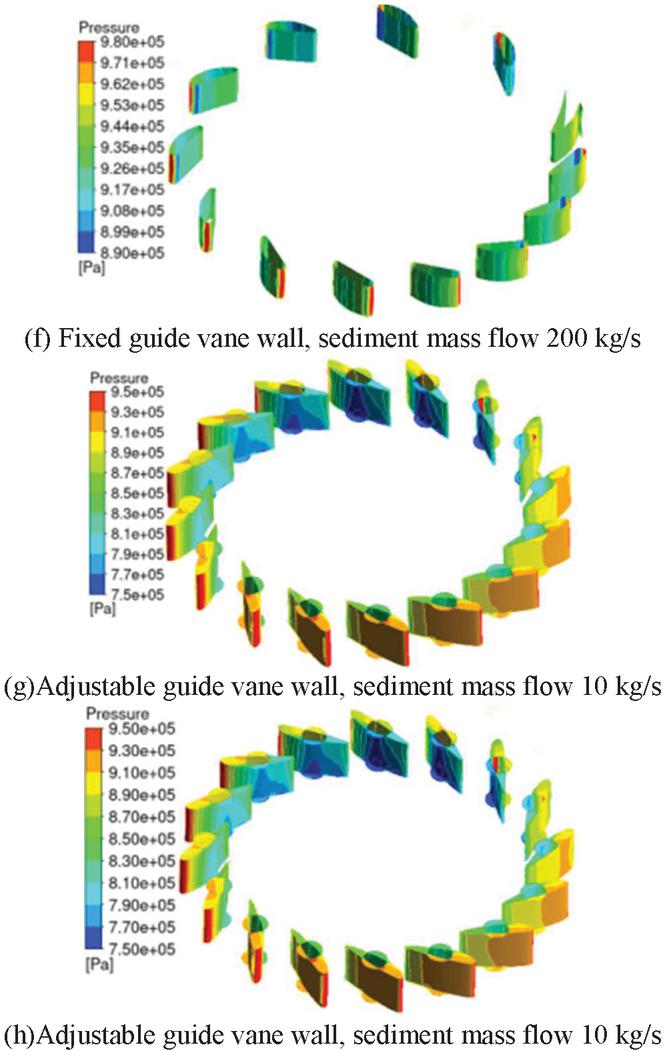
Figure 3 Pressure distribution of the main flow-passing components.
The flow field characteristics within the crown and lower ring clearances are illustrated in Figure 4. Analysis reveals that sediment mass flow rate variations exert significant influence on the wall pressure distribution patterns within these clearances. The observed alternating high-pressure and low-pressure zones along the clearance paths can be attributed to the non-uniform pressure distribution emanating from the guide vane outlet, which is consistent with the pressure gradient effects described in the Reynolds-averaged Navier-Stokes equations.
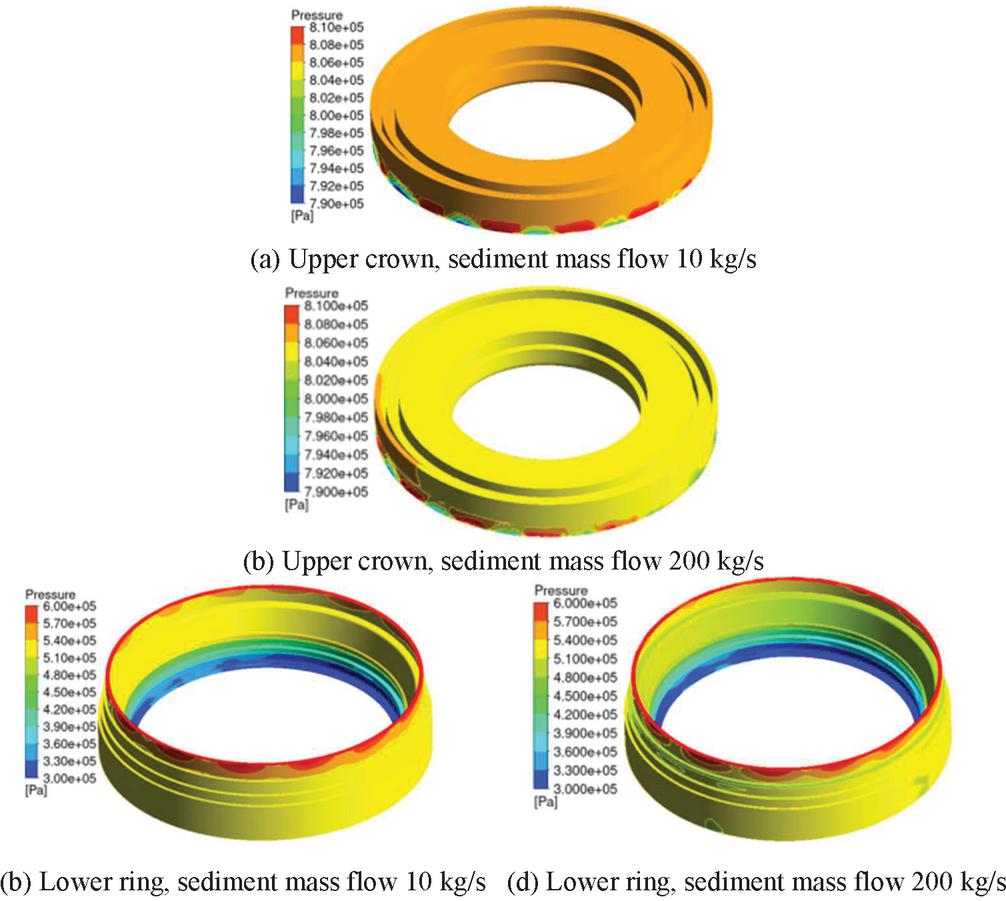
Figure 4 Pressure distribution between the upper crown and the lower ring.
The runner flow field characteristics are presented in Figure 5. Computational analysis demonstrates that sediment mass flow rate variations exhibit negligible influence on the pressure and velocity fields within the runner domain. However, circumferential pressure asymmetry manifests on the runner wall surfaces, primarily induced by asymmetric circulation effects originating from the volute discharge. Under rated operating conditions, localized adverse pressure gradients develop along the blade suction surfaces, inducing minor flow separation and blade passage vortex formation. Notably, sediment mass flow variations significantly affect draft tube wall pressures, with empirical correlations suggesting that increased sediment concentration may amplify pressure depression in the draft tube conical section, potentially exacerbating cavitation inception risks.
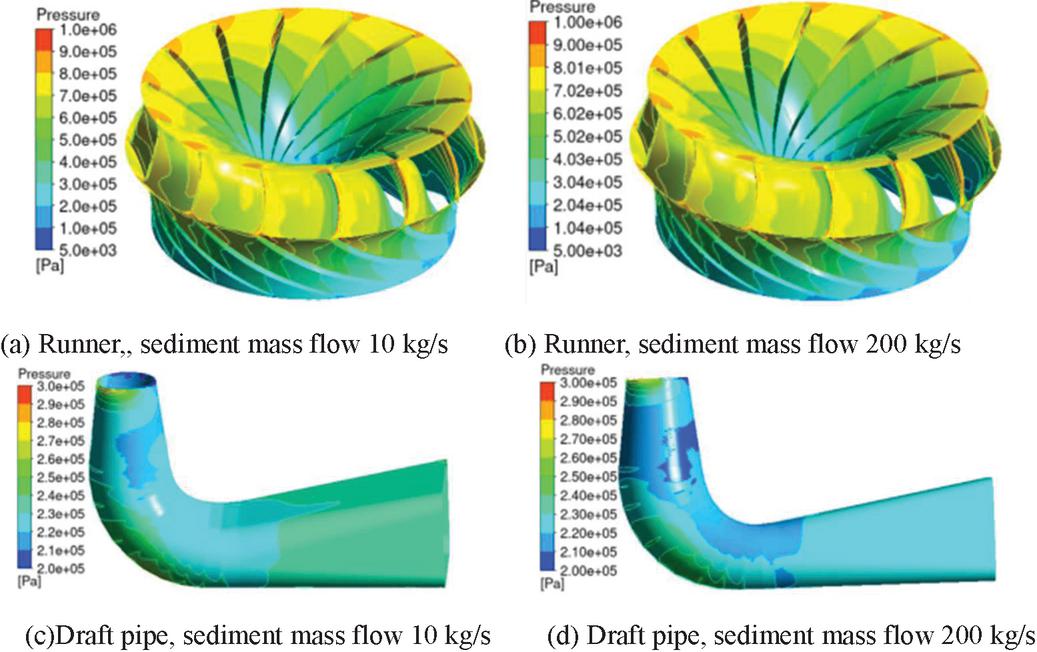
Figure 5 Pressure distribution at the draft tube and draft tube runner section.
3.2 Wear Characteristics Analysis
The wall wear distribution patterns under different sediment mass flow rates are illustrated in Figure 6. Analysis reveals concentrated wear zones at the volute nose end and lower quadrant section, with wear severity intensifying significantly with increasing sediment mass flow rates. Fixed guide vanes exhibit predominant wear at their leading edges and nose-end adjacent surfaces, showing progressive wear development as sediment loading increases. Adjustable guide vanes demonstrate primary wear concentration at leading edges and clearance regions near the volute nose, with both wear magnitude and spatial extent expanding proportionally to sediment flux. The draft tube displays characteristic wear patterns in its conical section, elbow outer curvature, and diffuser base, where both wear intensity and affected area exhibit positive correlations with sediment mass flow rate increments.
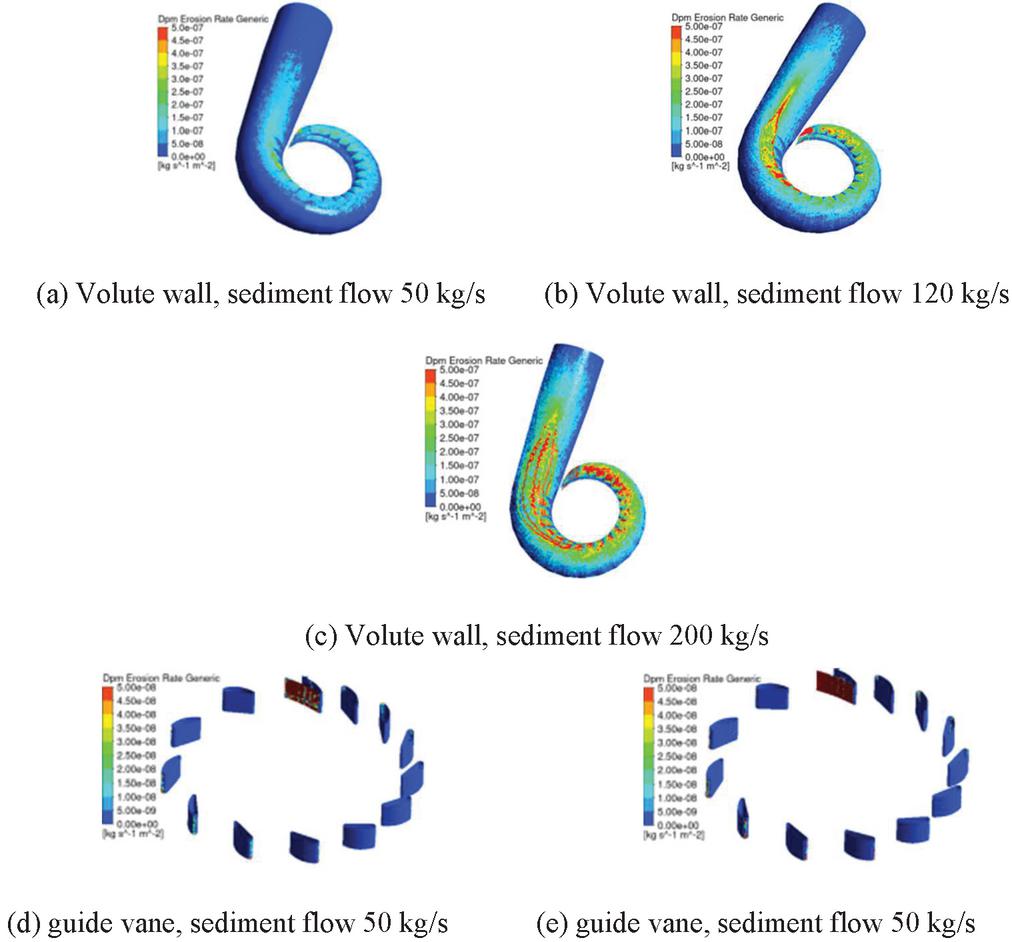
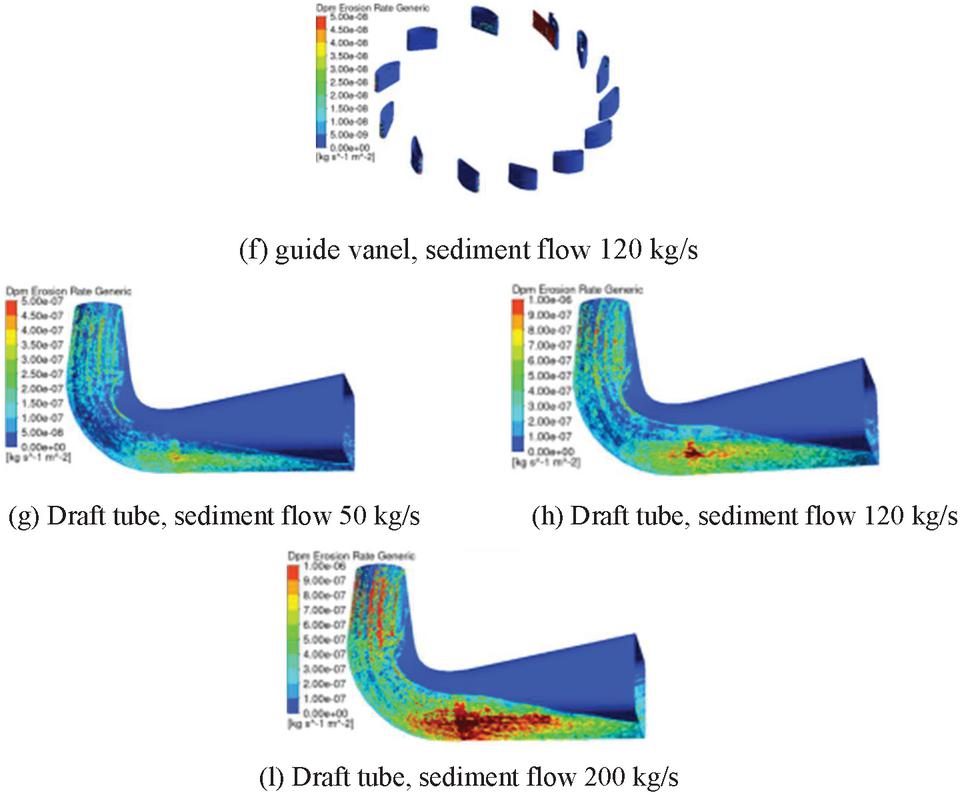
Figure 6 The Distribution of wear rates of the main flow components’ surfaces.
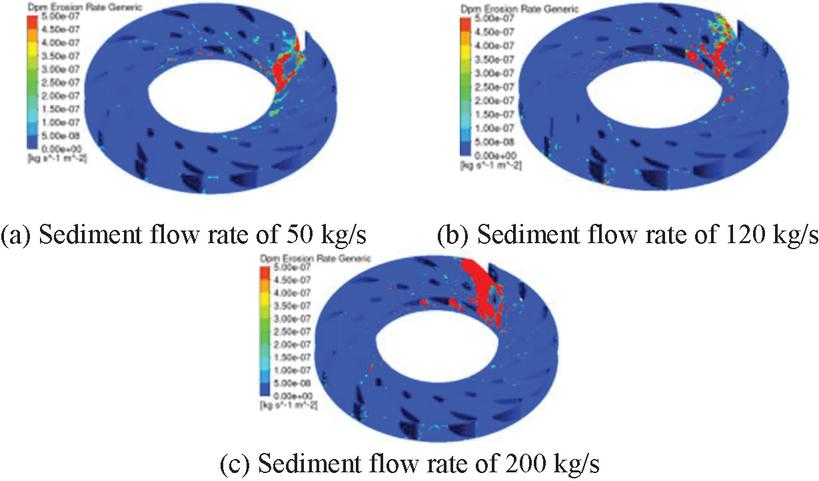
Figure 7 Distribution of wear rate at the blade end face.
The end-face wear rate distribution patterns of guide vanes under varying sediment mass flow rates are presented in Figure 7. The analysis reveals that wear damage is predominantly localized near the volute nose-end fixed guide vanes, exhibiting severe wear characteristics. Both the wear intensity and affected area demonstrate marked intensification with progressive increases in sediment mass flow rates.
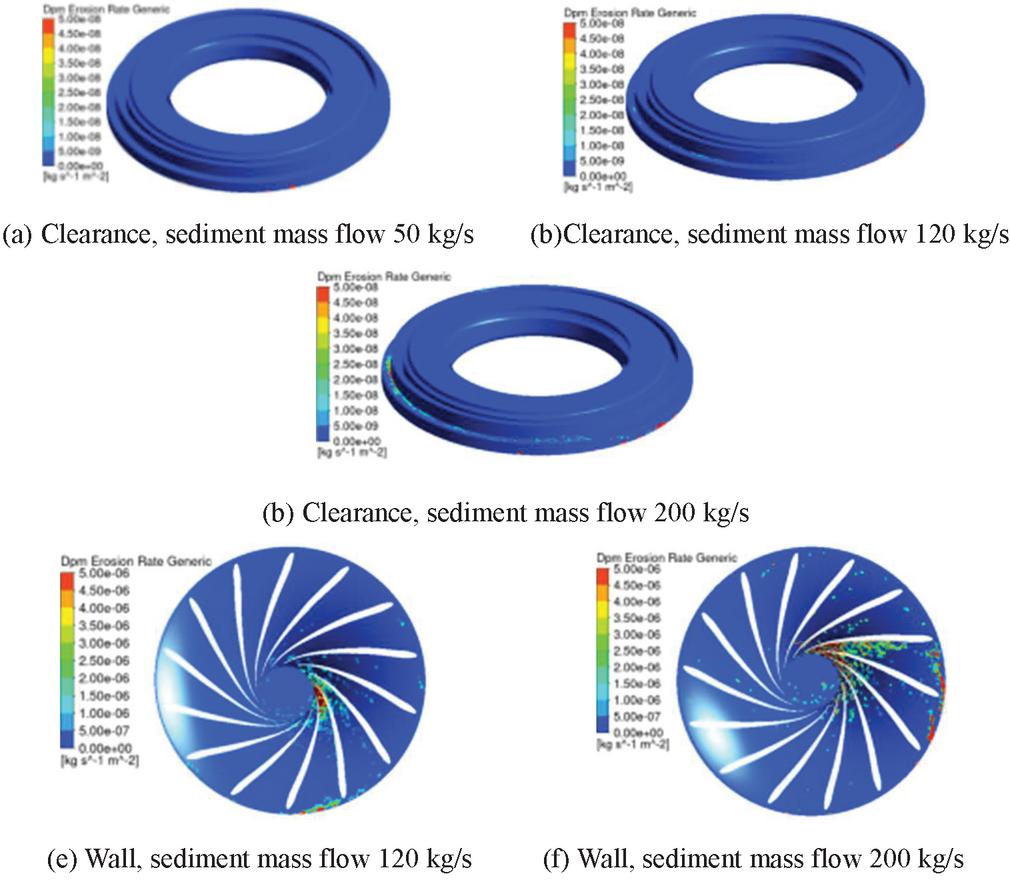
Figure 8 Distribution of wear rates at the upper crown section.
The runner-side wear patterns in crown and lower ring clearances under varying sediment mass flow rates are comparatively illustrated in Figures 8–9. In the crown clearance, primary wear concentration occurs at the inlet edge of the narrow clearance section, with secondary wear development observed in the first-stage labyrinth seal clearance. Comparative analysis reveals more severe wear patterns on the runner-side surface of lower ring clearance, predominantly distributed along the horizontal ring near the draft tube and the narrow clearance section. Notably, significant computational wear predictions appear on the stationary guide-vane-side surface of lower ring clearance, though the model does not account for sediment retention or blockage effects that would mitigate actual operational wear (as evidenced in Figure 10 field observations). The current computational approach likely underestimates sediment erosion effects on runner-side surfaces of both clearance types.
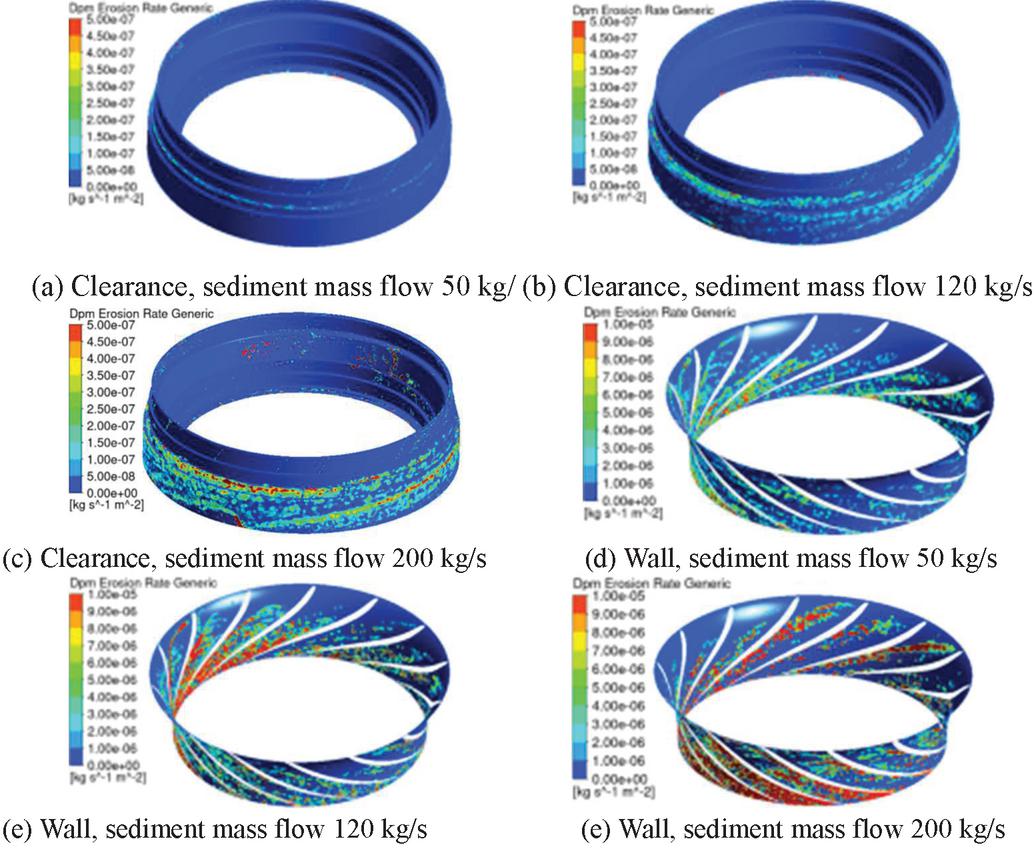
Figure 9 Distribution of wear rate at the lower ring section.
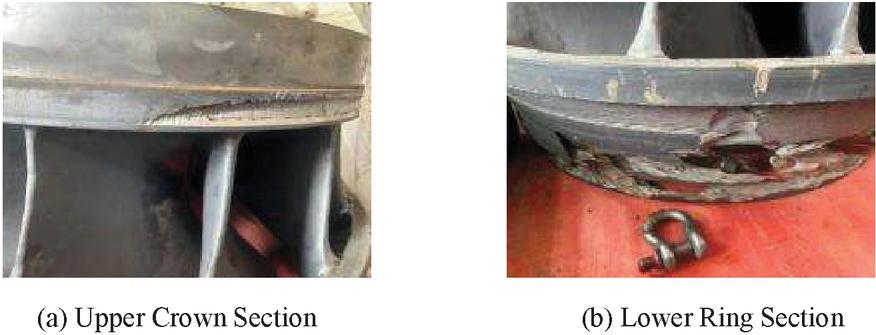
Figure 10 Wear of crown and ring gap on actual turbine blades.
The spatial progression of runner wear characteristics under varying sediment mass flow rates is comprehensively illustrated in Figure 11. Analysis identifies three primary wear concentration zones: the lower band surface, pressure side trailing edge regions adjacent to both crown and lower band interfaces, and the crown-discharge cone junction. The lower band exhibits maximum wear severity, with both wear intensity and spatial distribution demonstrating progressive expansion as sediment loading intensifies. Field operational evidence presented in Figure 12 confirms satisfactory alignment with computational predictions, validating the numerical model’s capability in capturing critical wear progression patterns.
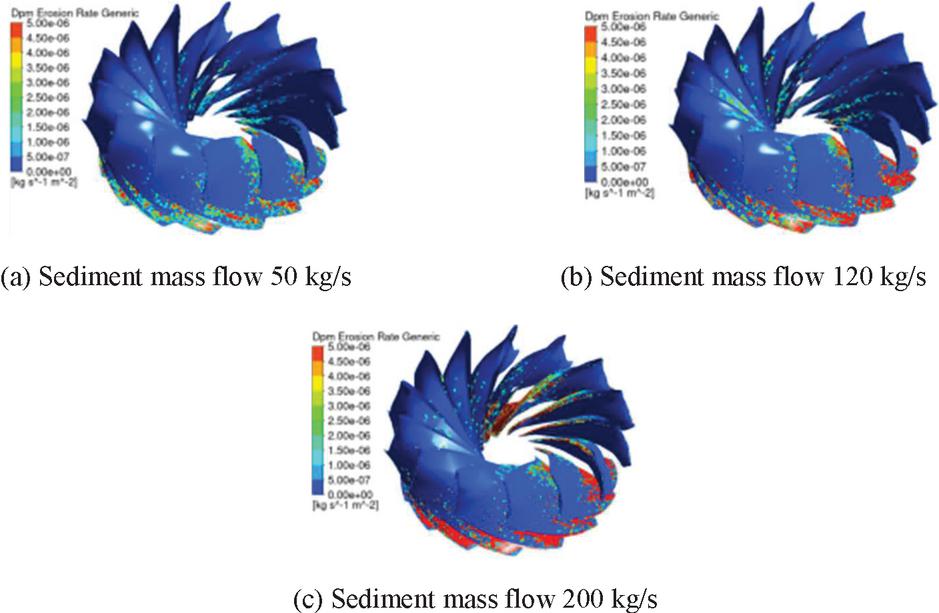
Figure 11 Distribution of wear rate on the blade surface of a turbine wheel.
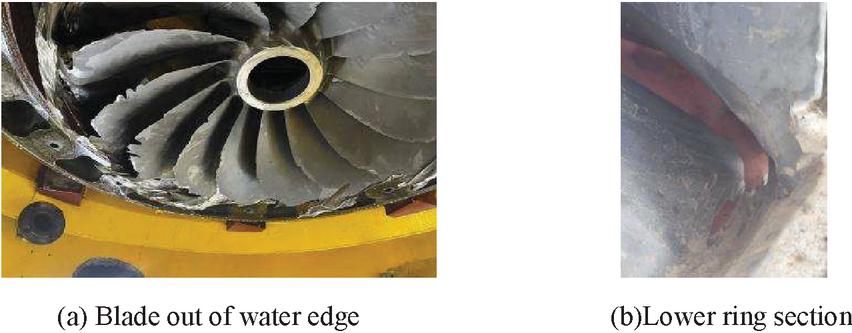
Figure 12 Wear of crown and ring gap on actual turbine blades.
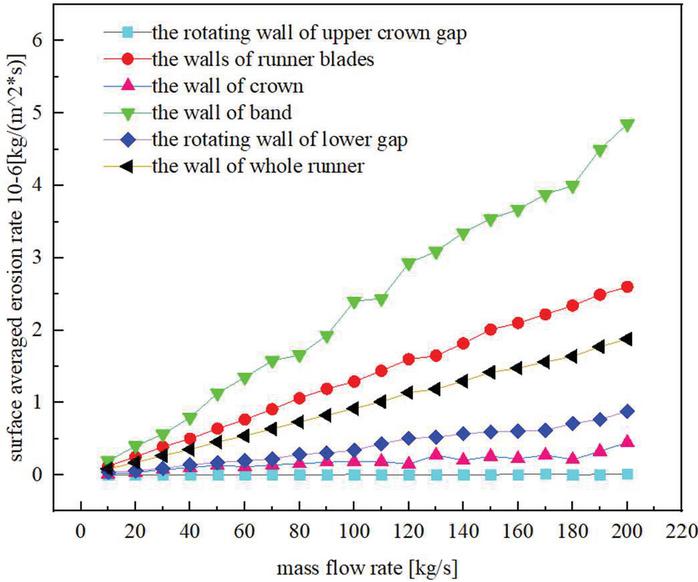
Figure 13 The wear rate of the turbine blade surface changes.

Figure 14 The wear rate of the tailwater pipe wall changes.
Component-specific analysis reveals the following descending order of wear severity at equivalent sediment loading: lower band runner blades lower ring clearance runner-side crown crown clearance runner-side. The result is as shown in the Figure 13. The runner blade surface-averaged wear rates exhibit near-linear proportionality to sediment mass flow increments. The wear rate of the tailwater pipe wall changes is as shown in the Figure 14. Both draft tube and runner demonstrate proportional wear rate escalation with increased sediment flux, with the lower band displaying the most pronounced escalation rate.
4 Conclusion
Optimized Translation: Through integrated computational and field investigations, three principal conclusions can be drawn:
(1) Sediment mass flow variations exert significant influence on wall pressure distributions within both crown and lower ring clearances. Concurrently, elevated sediment concentrations induce localized pressure depression in the draft tube conical section, particularly under high-load operating conditions.
(2) Progressive intensification of sediment erosion correlates positively with increased mass flow rates, with the lower band exhibiting the most severe wear patterns – a phenomenon consistently observed in field inspections of damaged hydraulic components.
(3) The established near-linear proportionality between sediment flux and mean wear rates of primary flow-passing components enables operational lifespan estimation through extrapolation of current computational data, providing critical maintenance intervals for different service conditions.
Acknowledgment
This work was supported by the Xinjiang Company Aksu Hydropower Kumalak River and Tailan River Hydropower Station Sediment Comprehensive Management Technology Research Project (AKS2023005/QT245) and the IWHR Research & Development Support Program (TJ0145B022021).
References
[1] X. Liu, Y. Zeng, H. Hua, et al. ‘Study on wear of turbine blade leaf of Shuzicui hydroelectric turbine due to sediment abrasion[J]’. Journal of Xihua University (Natural Science Edition), 2020, 39(05):67–73.
[2] L. Xu, L. Cao, L. D. Liu, et al. ‘Comprehensive stability analysis of complex hydropower system under flexible operating conditions based on a fast stability domain solving method[J]’, Energy, 2023, 274: 127368.
[3] R. Nagaraj, D. Murthy and M. Rajput. ‘Modeling renewables based hybrid power system with desalination plant load using neural networks[J]’. Distributed Generation & Alternative Energy Journal, 2019, 34(1), 32–46.
[4] Z. Qian, Q. Zhong, X. Zeng, et al. ‘Optimization design of anti-sand wear blades for Francis turbine[J]’. Journal of Hydraulic Engineering, 1–12.
[5] Z. Zhang, S. Yang, Y. Peng. ‘Analysis and prediction of sedimentation status of Karabeyli reservoir in Xinjiang: current situation and future prospects[J]’. Journal of China Institute of Water Resources and Hydropower Research, 2024, 22(04): 377–386.
[6] L. Lu, L. Pan, Z. Peng, et al. ‘Construction and application of the research and development platform for hydraulic machinery[J]’. Journal of China Institute of Water Resources and Hydropower Research, 2019, 17(06): 432–438 445.
[7] J. Huang, L. Zhang, Y. Ji, et al. ‘Numerical simulation of two-phase turbulent flow field in hydro turbine wearing by sand[J]’. Journal of Irrigation and Drainage Mechanical Engineering, 2016, 34(02): 145–150.
[8] M. Manas. ‘Optimization of distributed generation based hybrid renewable energy system for a DC Micro-Grid using particle swarm optimization[J]’. Distributed Generation & Alternative Energy Journal, 2018, 33(4), 7–25.
[9] L. Lu, Z. Peng, X. Wang, et al. ‘Development of hydraulic machinery research field[J]’. Journal of China Institute of Water Resources and Hydropower Science and Engineering, 2018, 16(5): 442–450.
[10] L. Lu, Z. Gao, L. Pan, et al. ‘Development and review of hydraulic and electromechanical research field in the past 50 years[J]’. Journal of China Institute of Water Resources and Hydropower Science and Engineering, 2008, (4):100–110.
[11] R. Zhang. ‘Study on sediment wear of turbine guide vanes based on CFD[J]’. Yunnan Hydropower, 2023, 39(01): 224–227.
[12] X. Ge, J. Su, Y. Li, et al. ‘Numerical simulation of sediment wear characteristics of the jet mechanism of impulse turbine[J]’. Journal of Hydraulic Engineering, 2020, 51(12): 1486–1494.
[13] G. Yang. ‘Discussion on the measures and approaches to reduce wear and corrosion of hydro turbine by sediment[J]’. Small Hydropower, 2021, (2): 63–65.
[14] L. Li. ‘Numerical simulation and wear prediction of two-phase flow in mixed-flow turbine and its application[D]’. Xihua University, 2015.
[15] X. Luo, Z. Ge, G. Zhu, et al. ‘Technological advances and trends in impact hydro turbines[J]’. Journal of Hydropower Engineering, 2023, 42(02): 116–134.
[16] X. Ge, J. Sun, J. Cai, et al. ‘Study on the impact of erosion on the water-catching profile and performance of water-wheel turbine[J]’. Proceedings of the CSEE, 2021, 41(21): 7391–7403.
[17] G. Zhang, X. Wei. ‘Numerical analysis of the influence of sediment concentration and particle size on the internal flow of a hydro turbine wheel[J]’. Journal of Agricultural Engineering, 2014, 30(23): 94–100+340.
[18] A. Naman, K. Arun, S. Sunil. ‘Technological advancement in measurements of suspended sediment and hydraulic turbine erosion[J]’. Measurement, 2022, 190.
[19] J. Huang, L. Zhang, J. Yao, et al. ‘Numerical simulation of two-phase turbulent flow field in hydraulic turbine wear by sand[J]’. Journal of Irrigation and Drainage Mechanical Engineering, 2016, 34(02): 145–150.
[20] G. Sun, Y. Zhang, R. Zhang, et al. ‘Numerical prediction and analysis of abrasion of mixed flow turbine in high sediment water flow[J]’. Journal of Drainage and Irrigation Mechanical Engineering, 2022, 40(12): 1197–1203+1226.
[21] J. Liao, X. Lai, X. Zhang. ‘The impact of sediment diameter and concentration on the internal flow field of a mixed-flow turbine runner[J]’. Journal of Hydropower Engineering, 2017, 36(05): 88–94.
[22] S. Ou, X. Liu, Y. Zeng, et al. ‘Numerical analysis of sediment concentration inside hydro turbine runner[J]’. Hydroelectric Power, 2014, 40(07): 67–70.
[23] X. Si, Z. Yong, L. Xiao. ‘Simulation and experimental study of sediment wear on fixed guide vanes of a certain type of hydroturbine based on DPM model[J]’. Hydroelectric Power, 2021, 47(6): 80–83.
Biographies

Maohui Li holds a bachelor’s degree and is an engineer. He currently serves as the Director of the Equipment Maintenance Department of Guoneng Xinjiang Aksu Hydropower Development Co., Ltd. He started working in 2011 and is mainly engaged in the maintenance and management of hydropower.

Zhenchen Gong is currently working as a director of Chn Energy Xinjiang Aksu Hydropower Development Co., Ltd., is mainly engaged in hydropower and new energy technology management research.

Zhenfei Gao is a Technical Specialist in National Energy Group Xinjiang Aksu Hydroelectric Development Co., Ltd. (China). He joined the company in 2018 and specializes in technical management research of hydropower and renewable energy systems, with extensive experience in integrated energy project operation and management in northwest China.

Xiuying Xu graduated from Sichuan Electric Power Technical College in the major of Relay Protection and Its Automation in 2010. Since 2010, she has been working at Guoneng Xinjiang Aksu Hydropower Development Co., Ltd. Her main research directions include technical supervision management technology research, intelligent power station operation management research and other related topics.

Xueli An received PhD degree from School of Hydropower and Information Engineering, Huazhong University of Science and Technology, Wuhan, China, in 2009. Now he works at China Institute of Water Resources and Hydropower Research. His current research interests include condition monitoring and fault diagnosis.
Distributed Generation & Alternative Energy Journal, Vol. 40_3, 481–504.
doi: 10.13052/dgaej2156-3306.4032
© 2025 River Publishers