Voltage Coordinated Control Strategy for Distribution Networks Based on Multi-Time Scale Sequential Action Control
Yuze Fu1, Zhenxu Ma2, Wei Wang1, Zhuohong Yao1, Ruifeng Li2,* and Dongbo Guo3
1Jilin Province Electric Science Research Institute Co., Ltd, Changchun, Jilin, 130000, China
2School of Electrical Engineering, Northeast Electric Power University, Jilin, Jilin, 132012, China
3Tsinghua University, Beijing, 100084, China
E-mail: 17643208037@163.com
*Corresponding Author
Received 07 April 2025; Accepted 14 May 2025
Abstract
In response to the current issues of high penetration of renewable energy sources and excessively complex loads, this paper proposes an effective coordinated control strategy combining different time response scale sequential action control in low-voltage distribution networks. Initially, the paper analyzes controllable voltage regulation devices with varying response time scales, followed by the proposition of a strategy for coordinated control involving multiple controllable voltage regulation devices. Finally, through simulations conducted in MATLAB/SIMULINK on an improved IEEE 33-node system and an actual low-voltage distribution system in a city in Zhejiang province, the following outcomes were observed: in the enhanced IEEE 33-node system, the voltage deviation rate decreased to 3%, with a voltage compliance rate increasing to 95.07%; in the actual low-voltage distribution system in Zhejiang city, the voltage deviation rate decreased to 1.7%, with a voltage compliance rate rising to 99.04%. This approach effectively addresses voltage limit issues and complex load concerns post renewable energy integration, providing assurance for the safe and stable operation of low-voltage distribution networks.
Keywords: High penetration of new energy sources, low-voltage distribution network, time response scale, controllable voltage regulation devices.
1 Introduction
Currently, the key terms in China’s energy development remain clean, low-carbon, and safe and efficient. In the “14th Five-Year Plan for Modern Energy System Planning,” it is proposed to comprehensively accelerate the evolution and restructuring of the energy system to address the challenges of the global energy industry system. The “Carbon Peak Action Plan by 2030” suggests optimizing the energy structure, developing green industries, increasing the proportion of non-fossil energy in primary energy consumption, reducing the proportion of coal consumption, and promoting the transition of the energy structure towards clean and low-carbon directions. Specific measures include increasing the development and utilization of renewable energy sources such as wind and solar energy, enhancing nuclear energy safety levels, and gradually phasing out outdated production capacity. Therefore, ensuring the safe and reliable operation of new energy sources like photovoltaics in low-voltage distribution networks is of great significance.
However, with the large-scale grid integration of renewable energy, the increase in the penetration rate of renewable energy, and the rapid growth of new types of loads, low-voltage distribution networks face severe challenges. Voltage limit violations and significant fluctuations have become issues that distribution networks have to confront. The Hybrid Distribution Transformer (HDT), as a combination of traditional distribution transformers and power electronic devices, integrates the advantages of both, enhancing the reliability, flexibility, and efficiency of distribution networks. However, the economic feasibility of HDT poses a challenge. Hence, it is essential to operate in coordination with traditional voltage regulation devices to achieve the safe and stable operation of distribution networks across multiple time scales.
Domestic and international research on voltage regulation in distribution networks has long been underway. Reference [1] proposed a rule-based tap changer control strategy that comprehensively considers the voltage conditions of different feeders, thereby avoiding unnecessary tap operations. However, due to the mechanical structures of On-Load Tap Changers (OLTC) and Circuit Breakers (CB), they cannot adjust the voltage flexibly and effectively. Reference [2] introduced a coordinated control strategy involving a battery energy storage system and an On-Load Tap Changer (OLTC) to ensure acceptable voltage magnitudes in distribution feeders. This strategy reduces deviations between voltage and its desired value, minimizes tap changes, and extends battery life. Nevertheless, due to the mechanical structures of OLTC and CB, they cannot flexibly and effectively regulate voltage. Furthermore, due to the physical and capacity limitations of batteries themselves, they are unable to cope with the severe fluctuations in photovoltaic generation.
Reference [3] applies Hybrid Distribution Transformers (HDT) to active distribution network voltage and reactive power optimization, achieving dynamic adjustment of reactive power in the distribution network to enhance power quality. However, it does not address the coordination issues of multiple controllable devices in the distribution network. References [4–6] propose that the topology of power electronic transformers can achieve controllable power transmission objectives while providing convenient interfaces for distributed energy sources and DC loads.
Reference [7] presents an adaptive switching strategy for the operation mode of AC/DC hybrid microgrids based on power electronic transformers, ensuring the supply reliability of the microgrid. However, power electronic transformers are expensive and face reliability issues. Reference [8] introduces a voltage coordination control method for offshore wind farms, utilizing reactive power compensation through offshore wind farms, Static Var Generators (SVG) systems, and energy storage devices. Reference [9] proposes a voltage control strategy for distribution networks based on coordinated control of reactive power output from photovoltaic inverters and SVG, maximizing the participation of photovoltaic power plants in reactive voltage regulation in the distribution network. However, it does not address the issue of coordinated operation of controllable devices in medium and low-voltage distribution networks, potentially reducing the active output of renewable energy sources. [10, 11] proposed a decentralized voltage control using local curves of inverters for distributed energy resources, but only focused on low-voltage distribution networks without considering the high-voltage 110 kV side of the distribution network. The use of loss sensitivity factors to determine the optimal locations and sizes of Distributed Generators (DGs) in [12] did not adequately consider the voltage carrying capacity of the grid, leading to potential risks of voltage violations. [13] mentioned the determination of optimal sizes and locations of Distributed Generators (DGs) and capacitor banks in distribution networks to address voltage regulation issues. However, the article did not account for the issue of mismatched time scales between the two. [14] proposes a novel approach utilizing fuzzy logic and Artificial Immune System to minimize active power losses in Distributed Generators. However, it overlooks the issue of voltage violations caused by the integration of DGs into the distribution network.
[15] proposed a “AC-DC-Storage” governance strategy for voltage limit violations in rural low-voltage distribution networks without communication coordination. The main application scenario is in multi-terminal DC distribution networks. However, the application scenarios of the proposed coordinated control strategy are quite limited. [16] introduced a coordinated voltage control strategy for distributed photovoltaic power stations, aimed at addressing voltage stability issues arising from the expansion of distributed photovoltaic grid connections. However, this strategy only considers the voltage relationship between photovoltaic inverters and the grid connection point, which has certain limitations. [17] presented a cloud-edge collaborative voltage control method for distribution networks with distributed renewable energy sources, reducing operational losses in the distribution network. However, it did not address the voltage limit violation issues following the integration of a high proportion of renewable energy.
In summary, this paper will comprehensively consider the coordinated operation of controllable devices in medium and low-voltage distribution networks. It will be based on controllable devices with different time response scales, including On-Load Tap Changers (OLTC) for long-term adjustment, Hybrid Distribution Transformers (HDT) for minute-level adjustment, and Static Synchronous Compensators (STATCOM) for millisecond-level adjustment. Through MATLAB/SIMULINK simulations, the feasibility of this method will be verified using an improved IEEE 33-node system and simulations of an actual distribution network in a city in Zhejiang province.
2 Modeling Framework of Controllable Voltage Regulation Devices and Voltage Regulation Structures with Different Response Time Scales
With the continuous development of society, voltage regulation equipment is also constantly iterating and updating. This paper will mainly focus on the coordination issues of controllable voltage regulation devices with different response time scales under multiple time-scale sequential operation control in low-voltage distribution networks. The time scales will be divided into hourly, minute-level, and millisecond-level time scales. The following will briefly discuss the controllable voltage regulation devices at each response time scale.
2.1 Voltage Regulation Devices with Multiple Time Scales
Voltage regulation devices at different time scales include:
a. Voltage regulation devices operating at the hourly time scale primarily consist of On-Load Tap Changer (OLTC).
b. Voltage regulation devices with a response time scale in minutes mainly include Capacitor Banks (CB) and Hybrid Distribution Transformers (HDT).
c. Voltage regulation devices with a response time scale in milliseconds primarily consist of Static Synchronous Compensator (STATCOM), Static Var Generator (SVG), and Static Var Compensator (SVC). This paper will primarily focus on OLTC, HDT, and STATCOM for illustration purposes.
This paper will focus on OLTC, HDT, and STATCOM for illustration purposes. OLTC, operating at the hourly time scale, is primarily used on the 110 kV side for voltage regulation. Its on-load tap changing capability is widely applied to ensure the safe and stable operation of the power grid. However, due to its wide radiation range and mechanical limitations in the contacts, it should not be operated arbitrarily. Therefore, its constraints and time scales should be amplified. The principle should be to avoid operation whenever possible.
HDT, as an emerging special type of transformer, combines traditional distribution transformers with new power electronic transformers. The specific topology is shown in Figure 1, where the AC/AC topology is illustrated in Figure 2. It adds the flexibility of current electronic transformers to the reliability of traditional distribution transformers, providing higher reliability, flexibility, and energy efficiency for power grid operation. Its continuous voltage regulation capability significantly alleviates the randomness issue of integrating renewable energy into the grid. By offering flexible voltage regulation, it meets the voltage requirements of different grids and loads. However, limited by voltage measurement device constraints, it can only update the voltage level every five minutes based on data provided by smart meters, making HDT a voltage regulation device operating at the minute-level time scale.
The STATCOM, as a reactive power voltage regulation device, is shown in Figure 3. Its main components include power electronic switches, a DC voltage source, and a control system. It boasts advantages such as fast response speed, high control accuracy, and strong flexibility. It can adjust reactive power and voltage in real-time according to the needs of the power system, enhancing the stability, controllability, and energy efficiency of the power system. STATCOM plays a crucial role in voltage control and stability following the large-scale integration of wind and solar power generation into distribution networks.
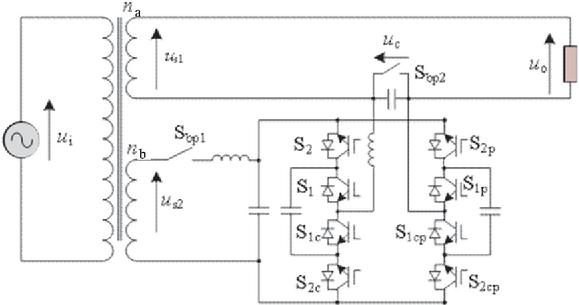
Figure 1 HDT topology.
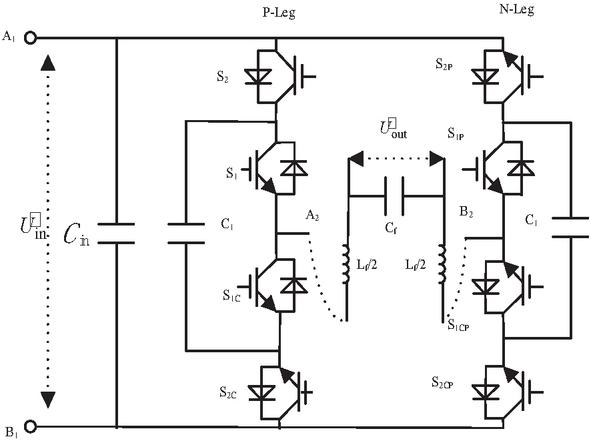
Figure 2 AC/AC topology.
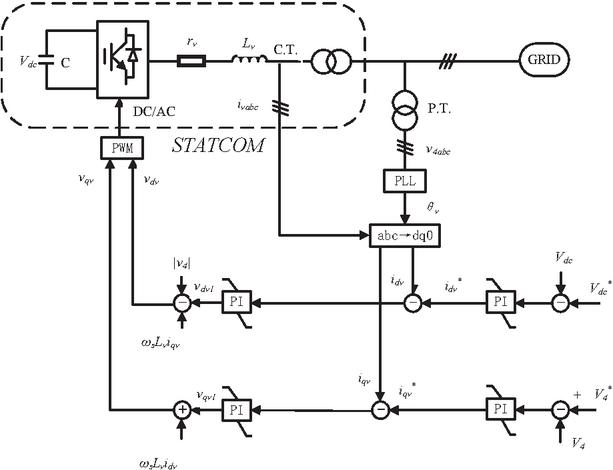
Figure 3 STATCOM block diagram.
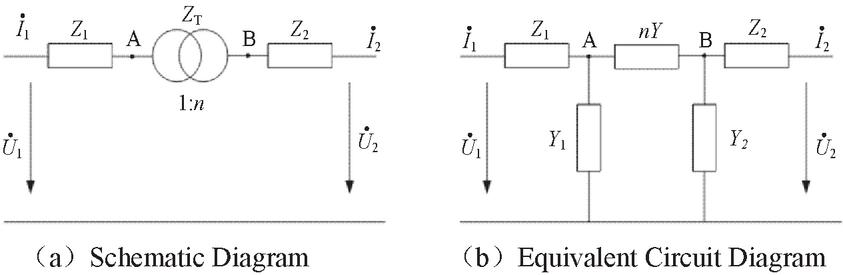
Figure 4 OLTC principle diagram and equivalent circuit diagram.
2.2 Mathematical Model of OLTC
In the analysis of OLTC, the OLTC is typically analyzed using an equivalent circuit diagram. As shown in Figure 4, it includes the OLTC principle diagram and the equivalent circuit diagram, where:
and represent the voltages at the primary and secondary sides of the transformer, respectively;
and represent the currents at the primary and secondary sides of the transformer, respectively;
and represent the impedances at the primary and secondary sides of the transformer, respectively;
and represent the magnetizing admittance of the transformer.
The turns ratio n of the transformer is defined as:
| (1) |
The state-space model of the transformer can be represented as:
| (2) |
In the equation:
and represent the resistances at the primary and secondary sides of the transformer, respectively;
and represent the inductances at the primary and secondary sides of the transformer, respectively.
2.3 Mathematical Modeling Of HDT
It can be inferred from Figure 1 that:
| (3) |
In the equation: represents the load voltage; represents the frequency winding voltage on the secondary side of the TR; and represents the flexible control voltage of the AC/AC converter.
The secondary side voltage of the frequency transformer unit TR is specifically as follows:
| (4) | |
| (5) |
In the equation: represents the input voltage on the primary side of the TR; represents the input voltage of the AC/AC converter on the secondary side of the TR, which is also the voltage of the auxiliary winding; n and n are the turns ratios, representing the turns ratios of the frequency winding and the auxiliary winding on the input voltage side and secondary side, respectively.
The duty cycle d is controlled by the modulation ratios and of the two bridge arms, P-Leg and N-Leg, of the AC/AC converter. The presence of these two modulation ratios also adds controllable degrees of freedom and operating modes to the BT-AC. The relationship between and , as well as the duty cycle d, is shown as follows:
| (6) | |
| (7) |
By combining (6) and (7), we can obtain:
| (8) |
The relationship between the secondary output voltage of the HDT device and the load voltage is shown in Equation (9):
| (9) |
In the equation: , , represents the load voltage and the secondary output voltage; , , represents the main winding voltage on the secondary side of the HDT; , , represents the output side voltage of the PEC module in the HDT.
2.4 Mathematical Model of STATCOM
The mathematical model of a STATCOM is typically based on the dq0 coordinate system. When a STATCOM is connected to the grid, its three-phase voltage equations are:
| (10) |
In the equation:
: Inverter AC output voltage;
: Grid voltage;
: STATCOM output current;
: Equivalent parameters of the filter reactor.
By using the Park transformation, the abc coordinate system is converted to the dq0 coordinate system, where the grid frequency is: :
| (11) |
The equation in the transformed dq coordinate system is:
| (12) |
In the equation:
, represents the direct/quadrature component of the current;
, represents the inverter output voltage component;
represents the grid frequency.
The relationship between the reactive power Q output of the STATCOM and the current on the dq-axis is:
| (13) |
By controlling component rapid adjustment of reactive power can be achieved. The reactive power output limit of the STATCOM is controlled by the DC voltage and the grid voltage , as follows:
| (14) |
Translation into English:
In the equation: X is the connecting reactance value, is the phase difference between and .
From formula (2.4), it can be seen that STATCOM typically controls reactive power through phase difference , as follows:
Translation into English:
When (leading phase of STATCOM voltage), STATCOM injects capacitive reactive power into the system;
When (lagging phase of STATCOM voltage), STATCOM injects inductive reactive power into the system.
2.5 Voltage Regulation Structure Modeling Framework
In the context of a large-scale integration of photovoltaic and other renewable energy sources into low-voltage distribution networks, the voltage in the distribution network is subjected to significant impacts. The stable operation of the distribution network urgently requires coordinated voltage regulation from various controllable resources. In this regard, based on the multiple time-scale sequential operation control of controllable voltage regulation devices, this paper proposes coordinated control of multiple controllable voltage regulation devices, categorized into hourly, minute-level, and millisecond-level voltage regulation strategies. The overall control objectives for the low-voltage distribution network are as follows:
| (15) | |
| (16) |
Where and represent the voltage deviation rate and voltage compliance rate at each node of the distribution network, respectively, with i denoting the node of the line and N representing the number of system nodes, indicating the rated voltage at the node; stands for voltage compliance time, and T represents the total time. The calculation method for voltage deviation rate (%) adopts absolute deviation.
As shown in Figure 5, an OLTC operating at the hourly time scale is connected to the 110 kV side, an HDT operating at the minute-level time scale is connected to the 10 kV side, and a STATCOM operating at the millisecond time scale is connected near the main load at the user end. OLTC and HDT update the tap ratios in real-time based on critical information from medium-voltage nodes and data from smart meters, reaching a certain time delay and then, based on constraints, output results to achieve voltage regulation. Meanwhile, STATCOM adjusts the voltage in real-time based on the connected node information to improve the distribution network voltage. This enhances the flexibility and stability of the distribution network, enabling a rapid response to the uncertainty in distributed energy sources and load changes in an economically reliable manner.
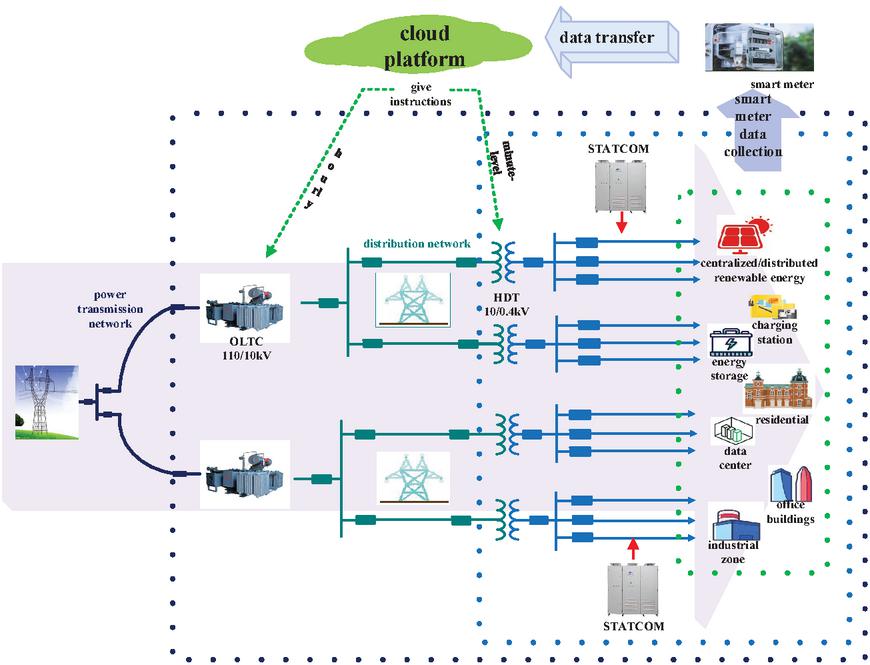
Figure 5 Collaborative control.
3 Coordinated Control Strategy of Multiple Controllable Voltage Regulation Devices
3.1 Hourly Time Scale
OLTC as a primary voltage regulation method is an essential device in the voltage regulation process. However, due to its limited lifespan and wide-ranging impact, it should be operated as infrequently as possible, or even not at all. Therefore, its operation setting should have a certain dead band to ensure economic and rational requirements, with the dead band being 7% of the medium-voltage side voltage. The number of tap changer operations per day, denoted as “,” should not exceed 6 times.
| (17) | |
| (18) |
Based on the hourly summarized values of the medium-voltage side voltage, the reference voltage value V can be obtained as follows:
| (19) |
Where a and b represent the upper and lower voltage limits, i is the number of medium-voltage nodes, the regulation strategy is illustrated in Figure 6 as follows:
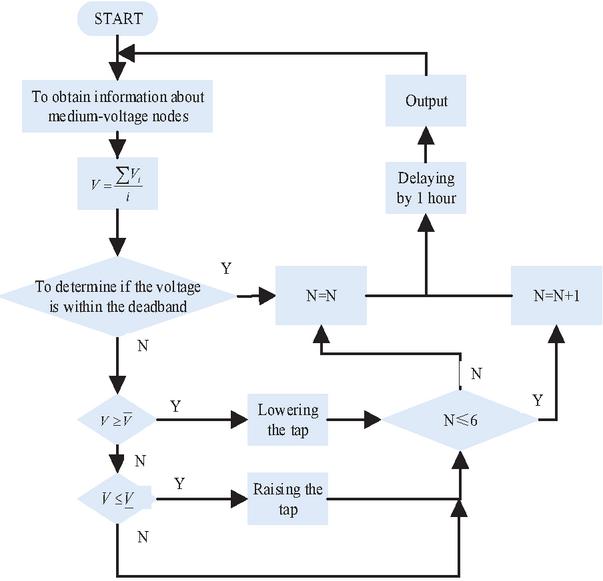
Figure 6 OLTC voltage regulation strategy.
3.2 Minute Time Scale
As a flexible voltage regulation device, HDT should ideally be capable of continuous voltage regulation. However, due to time and communication constraints in smart meter data collection, adjustments can only be updated every 15 minutes based on the collected data, as shown in the formula:
| (20) | |
| (21) |
Calculate the updated voltage magnitude, obtain the compensating voltage , adjust the output voltage by varying the duty cycles and in HDT, complete the voltage regulation to achieve low-side voltage regulation. The reference voltage V is 380 V. In this article, its PWM modulation principle is shown in the Figure 7, adjusting and to achieve voltage regulation.
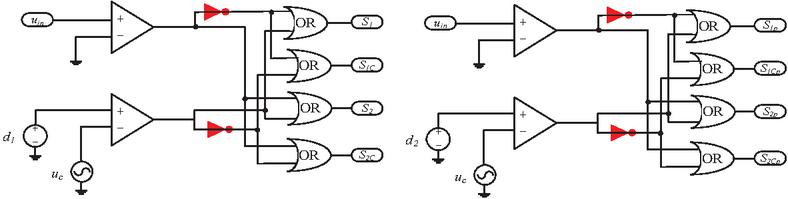
Figure 7 PWM modulation principle diagram.
The specific control process diagram is shown in Figure 8, where and are the input voltage and output voltage of the AC/AC module in Figure 2. To fully address the issue of communication reliability, a five-second delay was added to the data input in the HDT control strategy. This delay ensures that communication data is not affected by sudden changes, thereby enhancing the robustness of the HDT control strategy.
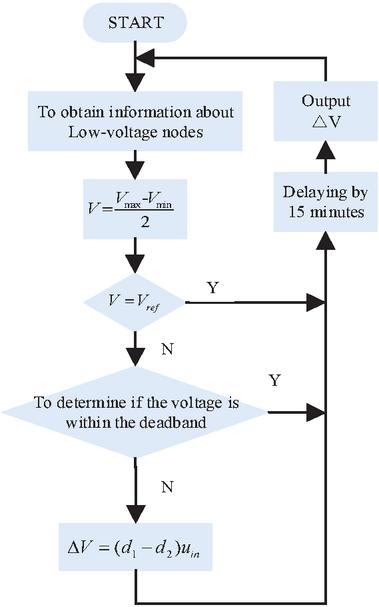
Figure 8 HDT voltage regulation strategy.
3.3 Millisecond Time Scale
STATCOM is the primary reactive power control device, characterized by its short dynamic response time, strong ability to provide low voltage output, and low harmonic distortion in the output. It regulates voltage through reactive power compensation, simultaneously reducing reactive power flow in the lines to minimize losses and ensure economic efficiency. Figure 3 depicts the basic topology of a STATCOM, which consists of capacitors and an inverter circuit. The reactive power output is given by:
| (22) | |
| (23) |
Where represents the grid-side voltage magnitude, represents the STATCOM-side voltage magnitude, and represents the phase angle difference between the grid side and the STATCOM side.
STATCOM adjusts the switching of IGBTs by generating PWM modulation signals to ensure reactive power output. This involves transforming the voltage from the abc coordinate system to the DQ0 coordinate system, and regulating the D-axis current I to zero. The specific strategy is as follows:
(1) Generate the instantaneous voltage phase angle , U, and U from the grid-side voltage V.
(2) Generate the current reference value Iqref along the Q-axis in the DQ0 coordinate system from the load-side current and . Generate i and i in the DQ0 coordinate system from the current I connected to the grid through the STATCOM. Take a capacitor reference voltage of 800V, subtract V from the STATCOM capacitor voltage, and generate the D-axis reference current I after PI processing.
(3) Take , where f is 50 Hz, and L is the output inductance of the STATCOM. Then , . Integrate the result of through PI to obtain , and integrate the result of Iqref-iq through PI to obtain .
(4) Set , .
(5) Convert U, U, and 0 to abc through DQ0 transformation.
(6) Generate PWM from U to complete the STATCOM control.
The control strategy is as follows:
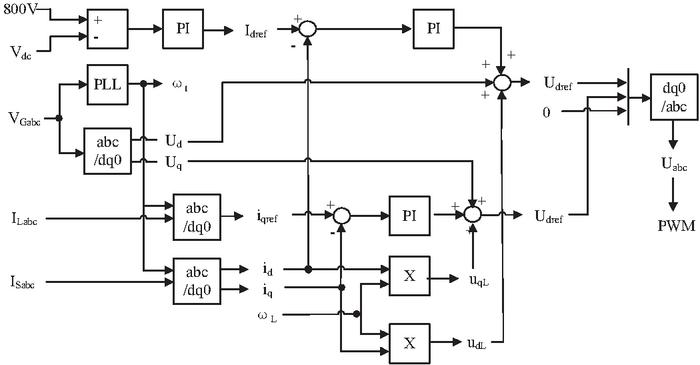
Figure 9 STATCOM control strategy.
3.4 Multi-Controllable Resource Cooperative Voltage Regulation
The above specifically explained the voltage control of individual devices operating independently. This section will elaborate on the coordinated control among three devices.
First of all, from a time scale perspective, OLTC provides voltage regulation at the hourly level, HDT at the minute level, and STATCOM at the millisecond level. Their progressive and complementary relationship in terms of time includes the fast response layer at the millisecond level, the mid-term regulation layer at the minute level, and the long-term optimization layer at the hourly level, as detailed below:
Fast response layer: The millisecond-level control mainly targets rapid voltage fluctuations over short periods and is able to react in an extremely short time. For example, when there is an instantaneous change in voltage at a connection point, the STATCOM can quickly obtain voltage data, generate PWM signals based on control strategies, control the reactive power fluctuation at the connection point, reduce voltage fluctuations, and stabilize the voltage. It acts as the first line of defense in the entire voltage regulation system, providing a foundation for subsequent control to avoid serious impacts of rapid voltage changes on the system.
Mid-term regulation layer: Minute-level control focuses on the voltage changes at various nodes in the low-voltage distribution network over a few minutes. Building upon millisecond-level control, it further regulates the voltage. If millisecond-level control fails to completely resolve voltage issues or if new fluctuations occur within a few minutes, minute-level control comes into play. By acquiring voltage data from various nodes in the low-voltage distribution network, calculating target voltages based on HDT voltage regulation strategies, and determining their compliance, adjustments are made after a 15-minute delay if they are found to be non-compliant. This delay helps avoid unnecessary adjustments due to momentary disturbances and makes the regulation more stable and effective.
Long-term optimization layer: Hourly-level control focuses on the long-term trend of voltage changes at various nodes in the medium-voltage distribution network. It complements and optimizes the controls at the two preceding time scales. Over a longer time span, the voltage in the medium-voltage distribution network can be influenced by various factors such as cyclic load variations. Hourly-level control involves acquiring voltage data from various nodes in the medium-voltage distribution network, calculating target voltages based on OLTC voltage regulation strategies, and determining their compliance. If non-compliant, adjustments to the OLTC settings are made after a 1-hour delay to achieve long-term stable control of the voltage in the medium-voltage distribution network.
Looking at it from a spatial dimension, OLTC has the widest control range, overseeing the entire downstream lines of OLTC, including the medium-voltage side and the low-voltage side; HDT follows with a narrower control range, overseeing the low-voltage side of the downstream lines of HDT; while STATCOM has the smallest control range, limited to the vicinity of its connection point. The control objects and ranges of the three time scales complement each other, collectively achieving comprehensive monitoring and regulation of the voltage across the entire distribution network. The controls at the three time scales are not conducted in isolation; they involve information sharing and feedback mechanisms.
Lastly, in the coordinated voltage regulation process, the controls at the three time scales are hierarchically coordinated based on their responsibilities and time intervals. When voltage fluctuations occur, the fast response of millisecond-level control is the first to stabilize the voltage; if issues persist, minute-level control intervenes for further adjustment; and if voltage instability persists over a longer period, hourly-level control conducts deeper adjustments to ensure the stability of the entire distribution network’s voltage and improve the quality of electrical energy. The specific framework is illustrated in Figure 10.
In the cooperative control strategy of STATCOM and HDT, a HDT-dominant control strategy has been added. When there is a conflict in the responses between STATCOM and HDT, the reactive power output of STATCOM is locked to ensure the priority of the HDT control strategy and to guarantee the reliable operation of the entire control strategy.
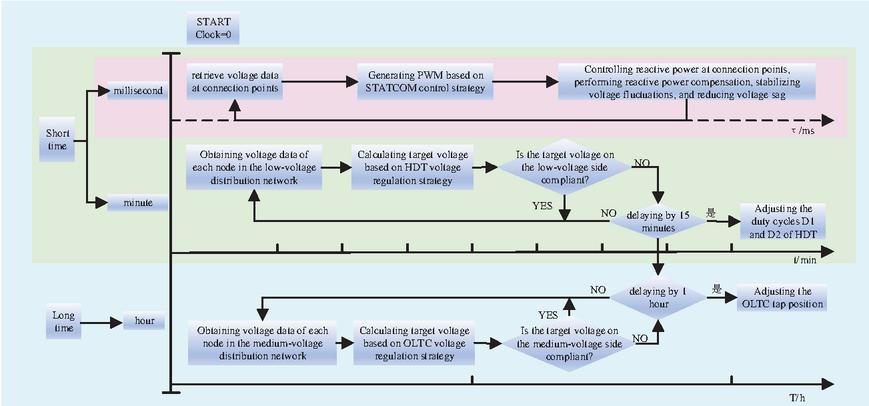
Figure 10 Coordinated voltage regulation of multiple controllable resources.
4 Simulation
This simulation is based on an improved IEEE 33-node system and the specific topology and parameters of a city in Zhejiang province, China. The specific topology is shown in Figures 11 and 12. The simulation is conducted using MATLAB/SIMULINK. The simulation step size is set to 1e-5 seconds, and the total simulation duration is 2 seconds. The load is a variable load that changes every 0.1 seconds. The OLTC has a reference voltage of kV on the medium-voltage side and a reference voltage of V V on the low-voltage side.
The simulation parameters for each device are as follows:
(1) For the OLTC, the tap changer moves every 0.4 seconds. There are 13 tap positions on the high-voltage side, and the voltage variation range between each adjacent tap position is 2.5% of the medium-voltage side reference voltage (10 kV).
(2) The HDT tap changer moves every 0.1 seconds and enters the system operation at 0.2 seconds.
(3) The STATCOM operates in real-time and enters the system operation at 0.1 seconds.
(4) The photovoltaic (PV) system starts operating and enters the system at 0.2 seconds. The capacity of the PV system is 50 kVA.
(5) The load variation mentioned in this paper is a stochastic load change, with the variation range between 40% and 85%.
(6) The voltage deviation rate and compliance rate in this simulation are collected every 0.02 seconds to ensure the reliability of the data.
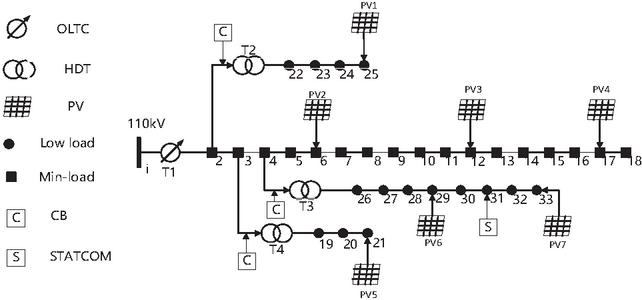
Figure 11 Improved IEEE 33-node topology diagram.
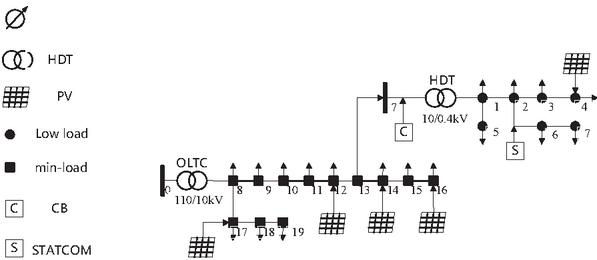
Figure 12 Topology of a city in Zhejiang province.
4.1 Simulation Validation of the Improved IEEE 33-Node System
To better demonstrate the superiority of the control strategy proposed in this paper, the system operation is divided into three groups for comparative experiments. They are:
(1) Independent Operation of OLTC
(2) Collaborative Operation of OLTC and HDT
(3) Collaborative Operation of OLTC, HDT, and STATCOM
In the improved IEEE 33-node system, the waveform diagram only considers the key nodes, which are the low voltage nodes 27 to 33.
When the OLTC operates independently, its waveform diagram is shown in Figure 13.
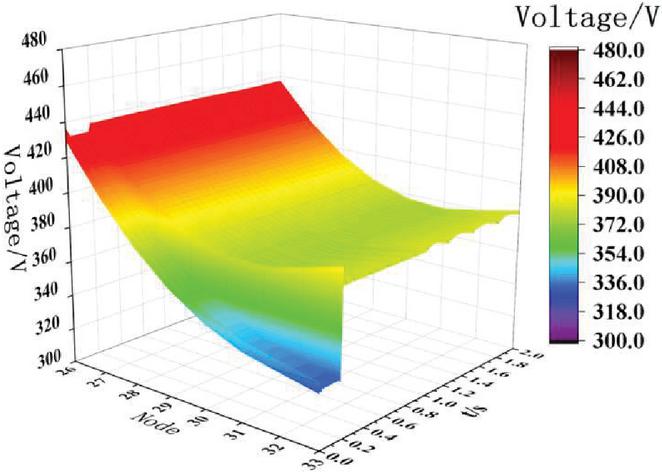
Figure 13 OLTC independent operation voltage regulation waveform graph.
When the OLTC and HDT operate collaboratively, their waveform diagram is shown in Figure 14.
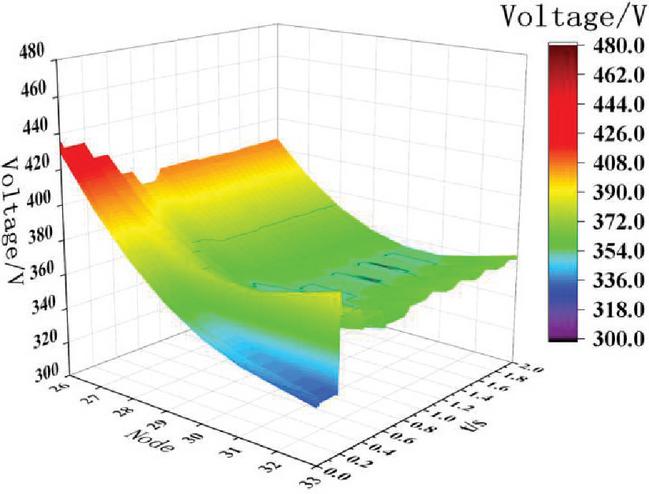
Figure 14 Voltage regulation waveform graph for OLTC and HDT coordinated operation.
When the OLTC, HDT, and STATCOM operate collaboratively, their waveform diagram is shown in Figure 15.
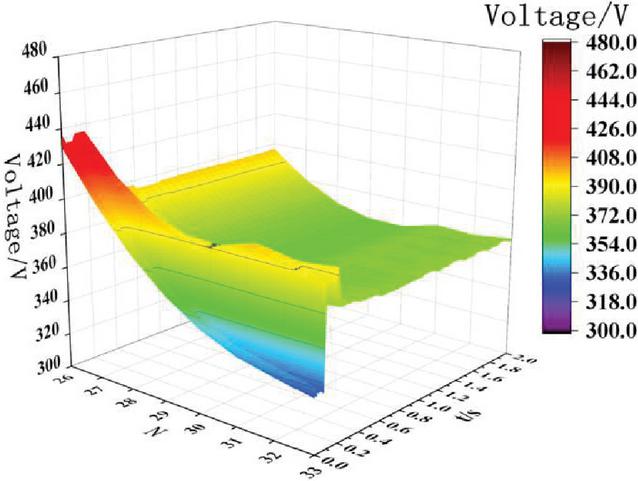
Figure 15 Voltage regulation waveform graph for coordinated operation of OLTC, HDT, and STATCOM.
In conclusion, comparing Figures 14 to 13, with the operation of HDT, the voltage is updated every 0.2 seconds with the tap ratio. This helps to maintain the voltage within a safe range and ensure the safe and stable operation of the load users. However, with the voltage changing every 0.2 seconds, there is a periodic fluctuation in the load-side voltage compared to the case when only OLTC regulation is used.
For Figure 15, with the integration of STATCOM at 0.1 seconds, the voltage profile is improved, ensuring a significant enhancement in the reliability of the voltage for all users along the line. When HDT starts operating at 0.2 seconds, it assists in quickly bringing the voltage within the safe range, greatly mitigating the issue of periodic voltage fluctuations caused by HDT. The specific data statistics are shown in Table 1 below:
Table 1 Comparative table of simulation results for improved IEEE 33-node system
| Voltage | Voltage | Minimum | Maximum | |
| Deviation | Compliance | Voltage | Voltage | |
| Participating Device | Rate (%) | Rate (%) | (V) | (V) |
| OLTC | 5 | 71.49 | 374.6 | 436.5 |
| OLTC, HDT | 4.55 | 80.54 | 347 | 422 |
| OLTC, HDT, STATCOM | 3 | 95.07 | 362 | 400 |
4.2 Simulation Validation in a City in Zhejiang Province
According to the three groups of comparative experiments proposed in Section IV-A, they are as follows:
When the OLTC operates independently, its waveform diagram is shown in Figure 16.
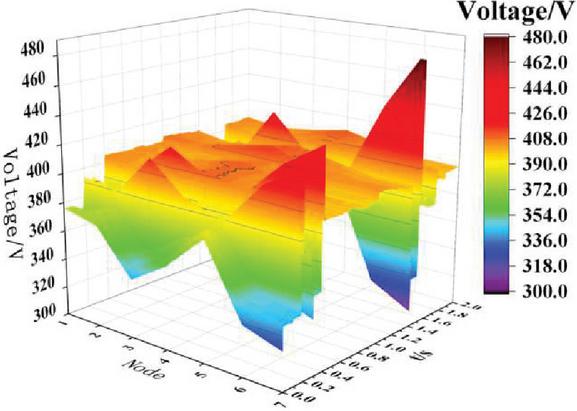
Figure 16 OLTC independent operation voltage regulation waveform graph.
When the OLTC and HDT operate collaboratively, their waveform diagram is shown in Figure 17.
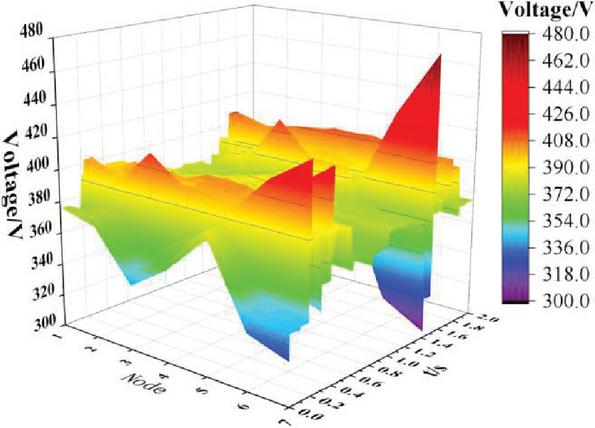
Figure 17 Voltage regulation waveform graph for OLTC and HDT coordinated operation.
When the OLTC, HDT, and STATCOM operate collaboratively, their waveform diagram is shown in Figure 18.
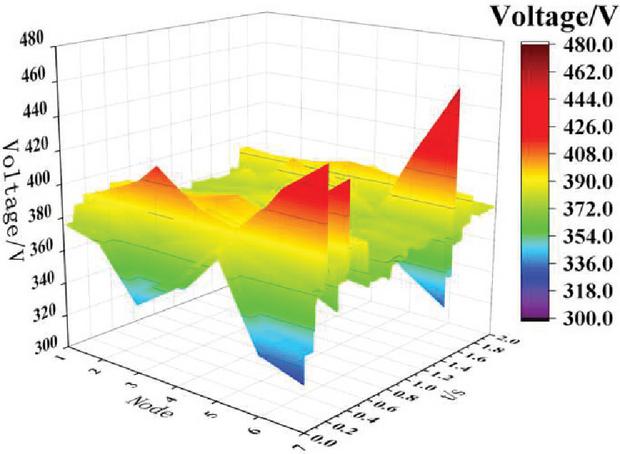
Figure 18 Voltage regulation waveform graph for coordinated operation of OLTC, HDT, and STATCOM.
In conclusion, compared to Figure 16, the participation of the HDT in Figure 17 improves the voltage stability on the load side, while mitigating the impact of drastic load changes at 1.4 s. In Figure 18 both the maximum and minimum voltage values are significantly improved, with the voltage profile and stability markedly enhanced. The system demonstrates substantial resilience to abrupt load variations, ensuring safer and more reliable grid operation. Detailed data are provided in Table 2:
Table 2 Comparative table of simulation results for a city in Zhejiang province
| Voltage | Voltage | Minimum | Maximum | |
| Deviation | Compliance | Voltage | Voltage | |
| Participating Device | Rate (%) | Rate (%) | (V) | (V) |
| OLTC | 5.3 | 82.65 | 311 | 477 |
| OLTC, HDT | 2.7 | 94.96 | 306 | 473 |
| OLTC, HDT, STATCOM | 1.7 | 99.04 | 333 | 460 |
5 Conclusion
In response to the current issues of high penetration of new energy sources, high complexity of loads, and significant load variations, this paper proposes an effective coordinated control strategy by integrating controllable devices with different time response scales in low-voltage distribution networks. Simulation verification was conducted, and the conclusions are as follows:
(1) Combining voltage control devices with different time scales, strategies were proposed for long-term hourly-level OLTC voltage regulation, short-term minute-level HDT control, and short-term millisecond-level STATCOM control. The coordinated voltage regulation of multiple controllable resources significantly improves the voltage compliance rate of high-penetration new energy low-voltage distribution networks.
(2) Simulation verification was performed using an improved IEEE 33-bus system and the actual low-voltage distribution system in a city in Zhejiang Province, China. In the improved IEEE 33-bus system, the voltage deviation rate decreased to 3%, with a voltage compliance rate increasing to 95.07%; in the actual low-voltage distribution system in Zhejiang Province, the voltage deviation rate decreased to 1.7%, with a voltage compliance rate increasing to 99.04%.
(3) The proposed method effectively addresses issues such as voltage violations after integrating new energy sources, load complexity, and uncertainties, providing an effective guarantee for the safe, stable, and economical operation of low-voltage distribution networks.
Acknowledgements
This paper is funded by the Science and Technology Project of Jilin Electric Power Research Institute Co., Ltd. (Project Number: SGJLDY00DWJS2300325), the Scientific Research Project of the Jilin Provincial Department of Education (Project Number: JJKH20250865KJ), and the Doctoral Research Startup Fund of Northeast Electric Power University (Project Number: BSJXM-2024201).
References
[1] Long, Chao, and Luis F. Ochoa. “Voltage control of PV-rich LV networks: OLTC-fitted transformer and capacitor banks.” IEEE Transactions on Power Systems 31.5 (2015): 4016–4025.
[2] Tewari, Tanmay, Abheejeet Mohapatra, and Sandeep Anand. “Coordinated control of OLTC and energy storage for voltage regulation in distribution network with high PV penetration.” IEEE Transactions on Sustainable Energy 12.1 (2020): 262–272.
[3] Gao Rong, Kou Peng, Liang De-liang, et al. “Robust Model Predictive Control for the Voltage Regulation in Active Distribution Networks With Hybrid Distribution Transformers.” Proceedings of the CSEE, 2020, 40(7): 2081–2090, 2388.
[4] Zheng Tong, Wang Kui, Zheng Zedong, et al. Review of Power Electronic Transformers Based on Modular Multilevel Converters[J]. Proceedings of the CSEE, 2022, 42(15): 5630–5649.
[5] Lu Ziguan, Zhao Gang, YANG Daliang, et al. Overview of Research on Power Electronic Transformer in Distribution Network[J]. Proceedings of the CSU-EPSA, 2016, 28(5): 48–54.
[6] Li Zixin, Gao Fanqiang, Zhao Cong, et al. Research Review of Power Electronic Transformer Technologies[J]. Proceedings of the CSEE, 2018, 38(5): 1274–1289.
[7] Li Junjie, Lv Zhenyu, WU Zaijun, et al. Adaptive switching strategy of AC/DC hybrid microgrid operating mode based on power electronic transformer[J]. Electric Power Automation Equipment/Dianli Zidonghua Shebei, 2020, 40(10).
[8] Li L, Yang C, Xu H, et al. Coordinated Voltage Control for Offshore Wind Farm Equipped with SVG and Energy Storage[C]//2022 12th International Conference on Power and Energy Systems (ICPES). IEEE, 2022: 800–804.
[9] Wu X, Dai H, Xu Z, et al. Voltage control strategy of distribution network based on coordinated control of PV inverter and SVG[C]//2019 IEEE 3rd International Electrical and Energy Conference (CIEEC). IEEE, 2019: 1907–1911.
[10] Delfanti M, Frosio L, Monfredini G, et al. Part I of II: Technical Strategies for Voltage Power Regulation in LV Distribution Networks[J]. Distributed Generation & Alternative Energy Journal, 2015, 30(3): 57–80.
[11] Delfanti M, Frosio L, Monfredini G, et al. Part II of II: Technical Strategies for Voltage Power Regulation in LV Distribution Networks[J]. Distributed Generation & Alternative Energy Journal, 2015, 30(4), 7–14.
[12] Kumar I S, Navuri P K. An efficient method for optimal placement and sizing of multiple distributed generators in a radial distribution systems[J]. Distributed Generation & Alternative Energy Journal, 2012, 27(3): 52–71.
[13] Kumar Injeti S, Shareef S M, Kumar T V. Optimal allocation of DGs and capacitor banks in radial distribution systems[J]. Distributed Generation & Alternative Energy Journal, 2018, 33(3): 6–34.
[14] Lalitha M P, Reddy V C V, Reddy N S, et al. DG source allocation by fuzzy and clonal selection algorithm for minimum loss in distribution system[J]. Distributed Generation & Alternative Energy Journal, 2011, 26(4): 17–35.
[15] JIA Yajun, LI Tao, XI Dongmin, et al. Voltage Violation Mitigation Strategy for Rural Low-voltage Distribution Network Based on Communicationless AC-DC-Energy Storage Coordination[J/OL]. Automation of Electric Power Systems, 1–16 [2025-04-29]
[16] Zhong Yujie, Han Pinpin, Xu Zaide, et al. Voltage stability control of distributed photovoltaic inverter based on source-grid coordination Strategy research[J]. JIANGXI DIANLI, 2025, 49(01):33–37.
[17] Li Jiangcheng, Xu Xiaochun, Hu Jianxiong. Voltage control method of distribution network with distributed new energy based on cloud-edge collaboration[J]. China Energy and Environmental Protection, 2025, 47(01):199–206.
Biographies
Yuze Fu, male, is currently employed at Jilin Province Electric Science Research Institute Co., Ltd.
Zhenxu Ma, male, is currently a master’s degree candidate in Electrical Engineering at Northeast Electric Power University. His primary research focus lies in flexible operation and control of distribution grids.
Wei Wang, male, is currently employed at Jilin Province Electric Science Research Institute Co., Ltd.
Zhuohong Yao, male, is currently employed at Jilin Province Electric Science Research Institute Co., Ltd.
Ruifeng Li, male, is currently a doctoral candidate at Northeast Electric Power University. His research primarily focuses on direct AC/AC power conversion technology and its application in multimodal control of distribution grids.
Dongbo Guo, male, is currently an in-service postdoctoral researcher at Tsinghua University. His research primarily focuses on direct AC/AC power conversion theory and its applications.
Distributed Generation & Alternative Energy Journal, Vol. 40_3, 505–532.
doi: 10.13052/dgaej2156-3306.4033
© 2025 River Publishers