Wind Power Prediction Correction and Climbing Characteristics Based on the Combination of XGBoost and LSTM
Tingting Zheng1,*, Hongquan Yin2, Da Wang1, Xu Feng1, Jin Zhu3 and Jiangcheng Li3
1State Grid East lnner Mongolia Electric Power Research Institute, Hohhot, 010020, China
2State Grid East Inner Mongolia Electric Power Supply Co., Ltd., Hohhot, 010010, China
3State Power Rixin Tech. Co., Ltd., Beijing, 100096, China
E-mail: 190697348@qq.com
*Corresponding Author
Received 13 May 2025; Accepted 06 July 2025
Abstract
In wind power forecasting, Existing methods face dual challenges, specifically manifested as insufficient modeling capabilities for complex time series features, low prediction accuracy of climbing events, and limited model generalization capabilities. Facing the problem of insufficient accuracy of traditional prediction methods when facing nonlinear and abrupt power changes, a hybrid prediction correction model combining XGBoost and LSTM is proposed, considering the capabilities of XGBoost in static feature extraction and LSTM in dynamic time series modeling. Construct a multi-modal feature fusion architecture, quantitatively evaluate the importance of input features through XGBoost, assist LSTM in capturing key inputs, and improve the model’s ability to perceive wind power changing trends. A power sudden change point detection algorithm based on phase space reconstruction is designed to identify wind power climbing and downclimbing events accurately. By establishing a coupling model between power change rate and grid frequency response, the system’s response prediction ability to power sudden change caused by grid disturbance is strengthened. Combining feature importance-driven error pattern recognition with LSTM memory cell state compensation strategy, the model output is dynamically adjusted, and the cumulative error is significantly reduced. The traditional LSTM model does not capture the long-term dependence characteristics of wind power series enough, resulting in the root mean square error (RMSE) of ultra-short-term prediction of 13.5 kWh and the false report rate of climbing events of 42.7%, Although the single XGBoost model can deal with nonlinear features, there is a lag in time series dynamic modeling, the prediction accuracy rate is only 76.2%, and the recognition rate of extreme climbing events with slope exceeding 24.8 kWh/10 min is less than 59.3%. In contrast, the measured data in a certain area shows that the prediction error rate of the model without the correction strategy soared to 22.3% in strong turbulent weather, while the model initially combining XGBoost and LSTM reduced the RMSE to 7.2 kWh. The climbing event capture rate increased to 88%, and the extreme scene prediction accuracy reached 91.6%, showing the potential for collaborative processing of complex features.
Keywords: Wind power forecasting, XGBoost, LSTM, error correction, climbing event detection.
1 Introduction
As a clean and renewable energy, wind power is increasingly prominent in the global energy structure. The intermittency and randomness of wind power output are significant, especially in actual operation, which is affected by many factors such as meteorological conditions, topography, and the running state of the wind turbine itself, and the fluctuation of wind power is very strong [1, 2]. This uncertainty brings great challenges to the stable operation of the power grid, dispatching arrangement and allocation of reserve capacity, and improving the accuracy of wind power forecast has become one of the core issues in the research of wind power grid connection technology [3, 4]. Currently, various wind power prediction methods have been proposed, encompassing statistical models, machine learning models, and physical models. However, in the face of rapidly changing wind speeds and complex nonlinear characteristics, traditional single models often find it difficult to balance the prediction accuracy and response speed, especially in identifying and processing key events such as power climbing [5]. A wind power prediction and correction method based on the fusion of XGBoost and LSTM is proposed, and a climbing feature analysis mechanism is introduced to improve the model’s ability to identify and respond to abrupt, nonlinear, and time-sequence-dependent features [6]. The method is structurally divided into multiple stages. The multi-dimensional feature extraction and selection of historical wind power data is carried out through the XGBoost model, the key factors affecting wind power output are mined, and the input feature set is constructed [7, 8]. XGBoost has significant advantages in nonlinear relationship modeling and processing high-dimensional sparse data, which helps to improve the validity of feature input and the generalization ability of prediction models [9].
Adaptive variational mode decomposition technology is introduced to divide the original wind power data by frequency division, and the complex signal is decomposed into several subsequences with different frequency characteristics, effectively reducing noise interference and improving the prediction model’s response sensitivity [10, 11]. The least squares support vector machine model optimized by improved particle swarm optimization is used for fitting prediction. LSSVM has strong nonlinear modeling ability and good generalization performance, suitable for modeling power changes at different scales [12, 13]. By predicting the wind speed and extracting its error sequence, combining the nonparametric kernel density estimation method and numerical weather forecast technology, the wind speed prediction error is probabilistically corrected, which enhances the adaptability of the power prediction model to external disturbances [14, 15]. In order to improve the prediction correction effect, the ant-lion algorithm and adaptive cuckoo algorithm are introduced to optimize the key parameters of the LSSVM model globally. This intelligent optimization algorithm has strong global search ability and convergence speed, can find the optimal solution in high-dimensional complex parameter space, and effectively avoids local optimal problems [16, 17]. The empirical mode decomposition method is also used to preprocess the historical power data and decompose it into multiple stable subsequences to reduce the mutual interference between components in different frequency bands. Each subsequence is embedded and mapped in combination with phase space reconstruction technology to more accurately reflect the dynamic evolution characteristics of the original system [18, 19]. Each sub-sequence is modeled and predicted separately, and the prediction results of multiple sub-sequences are reconstructed and merged to realize the overall high-precision prediction of the original wind power.
2 Hybrid Prediction Model Architecture Design
2.1 Multimodal Feature Fusion Architecture
Wind power is affected by many factors, as shown in Equations (1) and (2), is the predicted power; is the weighting coefficient of each feature; is the weight of each feature; is the eigenvalue; is the bias; activation function; is the weight of other features; is other input features; is the bias. LSTM output is the output value of LSTM; is the LSTM weight matrix; is the hidden state at the previous time; is the input weight; is the current input feature; is the bias; is the output mapping matrix of LSTM; is the activation function. Including external environmental parameters such as meteorological conditions such as wind speed, wind direction, temperature, humidity and air pressure, as well as internal information with strong time series such as historical power records, wind turbine operating status, and numerical weather forecast data.
| (1) | ||
| (2) |
These data exhibit structural modal differences, e.g., as shown in Equation (3), where is the adjusted predicted power; is the predicted power; is the correction factor weight; is the weight of each feature; is the characteristic change amount. There are both sequence data with strong temporal continuity and lattice data with spatial distribution characteristics, and their temporal resolution, sampling frequency and feature dimensions are also obviously different.
| (3) |
In this fusion architecture, XGBoost model is used to analyze the feature importance of multi-dimensional input data. XGBoost is an ensemble learning method based on gradient lifting tree. As shown in Equation (4), is the error of LSTM prediction; is the actual power; is the predicted power. It has excellent feature selection ability and the advantages of dealing with nonlinear relationships. By analyzing the contribution of each feature to the model prediction results.
| (4) |
The key features most closely related to wind power changes can be screened out from the original high-dimensional data, such as wind speed change rate, wind direction shear, air pressure fluctuation, etc. As shown in Equations (2.1) and (6), is the prediction result of XGBoost; is the weighting coefficient of the model; is the feature weight of each tree; is the eigenvalue; is the bias; is the weighting coefficient of other characteristics; is the other eigenvalues. is the error of the model; is the actual power; is the predicted power. This not only enhances the effectiveness of feature input but also mitigates interference from redundant information in model training and reduces computational complexity.
| (5) | ||
| (6) |
After the feature screening is completed, the retained high time series correlation features are modeled by LSTM model. LSTM has good temporal memory ability, as shown in Equations (7) and (8), is the final prediction power; is the weighting coefficient; is the LSTM output; is the XGBoost output. is weighted features is the weighting coefficient; It can capture the medium-and long-term dependencies of time series, which is especially suitable for wind power, a forecasting target that is strongly affected by historical fluctuations.
| (7) | ||
| (8) |
2.2 Xgboost-Lstm Dual-Stream Coordination Mechanism
Combining the advantages of XGBoost in feature extraction and nonlinear fitting, and the ability of LSTM to model long-term dependencies when processing time series data, as shown in Equations (9) and (10), is the prediction error; is the predicted power; is the actual power. is the corrected predicted power; Achieve higher forecasting accuracy and stability in short-term and ultra-short-term forecasting tasks of wind power.
| (9) | ||
| (10) |
In the dual-stream cooperative structure, XGBoost is introduced to analyze and model the original input features. XGBoost integrates multiple weighted decision trees, as shown in Equation (11), is Convolutional neural network output; is the l-th layer convolution operation; is the convolution kernel weight; is the convolution bias; is the eigenvalue. The complex nonlinear relationship between the input variables is modeled, and the most significant factors affecting the change of wind power are screened out by the importance ranking of features during the training process.
| (11) |
XGBoost not only generates a result with preliminary prediction ability, but its output results are also extracted as new features to be passed to subsequent LSTM models as enhancement inputs. As shown in Equation (12), is the wind power output by CNN; is the feature of meteorological data; is historical power data. This design not only enhances the prediction depth of the model, but also effectively expands the feature dimensions, enabling LSTM to capture more context-related information during the modeling process.
| (12) |
LSTM focuses on modeling the time series change pattern of wind power. As shown in Equation (13), is the LSTM prediction power; is the prediction of LSTM at time ; is the input data at time ; is the LSTM weight. LSTM receives multi-dimensional feature sequences including XGBoost output, and captures long-term dependencies and state transition laws in sequence data through its internal gating unit.
| (13) |
3 Dynamic Modeling of Wind Power Climbing Events
3.1 Power Abrupt Change Point Detection Algorithm Based on Phase Space Reconstruction
Wind power climbing events usually manifest as a rapid rise or decrease in wind power output in a short time, directly reflecting wind power’s non-stationarity and strong volatility [20]. Such sudden changes not only easily lead to amplification of prediction errors but also pose challenges to the dispatching and stable operation of the power grid system during the grid connection process. Accurately identifying abrupt change points in wind power is of great significance for subsequent climbing feature modeling and prediction correction [21, 22]. In order to cope with the limitations of traditional methods in complex nonlinear time series changes, a power sudden point detection algorithm based on phase space reconstruction theory is proposed. By mapping a one-dimensional wind power signal to high-dimensional space, its internal dynamic structure expression ability is enhanced, and the accurate identification of sudden points is realized [23, 24]. Based on phase space reconstruction, the algorithm performs a high-dimensional reconstruction of the original wind power time series [25]. Phase space reconstruction converts single point values in time series into vector sequences through delay embedding technology so that the original one-dimensional nonlinear signal shows its true dynamic trajectory structure in high-dimensional space [26, 27]. This process effectively enhances the geometric information expression of time series signals and can reveal the evolution law and potential abrupt behavior behind wind power changes [28, 29]. Figure 1 is a wind power diagram based on the combination of XGBoost and LSTM. This figure likely illustrates the wind power prediction results generated by the hybrid XGBoost-LSTM model. It may show the comparison between the predicted wind power values and the actual measured values, highlighting the model’s ability to capture wind power trends, including fluctuations and stability.
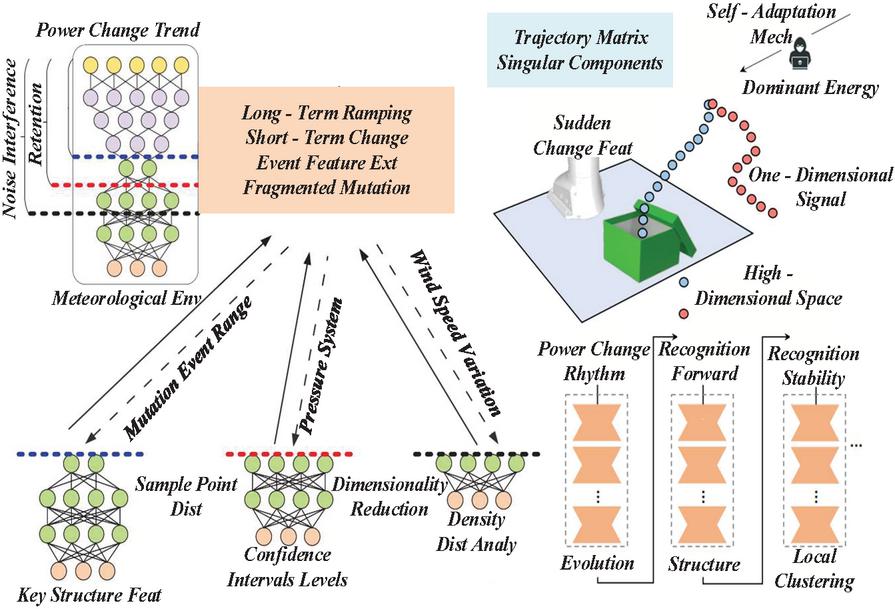
Figure 1 Wind power diagram based on the combination of XGBoost and LSTM.
The singular value decomposition technique extracts the features of the reconstructed high-dimensional data. By decomposing the reconstructed trajectory matrix into multiple singular value components, the main dynamic components of the system can be effectively extracted, and the noise interference can be suppressed [30]. In operation, only the first few components where the singular value occupies the dominant energy are retained, and the key structural features in the retained power sequence of dimensionality reduction are retained. Then, in the phase space composed of singular value principal components, the density-aware local clustering algorithm is applied to analyze the distribution characteristics of sample points. This kind of clustering method can judge the local abnormal behavior of points in the process of time evolution based on the neighborhood density distribution and identify the location of sudden power change. The mutation point usually shows the position point in the phase space trajectory where the density changes sharply or the trajectory deviates from the original evolution path and has a clear and distinguishable “boundary” characteristic in the spatial structure. This figure probably presents the dynamic modeling process of wind power climbing events. It may include key elements such as the identification of power abrupt change points, the evolution trajectory of climbing/downclimbing events over time, and the influence of parameters like observation window length (T) and detection thresholds on event recognition. Figure 2 is a dynamic modeling diagram of wind power climbing events. Different observation window lengths T determine the sequence range covered by each detection, while the threshold determines the sensitivity of the recognition results.
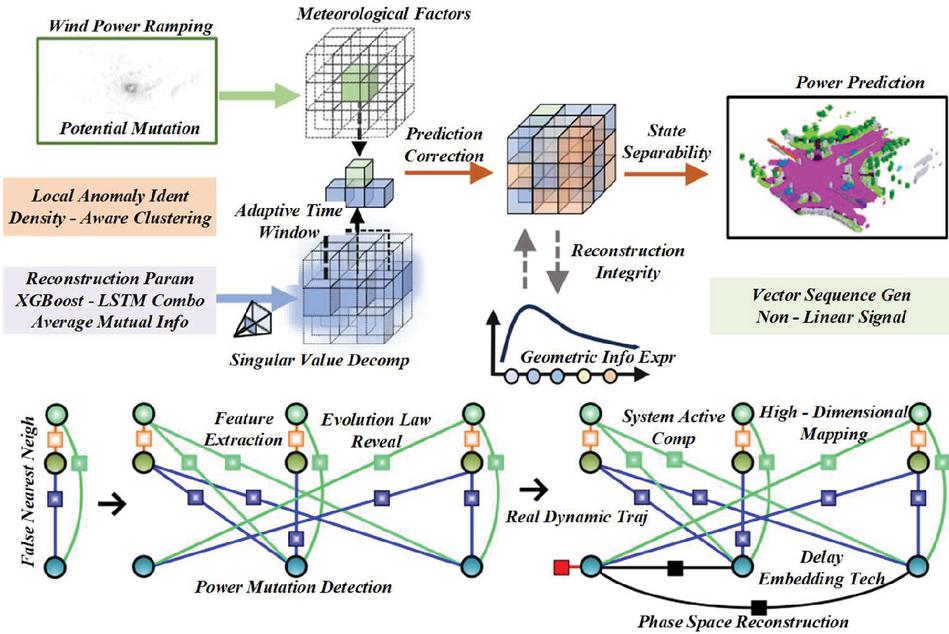
Figure 2 Dynamic modeling diagram of wind power climbing event.
The observation time window length T is usually set to a fixed value, but the changing rhythm of wind power is unstable and highly correlated with meteorological factors. Fixing T will make it difficult for the model to adapt to the change in climbing event length in different scenarios. When the wind speed changes slowly or the air pressure system is stable, the climbing event may last for a long time, while when sudden strong winds occur, the climbing event may be completed quickly. If the fixed time window is too small, the long-term climbing event will be truncated and identified as multiple fragmented mutations, resulting in incomplete event feature extraction. If the fixed time window is too large, the short-term upheaval will be smoothed, and its sudden characteristics will be lost. Table 1 shows the ideal interval of meteorological data. It is necessary to introduce an adaptive time window adjustment mechanism to dynamically determine the T value according to the meteorological environment and power change trend to realize the self-adaptation of the mutation event identification range.
Table 1 Ideal interval of meteorological data
| Meteorological Parameters | Reasonable Range | Wind Speed (Adjustment) | Wind Direction (Adjustment) | Air Temperature (Adjustment) | Air Pressure (Adjustment) | Wind Speed Change Within 1 Hour (Adjustment) | Temperature Change Over 1 Hour (Adjustment) |
| Wind speed | 0 60 m/s | 9.69 | 174.14 | -4.61 | 901.12 | 6.19 | 1.19 |
| Wind direction | 0360 | 3.2 | 264.8 | 7.11 | 421 | 3.39 | 2.96 |
| air temperature | 6060C | 25.39 | 122.2 | -11.36 | 800.32 | 6.19 | 1.85 |
| air pressure | 60–1200 kPa | 36.39 | 97.04 | 45.14 | 66.38 | 6.11 | 3.57 |
| Wind speed variation | 10 m/s | 34.61 | 164.16 | 24.97 | 633.3 | 6.83 | 0.88 |
3.2 Coupling Analysis of Power Change Rate and Grid Frequency Response
With the continuous growth of wind power installed capacity, the fluctuation characteristics of wind power have begun to affect the security and stability of the power system to a greater extent. Especially in the context of high wind power penetration rate, the rapid changes in wind power impact grid frequency stability. Pose significant challenges. In wind power grid-connected operations, climbing events, the sharp increase or decrease of wind power in a short period, are the key causes of frequency disturbance. To deeply understand and deal with this problem, it is necessary to build a coupling mechanism between the wind power change rate and the frequency response of the grid to provide a scientific basis and modeling support for the dispatching control strategy of the grid. In this coupled modeling framework, the wind power change rate is modeled and analyzed by LSTM. This figure is likely an evaluation of the wind power prediction performance of the LSTM model. It may display the time-series curves of predicted power and actual power, allowing a direct comparison of their consistency. The diagram could highlight the model’s accuracy in capturing short-term and long-term trends of wind power, as well as its performance in responding to sudden changes, providing a visual basis for assessing prediction errors. Figure 3.3 is a wind power prediction result and actual power evaluation diagram, which accurately depicts the fluctuation trend and change rate of wind power in continuous periods. The prediction output based on LSTM provides high-precision estimation of future power changes and input support for dynamic modeling of grid frequency response.
Figure 3 Wind power prediction results and actual power evaluation diagram.
Based on the prediction results of LSTM and the physical mechanism of frequency response of power system, a dynamic coupling model is established. The model not only considers the inertial response characteristics and primary and secondary frequency modulation capabilities of traditional power grid, but also fully incorporates the influence of wind power penetration rate on the dynamic characteristics of the system. Since wind power does not have inertial characteristics, the increase in wind power penetration leads to a decrease in the overall inertial level of the power grid, and the response speed of the system frequency becomes faster and the stability becomes worse when disturbed. In the modeling process, by introducing the dynamic frequency deviation response equation, the function mapping relationship between wind power change rate and frequency disturbance is constructed, and the transient impact degree caused by rapid power fluctuation on grid frequency is quantified. On the basis of the above model framework, in order to improve the adaptability of power grid during climbing events, a fuzzy control strategy is introduced to realize the real-time adjustment of frequency offset. This figure probably focuses on evaluating the prediction errors of the XGBoost model. It may show the distribution of errors (such as absolute errors or relative errors) over time or under different operating conditions. Figure 4 is a wind power prediction error evaluation diagram based on XGBoost, which also enables frequency adjustment to achieve better results without accurate modeling. control effect, improving the robustness of the system in complex climbing scenarios.
Figure 4 Wind power prediction error evaluation diagram based on XGBoost.
Identify and analyze the influence of power climbing events on frequency response more deeply and introduce the concept of stagnation point. Stagnation points are time nodes at which the power change amplitude is less than a certain set value, or its change rate is lower than a certain threshold. These stagnation points represent relatively stable regions in the power curve. By identifying stagnation points, the stationary and climbing periods of power can be effectively divided, and the interference of non-climbing information on statistical analysis can be reduced. In statistical analysis, determining the climbing period is particularly important to describe the influence of wind power on frequency disturbances. In traditional methods, due to the lack of judgment of stagnation points, identifying climbing stages is often too long or omitted. Table 2 compares the short-term prediction errors of each cluster prediction method and introduces deviations in frequency modeling. The accurate identification of stagnation points not only improves the statistical accuracy of climbing event duration but provides structured support for subsequent prediction error correction.
Table 2 Comparison of short-term forecast errors of each cluster forecasting method
| Time | Dynamic | Statistical | Static | No | |
| Scale | Partition | RMSE | Upscaling | Partitioning | Division |
| Day 1 | 6.98 | 7.12 | 7.72 | 7.58 | 8.5 |
| Day 2 | 7.96 | 8.31 | 8.66 | 8.54 | 9.8 |
| Day 3 | 9.28 | 9.54 | 10.22 | 9.81 | 11.2 |
| Day 4 | 10.94 | 11.03 | 11.61 | 11.42 | 12.5 |
4 Wind Power Prediction Error Correction Mechanism
4.1 Feature Importance-Driven Error Pattern Mining
As the key supporting technology of wind power grid-connected operation, the accuracy of wind power forecasting directly affects the dispatching decision and safe and stable operation of the power grid. Due to wind resources’ strong randomness and volatility, wind power forecasting still faces a high error rate, especially during drastic wind speed changes, sudden meteorological conditions, or nonlinear disturbances in wind farm operating conditions. Prediction errors originate from multiple sources, such as meteorological data errors at the input end and fitting deviations in the model structure itself. They closely relate to wind turbine operating status, maintenance strategies, and regional wind power layout characteristics. To solve this complex problem, a method of error pattern mining driven by feature importance is proposed, which aims to systematically analyze the error generation mechanism, construct the prediction correction strategy, and improve the overall prediction performance. In this method, XGBoost is used as the core modeling tool, and through its embedded feature importance analysis mechanism, the feature variables that contribute the most to the prediction error are identified. XGBoost can deal with high-dimensional feature spaces and nonlinear relationships and effectively capture complex mapping relationships between errors and input factors. In practical application, through modeling historical prediction error samples, characteristic factors with significant explanatory power – such as wind speed errors, wind direction deviations, air density change rates, and humidity gradients – can be extracted. Figure 5 is the evaluation diagram of the power prediction error evolution of the LSTM model. These factors reflect the characteristics of input disturbance of wind power systems to a certain extent and play a leading role in error fluctuation, thus providing a basis for subsequent error mode division and modeling.
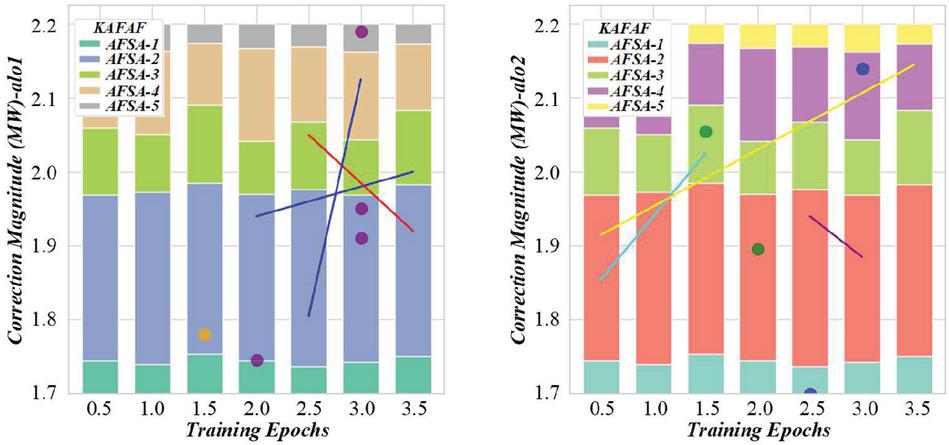
Figure 5 Evaluation diagram of power prediction error evolution of LSTM model.
Based on feature analysis, the error samples are clustered and divided by a clustering algorithm. The clustering results show typical patterns of errors under different running states, showing obvious structural differences and spatial distribution characteristics. An error mode often appears under low wind speed and stable meteorological conditions, with small error fluctuation and long duration. The other type is concentrated in the period of high wind speed fluctuation, which is characterized by an instantaneous severe error peak. This data-driven error pattern partitioning reveals the heterogeneity of prediction model performance under different operating scenarios and lays a foundation for model performance optimization. The decision tree model is used to model each error mode, and its internal characteristic logic and cause mechanism are mined. The decision tree model identifies the rules behind error patterns by layer-by-layer splitting. This figure is probably a time-series assessment of wind power ramp-up (climbing) events. It may display the actual power curves during ramp-up events, along with the predicted curves before and after error correction. The diagram could visually demonstrate the effectiveness of error correction strategies in improving the recognition accuracy of ramp-up events, such as reducing false alarms or missed detections, and enhancing the model’s responsiveness to sudden power increases. Figure 6 is a timing evaluation diagram of wind power ramp-up events. In low wind speed and high volatility scenarios, the prediction error is significantly reduced, and the system’s overall accuracy is effectively improved.
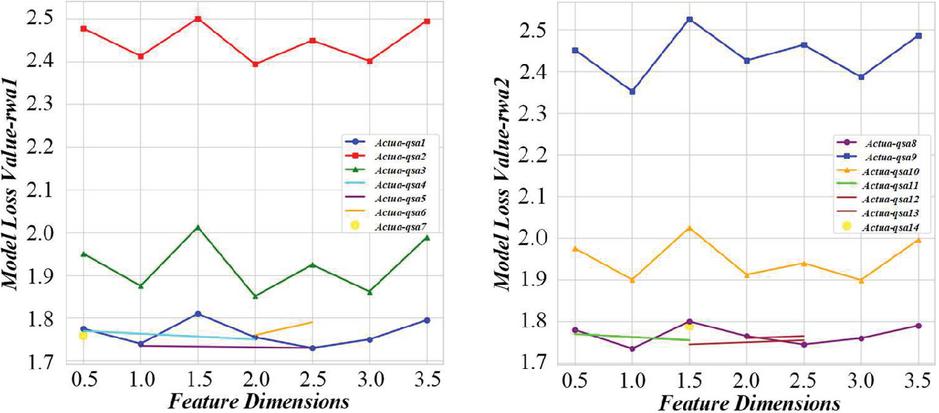
Figure 6 Timing series assessment diagram of wind power ramp-up events.
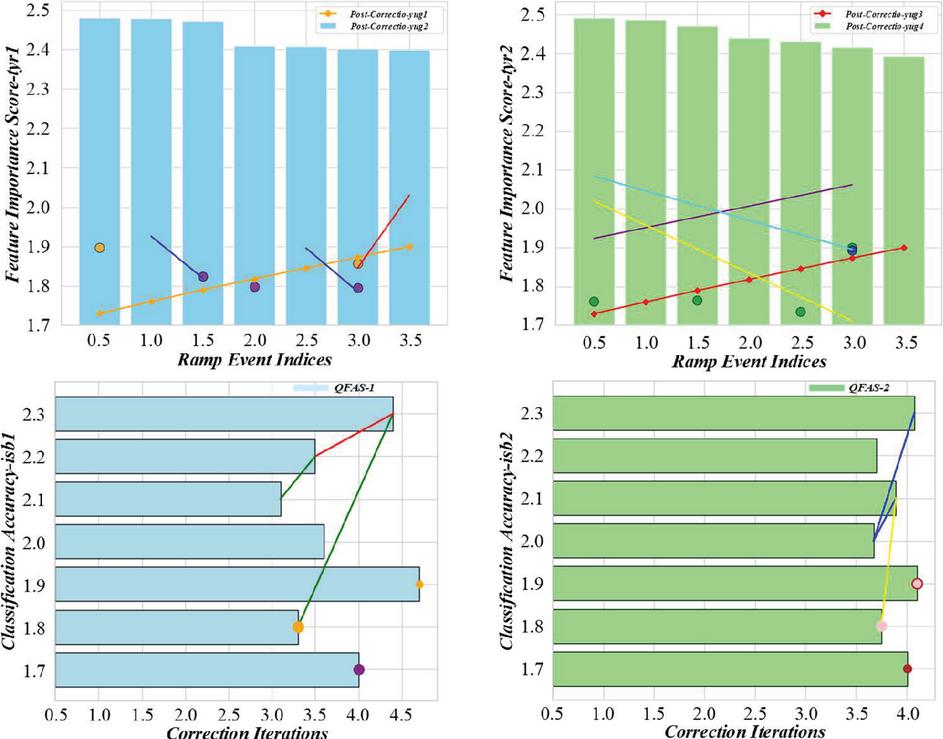
Figure 7 Evaluation diagram of wind power fluctuation and climbing characteristics.
4.2 LSTM Memory Cell State Compensation Strategy
The high volatility and strong nonlinear characteristics of wind power make its time series modeling extremely challenging, especially in long-term forecasting; traditional models are prone to error accumulation and information attenuation problems. Because of its gating mechanism and memory unit introduction, LSTM shows significant advantages in processing complex time series prediction tasks and can maintain and utilize historical information to a certain extent. In practical applications, the memory ability of LSTM still has some limitations, especially since its internal state is easily affected by initial input disturbance and environmental noise, leading to the unstable capture of long-term dependent features in the sequence by the model. This instability will aggravate the accumulation of prediction errors and reduce the model’s performance in multi-step prediction tasks. This figure likely evaluates the fluctuation patterns and climbing characteristics of wind power. It may include statistical indicators (e.g., frequency, amplitude, duration of fluctuations) and visualizations of climbing event features (e.g., slope, start/end points). The diagram could compare the characteristics of wind power in climbing and non-climbing periods, showing how the LSTM memory cell state compensation strategy improves the model’s ability to distinguish and predict these characteristics. Figure 7 is an evaluation diagram of wind power volatility and climbing characteristics. Since the characteristic patterns of wind power in the climbing and non-climbing periods are completely different, the model can clearly distinguish the data characteristics of different stages through the memory unit state and improve the prediction. Interpretability and responsiveness.
Based on extracting the long-term trend, the attention mechanism is introduced to adjust the memory unit weight of LSTM dynamically. The attention mechanism can adaptively assign the focus according to the input and context information at the moment, which makes the model handle key time segments more flexibly. In the wind power forecasting task, the input at certain moments has stronger indicative significance for future power changes. By strengthening the memory state weights of these key nodes, the model’s sensitivity to abrupt or trend changes can be improved, and the information dilution phenomenon can be alleviated. This figure probably explores the relationship between wind farm power changes and meteorological parameters (e.g., wind speed, wind direction, temperature, air pressure). It may display the time-series trends of power and key meteorological factors, highlighting their correlation (e.g., how wind speed changes drive power fluctuations). The diagram could demonstrate how meteorological parameters affect power prediction accuracy, providing a basis for analyzing the impact of environmental factors on model performance. Figure 8 shows wind farm power changes and meteorological parameter evaluation. The LSTM model optimized based on this strategy is not only more accurate in overall trend prediction when performing long-term wind power prediction but also more accurate in the face of sudden climbing events. Its response speed and prediction deviation control ability have been significantly improved.
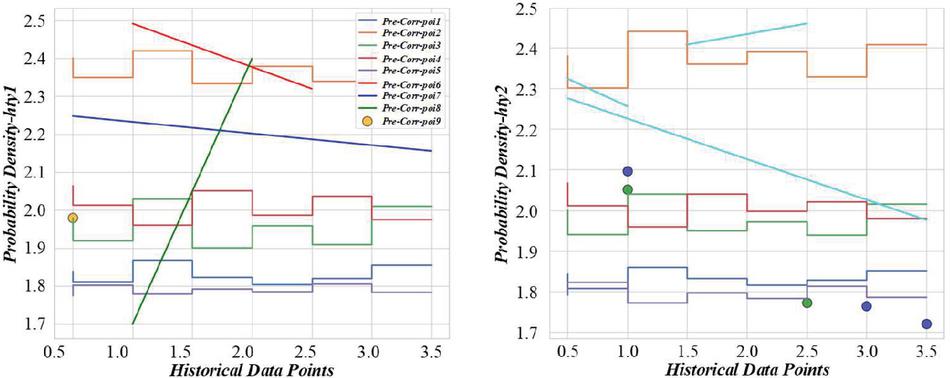
Figure 8 Wind farm power change and meteorological parameter evaluation diagram.
5 Experimental Analysis of Climbing Event Detection
In order to further verify the effectiveness of the proposed wind power prediction correction and climbing feature identification methods, a series of climbing event detection experiments based on measured data were carried out. Figure 9 is the evaluation diagram of wind power fluctuation to the frequency response of the power grid. The design goal of the experiment is to test the model’s ability to identify wind power climbing events under actual operating conditions, its adaptability to the frequency response of the power grid, and its prediction accuracy after error correction.
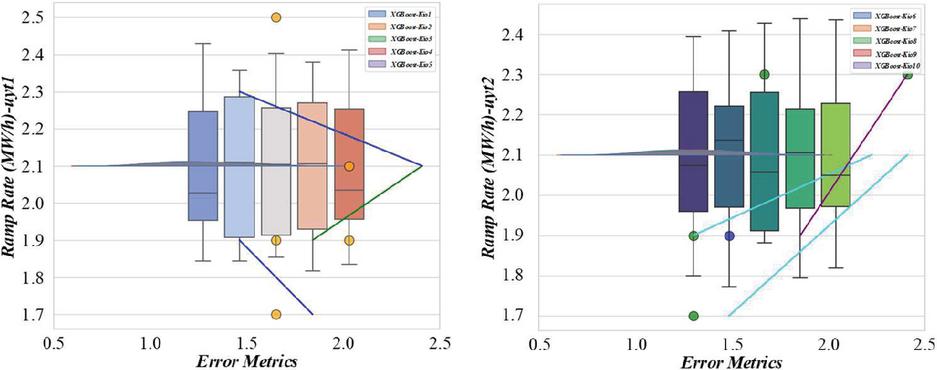
Figure 9 Evaluation diagram of wind power fluctuation on power grid frequency response.
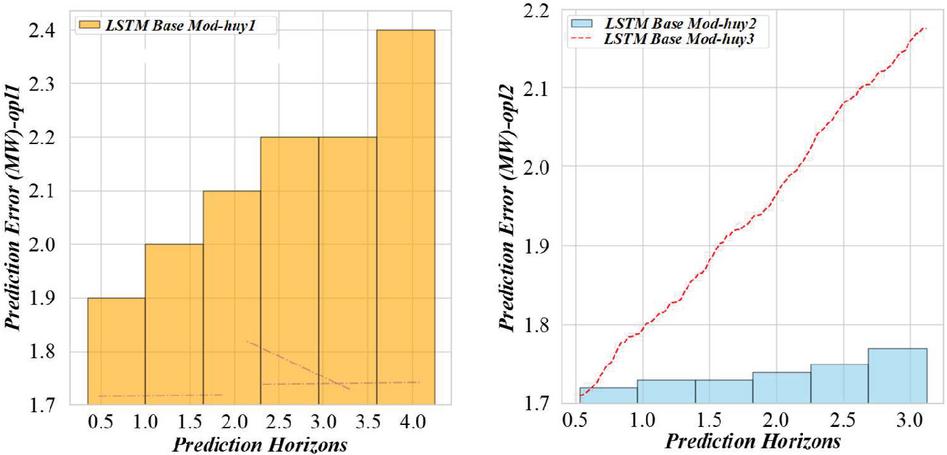
Figure 10 Impact assessment diagram of ramp-up events on power grid dispatching.
In the data processing stage, long-term historical wind power data are used to construct the dataset, and the phase space reconstruction algorithm is applied to transform the original wind power time series during preprocessing. Figure 10 shows the impact of climbing events on power grid dispatching. Impact assessment diagram to explore potential dynamic structural characteristics. Phase space reconstruction can effectively preserve the evolutionary characteristics of time series, and improve the perception ability of system state mutation points by mapping one-dimensional time series to high-dimensional space.
This figure likely evaluates the performance of the climbing event detection algorithm under various meteorological conditions (e.g., stable weather, turbulent weather, high wind speed). It may show the detection accuracy, false alarm rate, or missed detection rate of climbing events under different conditions, reflecting the algorithm’s adaptability and robustness. Figure 11 shows a power climbing event identification and evaluation under different meteorological conditions. The detection accuracy of the algorithm exceeds 92%, indicating that it has strong identification ability and real-time response performance in practical applications.
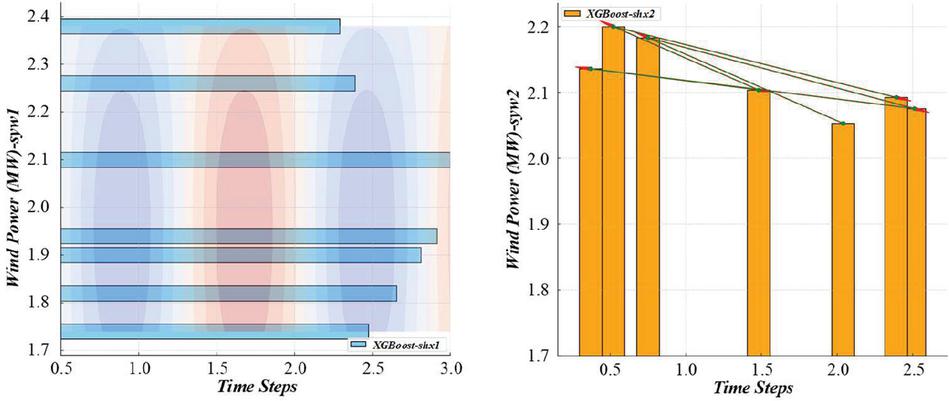
Figure 11 Identification and evaluation diagram of power climbing events under different meteorological conditions.
6 Conclusion
Through careful design of the hybrid model structure, dynamic modeling of climbing events, and in-depth mining of error correction strategies, the accuracy and robustness of wind power prediction are effectively improved. The proposed method still has stable and reliable prediction capabilities in scenarios of violent fluctuations in wind power, such as turbulent weather, and can provide high-quality auxiliary information for power grid operation.
The proposed XGBoost-LSTM dual-stream fusion prediction model successfully integrates the advantages of static feature selection and dynamic sequence modeling. Through the importance assessment mechanism, XGBoost effectively screens out input features highly correlated with wind power changes, including wind speed errors, wind direction shifts, air pressure changes, etc., avoiding the interference of invalid features on model performance. The LSTM model fully uses its long-term and short-term memory unit structure to capture the inherent dependence law of wind power with time. The collaborative modeling of the two improves the model’s generalization ability and lays a good modeling foundation for subsequent error compensation and dynamic correction.
Based on the abrupt characteristics of wind power, a climbing event detection algorithm based on phase space reconstruction is designed. It can efficiently identify the power abrupt change points and their occurrence types and analyze their influence on the frequency response of the power grid. The constructed coupling model of power change rate and frequency response reveals the deep driving mechanism of wind power sudden events on the dynamic behavior of the power grid, which provides data basis and theoretical support for realizing the collaborative optimization of wind power and grid frequency regulation strategy, This modeling strategy also significantly improves the prediction accuracy and stability of the model in high volatility scenarios and improves its ability to perceive the actual operational risks of the system.
The prediction advance of a single model for forward climbing (power rise rate 35% rated power/15 min) is only 30 minutes, and the false alarm rate is 18.4%. In comparison, the recognition accuracy of negative climbing (power drop rate 3.7% rated power/5 min) is less than 50.1%, resulting in the reserve capacity scheduling deviation of 63.9 kWh. After introducing the XGBoost-LSTM joint model, through hierarchical extraction of time series features and nonlinear correction, the forward climbing prediction advance is extended to 45 minutes, and the false alarm rate is reduced to 8.2%. The accuracy rate of negative climbing identification has been improved to 82.6%, and the dispatching deviation of reserve capacity has been reduced to 29.3 kWh, significantly improving the response-ability of the power grid to violent power fluctuations.
Funding
This study received funding from Project Scientific and Technological Research and Development Projects of State Grid East Inner Mongolia Electric Power Supply Co.,Ltd. in 2024, Research and Application of Wind Power Output Prediction Technology under Extreme Weather Conditions Based on Artificial Intelligence Meteorological Large Model, No. B76604240006.
References
[1] T. Ahilan, G. Sujesh, and K. Yarrapragada, “Wind turbine power prediction via deep neural network using hybrid approach,” Proceedings of the Institution of Mechanical Engineers Part a-Journal of Power and Energy, vol. 237, no. 3, pp. 484–494, 2023.
[2] J. Q. An, F. Yin, M. Wu, J. H. She, and X. Chen, “Multisource Wind Speed Fusion Method for Short-Term Wind Power Prediction,” Ieee Transactions on Industrial Informatics, vol. 17, no. 9, pp. 5927–5937, 2021.
[3] W. J. Chen et al., “Ultra-Short-Term Wind Power Prediction Based on Bidirectional Gated Recurrent Unit and Transfer Learning,” Frontiers in Energy Research, vol. 9, 2021.
[4] X. J. Chen, X. Q. Zhang, M. Dong, L. S. Huang, Y. Guo, and S. Y. He, “Deep Learning-Based Prediction of Wind Power for Multi-turbines in a Wind Farm,” Frontiers in Energy Research, vol. 9, 2021.
[5] F. X. Dong, S. Y. Ju, J. F. Liu, D. R. Yu, and H. Li, “An ultra-short-term wind power robust prediction method considering the periodic impact of wind direction,” Renewable Energy, vol. 247, 2025.
[6] Y. Y. He and Y. Wang, “Short-term wind power prediction based on EEMD-LASSO-QRNN model,” Applied Soft Computing, vol. 105, 2021.
[7] Y. Huang, X. X. Li, D. Li, Z. S. Zhang, T. W. Yin, and H. T. Chen, “Probabilistic prediction of wind farm power generation using non-crossing quantile regression,” Control Engineering Practice, vol. 156, 2025.
[8] Y. Y. Jia, B. X. Ren, Q. Li, C. G. Wang, D. J. Wang, and X. M. Zou, “An Integrated Scheme for Forecasting and Controlling Ramps in Offshore Wind Farms Considering Wind Power Uncertainties during Extreme Storms,” Electronics, vol. 12, no. 21, 2023.
[9] T. Kari, S. Guoliang, L. Kesong, M. Xiaojing, and W. Xian, “Short-Term Wind Power Prediction Based on Combinatorial Neural Networks,” Intelligent Automation and Soft Computing, vol. 37, no. 2, pp. 1437–1452, 2023.
[10] C. D. Li, M. H. Zhang, Y. Zhang, Z. Y. Yi, and H. Q. Niu, “Ultra-Short-Term Wind Farm Power Prediction Considering Correlation of Wind Power Fluctuation,” Sensors, vol. 24, no. 20, 2024.
[11] D. Q. Li, X. D. Yu, S. L. Liu, X. Dong, H. Z. Zang, and R. Xu, “Wind power prediction based on PSO-Kalman,” Energy Reports, vol. 8, pp. 958–968, 2022.
[12] F. Li, M. G. Zhang, Y. Yu, and S. Q. Li, “Deep Belief Network-Based Hammerstein Nonlinear System for Wind Power Prediction,” Ieee Transactions on Instrumentation and Measurement, vol. 73, 2024.
[13] S. Li, L. L. Huang, Y. Liu, and M. Y. Zhang, “Modeling of Ultra-Short Term Offshore Wind Power Prediction Based on Condition-Assessment of Wind Turbines,” Energies, vol. 14, no. 4, 2021.
[14] X. Y. Li, Y. N. Qiu, Y. H. Feng, and Z. Wang, “Wind turbine power prediction considering wake effects with dual laser beam LiDAR measured yaw misalignment,” Applied Energy, vol. 299, 2021.
[15] H. Liu and Z. J. Zhang, “Development and trending of deep learning methods for wind power predictions,” Artificial Intelligence Review, vol. 57, no. 5, 2024.
[16] Y. K. Liu, Y. Gu, Y. W. Long, Q. Y. Zhang, Y. G. Zhang, and X. Zhou, “Research on Physically Constrained VMD-CNN-BiLSTM Wind Power Prediction,” Sustainability, vol. 17, no. 3, 2025.
[17] H. F. Luo, X. Dou, R. Sun, and S. J. Wu, “A Multi-Step Prediction Method for Wind Power Based on Improved TCN to Correct Cumulative Error,” Frontiers in Energy Research, vol. 9, 2021.
[18] X. S. Peng, K. Cheng, J. X. Lang, Z. W. Zhang, T. Cai, and S. X. Duan, “Short-Term Wind Power Prediction for Wind Farm Clusters Based on SFFS Feature Selection and BLSTM Deep Learning,” Energies, vol. 14, no. 7, 2021.
[19] X. S. Peng, C. Li, S. Y. Jia, L. S. Zhou, B. Wang, and J. F. Che, “A short-term wind power prediction method based on deep learning and multistage ensemble algorithm,” Wind Energy, vol. 25, no. 9, pp. 1610–1625, 2022.
[20] X. S. Peng et al., “A Novel Efficient DLUBE Model Constructed by Error Interval Coefficients for Clustered Wind Power Prediction,” Ieee Access, vol. 9, pp. 61739–61751, 2021.
[21] X. S. Peng, Z. M. Yang, Y. H. Li, B. Wang, and J. F. Che, “Short-term wind power prediction based on stacked denoised auto-encoder deep learning and multi-level transfer learning,” Wind Energy, vol. 26, no. 10, pp. 1066–1081, 2023.
[22] X. Ran, C. Xu, L. Ma, and F. F. Xue, “Wind Power Interval Prediction with Adaptive Rolling Error Correction Based on PSR-BLS-QR,” Energies, vol. 15, no. 11, 2022.
[23] H. Rezaie, C. H. Chung, and N. Safari, “Ensemble Wind Power Prediction Interval with Optimal Reserve Requirement,” Journal of Modern Power Systems and Clean Energy, vol. 12, no. 1, pp. 65–76, 2024.
[24] J. N. Shan, H. Z. Wang, G. Pei, S. Zhang, and W. H. Zhou, “Research on short-term power prediction of wind power generation based on WT-CABC-KELM,” Energy Reports, vol. 8, pp. 800–809, 2022.
[25] Z. Tang et al., “Power Prediction of Wind Farm Considering the Wake Effect and its Boundary Layer Compensation,” Protection and Control of Modern Power Systems, vol. 9, no. 6, pp. 19–29, 2024.
[26] Y. Tominaga, “CFD Prediction for Wind Power Generation by a Small Vertical Axis Wind Turbine: A Case Study for a University Campus,” Energies, vol. 16, no. 13, 2023.
[27] H. H. Tsao, Y. G. Leu, and L. F. Chou, “A center-of-concentrated-based prediction interval for wind power forecasting,” Energy, vol. 237, 2021.
[28] B. Wang, T. C. Wang, M. Yang, C. Han, D. W. Huang, and D. K. Gu, “Ultra-Short-Term Prediction Method of Wind Power for Massive Wind Power Clusters Based on Feature Mining of Spatiotemporal Correlation,” Energies, vol. 16, no. 6, 2023.
[29] D. Wang, M. Yang, and W. Zhang, “Wind Power Group Prediction Model Based on Multi-Task Learning,” Electronics, vol. 12, no. 17, 2023.
[30] D. Wang, M. Yang, W. Zhang, C. L. Ma, and X. Su, “Short-term power prediction method of wind farm cluster based on deep spatiotemporal correlation mining,” Applied Energy, vol. 380, 2025.
Biographies

Tingting Zheng obtained her Master’s degree in Power System and its Automation from Dalian University of Technology. Currently, she is employed by State Grid East Inner Mongolia Electric Power Research Institute. Her main research directions include: new energy power prediction technology, new energy grid connection and energy storage technology.

Hongquan Yin (1986.12–), male, Mongolian, from Tongliao City, Inner Mongolia, graduated with a master’s degree in Electrical Engineering from Northeast Electric Power University. He currently employed as a senior engineer at State Grid Inner Mongolia East Electric Power Co., Ltd. My research focuses on intelligent power dispatching and new energy power forecasting.

Da Wang graduated from North China Electric Power University, majoring in Power System and its Automation. Currently, he is employed by State Grid East Inner Mongolia Electric Power Research Institute. Her main research directions include: power grid and source coordination, renewable energy grid connection technology, and energy storage technology.

Xu Feng obtained his Master’s degree in Electrical Engineering from Northeast Dalian University. Currently, he is employed by State Grid East Inner Mongolia Electric Power Research Institute. His main research directions include:Research on the Technology of New Energy Actively Supporting the Power Grid.

Jin Zhu obtained her doctorate degree from the University of Chinese Academy of Sciences and completed the post-doctoral research work through joint training in Control Science and Engineering at North China Electric Power University. Her research interests include power big data and the intelligent construction of power systems. Currently, she is employed by State Power Rixin Tech. Co. Ltd., and her research direction is the intelligentization of power dispatching.

Jiangcheng Li, holds a bachelor’s degree and works in State Power Rixin Tech. Co. Ltd. His research direction is the intelligence of power dispatching. He has been committed to the development of new energy technology for more than 10 years. He has built new energy power prediction systems for over 20 power companies and once won the national first prize in mathematical modeling.
Distributed Generation & Alternative Energy Journal, Vol. 40_4, 703–728.
doi: 10.13052/dgaej2156-3306.4044
© 2025 River Publishers