A Communication-Based Solution to Detect Islanding using Correlation Element in Distributed Generation Environment
Sanjeev Ranjan1, Munna Kumar2, Jitendra Kumar1, R. N. Mahanty1 and Vijay K. Sood3
1Department of Electrical Engineering, NIT Jamshedpur, Jharkhand, India-831014
2Department of Electrical Engineering, ARMIET, Thane, Maharashtra, India-421601
3Department of Electrical, Computer and Software Engineering, Ontario Tech University, Ontario, Canada
E-mail: sanjeev.ranjan90@gmail.com; meakmunna@gmail.com; jitendra.ee@nitjsr.ac.in; rnmahanty.ee@nitjsr.ac.in; vijay.sood@ontariotechu.ca
*Corresponding Author
Received 17 April 2025; Accepted 24 April 2025
Abstract
Issues regarding safety, circuit breaker reclosing, power quality, and regulatory compliance are identified when islanding is to be detected in a microgrid. In this paper, a novel communication-based, passive islanding detection method (IDM) is proposed to identify islanding in a microgrid to address these issues. This proposed method is based on correlation using the impedance measurement at the point of common coupling (PCC) and distributed generation (DG). The methodology is validated on a modified IEEE-13 bus system through a Phasor Measurement Unit (PMU) with a set threshold to discriminate between islanding and non-islanding events. The benefits of this proposed method are fast and accurate islanding detection. This IDM can tackle all the concerns regarding islanding detection in the cases of active power mismatch (APM), reactive power mismatch (RPM), DG disconnection with the presence of noise, unbalanced loads, irradiance change, weak and/or strong grid without providing any false signal as per IEEE UL1741 and IEEE STD. 929-2000. The authentication of the proposed scheme is also carried out for non-islanding events such as altered faults, non-linear loads, load switching, capacitor and inductor switching, feeder disconnection, and motor swapping, where all tests endorse the applicability of the proposed technique. The proposed methodology is validated both with simulation and Opal-RT laboratory results.
Keywords: Microgrid islanding, zero power mismatch, active power mismatch, reactive power mismatch, NDZ.
1 Introduction
Countries worldwide have been introducing new policies aimed at mitigating climate change impacts and reducing carbon emissions [1]. Many of these interventions focus on deploying more sustainable power systems to supply electricity on a large scale and introducing new technologies powered by renewable DG. The implementation of a microgrid system has changed the structure of the typical radial distributor network to become a multiple-source system and has challenged traditional protection patterns to verify islanding in a microgrid environment using typical IDMs. A larger number of DGs in the system creates more complexity and challenges regarding operational problems, security, and safety. Unintentional islanding in the system poses a significant risk to DGs since it can lead to issues with grid synchronization, power quality, inverter management, and maintenance [2, 3]. The microgrid’s security may be in jeopardy due to unplanned islanding. To guarantee the security of individuals and equipment, accidental islanding is not desired. As a result, one of the primary issues with the microgrid’s regular operation is islanding detection. According to IEEE STD 1547-2 2018 [4], islanding must be identified within two seconds, with the operating voltage allowable at the PCC being within 88% and 110% of the nominal voltage. Due to the abovementioned circumstances, it is necessary to identify the islanding state and develop an islanding detection algorithm that can distinguish among non-islanding scenarios.
Islanding detection algorithms can be broadly classified into local and remote techniques. Active, passive, and hybrid approaches are further divisions of local Islanding Detection Techniques (IDTs). To implement the remote IDTs, a specific message between the grid, DGs, and substations is used. Technologies such as SCADA [5], direct transfer trip [6], and power line signaling [7] are examples of communication-based techniques used for security and the observation of power quality.
The variance between the weighted major element analysis of the parameters is calculated using synchronized data [8]. This approach uses Q-statistics in conjunction with multi-resolution Teaser Kaiser Operator (TKO) to detect islanding. The use of PMU for communication in microgrids is covered in [9]. In this, the data is gathered and processed by a phasor data concentrator and utilized for protection, control, and monitoring of the system.
A wavelet transform signal is utilized by the power distribution system’s feeder to the DG terminal via the power line signaling [10]. If the DG terminal detects no signal, a non-islanding event is taking place. These systems have a very small non-detection zone (NDZ), but they are quite expensive to build and need fast processing to obtain the best accuracy. The product of adaptive gain, slip frequency, and the square of PCC voltage (in pu) yields this injected reactive power. The islanding detection time in this instance is 0.24 s. To detect islanding, a continuous high-frequency voltage is pumped into the master inverter in [11], which is the method used for parallel-connected DGs. If the current master inverter fails, this plan chooses a replacement and continues to work. To deal with total harmonic distortion (THD) and computational complexity, however, high-frequency signal availability and the slave-to-master inverter conversion are also necessary. To alleviate the mutual influence of THD on inverters, high-frequency transients are injected as a perturbation for multi-DG systems that use high-frequency impedance measurement to identify islanding [12]. These techniques, however, do not work well in scenarios with variable impedance. The primary benefit of the Active IDTs is their low NDZ. For active approaches, general issues, including instability, false tripping, and a decrease in power quality should be addressed and remedied.
Passive approaches in the local context rely on measuring parameters or indices such as voltage, current, impedance, frequency, and THD to detect islanding events. By comparing these measurements against predefined thresholds, detection methods can be employed to identify when islanding occurs. The rate of change of frequency (ROCOF) [13], over/under voltage [14], phase angle drift [15], vector surge relay [16], monitoring of reverse power [17], rate of change of reactive power [18], superimposed negative sequence [19], and other various techniques for islanding event detection are mentioned in the literature. These IDTs do not affect power quality, are faster to implement, and simpler to use. The major problem with these schemes is the large NDZ.
Utilizing PMU technology, islanding detection proves to be reliable, precise, and swift across diverse loading conditions. Data collected from synchronized measurements at various PMU locations undergo processing to enact algorithms addressing monitoring and protection concerns. Typically, the data transfer rate via PMU ranges from 60 to 120 frames/second [20]. An active communication-based IDT hinges on drifting slip frequency, delivering islanding event information post the injection of a reactive power disturbance – a product of slip frequency, adaptive gain, and the square of PCC voltage (in pu) in the system [21]. However, this IDT lacks testing for fault cases. Islanding event identification entails Pearson’s correlation between cumulative differences in frequency and phase angle parameters [22]. Assessing the impact of fault resistance is also imperative for such a scheme. The advent of distribution-level PMUs has notably enhanced the accuracy of islanding detection, leveraging sequence component angles processed by distributed PMUs [23]. While theoretically conceivable to program all plausible line contingency combinations for islanding detection, practical implementation faces feasibility constraints. System topology modeling approaches [24] may encounter challenges in appropriately detecting islanding due to PMU availability limitations. In [25], a communication-based technique is employed to identify islanding using PCC- and DG-end angle information. However, the index based on this angle fails in fault scenarios under zero power mismatch (ZPM) conditions.
By combining the aforementioned strategies and extracting certain aspects from the parameters, NDZ can be minimized in passive ways. By driving the PCC voltage above its allowable limit for a longer period, the feedback mechanism system underpins the passive IDT’s one-cycle regulation of a single-phase inverter. It assists in disconnecting the inverter and turns on the under-voltage/over-voltage (UV/OV) [26]. It is only tested in the situation of single-phase inverters, though. The information on islanding detection is provided in [27] as the difference between the measured impedance at the PCC and the frequency-dependent impedance. This method is not validated for signal-to-noise (SNR) ratio and is not effective in high-impedance variable scenarios. If an upper or lower limit is violated by a sensitivity index that is based on frequency changes in response to changes in reactive power, islanding is indicated [28]. To identify islanding, [29] uses an index that is based on a model modification of the input voltage. In [30], an empirical mode decomposition of the voltage signal using a time-varying filter is covered. To identify islanding, the deconstructed signal’s TEO is utilized. Nevertheless, the fixed set barrier for fault resistance above 3 affects efficacy.
For islanding detection, passive techniques are preferred because of their ease of use, affordability, and speed. To improve speed and accuracy, this paper presents a passive IDT that corrects impedance at the DG location and PCC. Using a sample frequency of 1 kHz, positive sequence voltage and current are detected at the PCC and DG junctions. These data are used to calculate the correlation, which is considered an index of the proposed method. This correlation index is further compared with a set threshold that confirms whether the system is in islanding or non-islanding mode. This paper’s primary goal is to develop a passive islanding technique for quicker and better reaction in ZPM conditions. The anticipated IDM is confirmed for different islanding situations, such as APM, RPM, quality factor (QF), irradiance change, induction motor switching, unbalanced load, etc., and different non-islanding situations, such as faults, load switching, capacitor and inductor switching, feeder disconnection, and non-linear load switching cases. The suggested IDT is tested with the IEEE 1547 and UL 1741 standards.
The major contribution of the proposed IDM is as follows:
• Islanding identification is quick and precise since the suggested technique is based on local parameters (voltage and current) at PCC and DG locations.
• The proposed technique works precisely in ZPM, including various APMs, RPMs, and other islanding cases, such as unbalanced load and QF conditions.
• The proposed method works well in noisy conditions up to SNR 40 dB.
• No false signal is generated in non-islanding cases.
• Non-detection zone (NDZ) is much less compared to other existing techniques.
• Additionally, real-time verification using the Opal-RT lab produces satisfactory results.
The rest of the paper is organized as follows: Section 2 provides system and DG descriptions with a discussion of the proposed technique. The results and discussions are discussed in Section 3. Hardware results and verification are shown in Section 4. Section 5 presents the conclusion of this research paper. References are delivered in Section 6.
2 Test System, Controller Design, and Implementation of the Proposed Method
2.1 System Description
A modified IEEE-13 bus test system is employed, as shown in Figure 1, to verify the suggested islanding detection approach under various islanding and non-islanding scenarios. The 4160 V, 50 Hz distribution system includes two 2 MW photovoltaic (PV) distributed generators. These generators are connected to the 4160 V distribution system through 480/4160 V transformers. Measurements of 3-phase voltages and currents are made at a sample rate of one millisecond at the PCC and DG junction point.
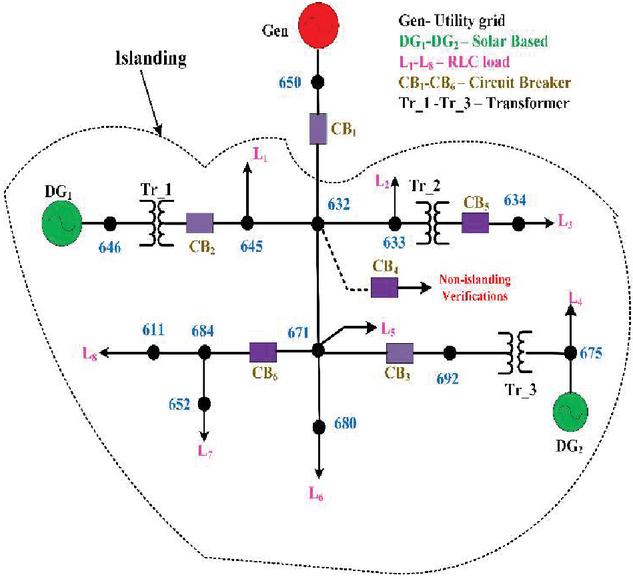
Figure 1 Test system.
2.2 DG Description and Controller
The proposed IDM is validated using the modified IEEE-13 bus system, considering distributed generators (DGs) at 4.16 kV, 50 Hz, and a rated output power of 4 MW as shown in Figure 1. The system comprises two solar-based DGs, namely DG and DG, connected via circuit breakers CB and CB, respectively. DG and DG (PV)-based distributed generators, generating 2 MW of power each, are connected to a 4.16 kV distribution system via 0.48/4.16 kV rated transformers located at node 646 and node 675. Table 1 outlines the specifications of the test system. CB facilitates the connection or disconnection of the main grid to the microgrid. In grid-connected mode, where CB1 is closed, power is supplied by both the main utility grid and the DGs to all loads. Conversely, in islanding mode, marked by CB being open, power is solely provided by the DGs.
Table 1 Test system specification
| Parameters | Values |
| Rated voltage (PCC) | 4.160 kV |
| Filter series resistance | 0.9192 |
| Filter series inductance | 0.0092 H |
| Filter shunt resistance | 1e |
| Filter shunt capacitance | 5.511e F |
| System frequency | 50 Hz |
| Switching frequency | 10.0 kHz |
| Power factor | 0.99 |
| Transformer rating | 480/4160 V |
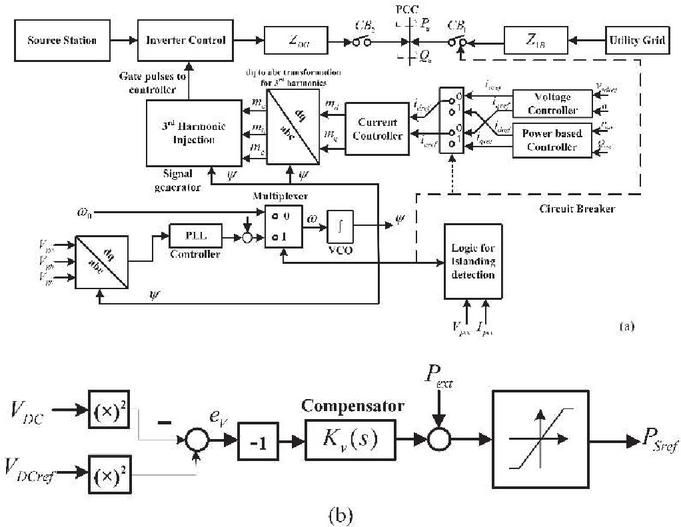
Figure 2 Control scheme.
Figure 2 illustrates the control scheme for both solar DGs, which provide active power to the system and operate at a near-unity power factor. Real and reactive powers, denoted as and , respectively, are measured at the PCC and controlled through a control system. The PCC provides the 3-phase voltage signals , , and , which are then converted into a dq-frame. The output of the dq-frame is fed into a phase-locked loop (PLL), which produces the frequency () to acquire the signal transformation . A multiplexer is used to compare this frequency () to the original frequency (). A thorough examination of the procedure is given in [31]. When reaches 2, the voltage-controlled oscillator (VCO) is reset to zero.
The controller depicted in Figure 2 has a primary goal of regulating the voltage at the source bus to enable independent control of and . To achieve this, the squared values of and are compared, resulting in an error signal that is processed by the compensator to produce . During the simulation, is maintained at zero to enable the VSC to operate at a unity power factor. is a disturbance signal described in [31]. and are set to 391.91 and 0, respectively, which determine whether the control operates in grid-connected mode or autonomous mode. The current controller receives and and generates and , which are converted to the abc frame (, , and ) by the dq-to-abc converter to 3-phase modulating signals. These signals are passed through 3rd harmonic injection to generate PWM pulses for controlling the inverter. The proposed IDM is designed using PCC and DG impedance, which is further used to calculate the correlation index. The logic block processes the command, which is then transmitted to the multiplexer and circuit breaker (CB) to provide islanding and non-islanding information.
2.3 Implementation of Proposed Method
In mathematics, cross-correlation is a way to quantify how similar two signals (or sequences) are to one another as a function of the time lag of one of them. It is extensively utilized in statistics, pattern identification, and signal processing to determine how one signal connects to another over time.
Positive sequence (PS) voltage and current are crucial to implement the suggested method. These components are stored at the PCC and DG junction to calculate the correlation, which provides information about the islanding or non-islanding scenario. The PS voltage and current show substantial results to identify the islanding conditions. The PS voltage and current are calculated as follows:
| (1) | ||
| (2) |
Positive sequence voltage and current are denoted by and . The value of is e, and the phase voltages and currents are , , and and , , and , respectively.
presents the cross-correlation for the continuous-time domain, and it is described as
| (3) |
() is the cross-correlation function, is the time shift (lag), and are continuous-time functions.
If n is the time lag (positive or negative shift) and are the two input sequences. is the cross-correlation at lag . Cross-correlation for finite discrete signals can be found as
| (4) |
Where is the length of the samples.
The proposed correlation-based IDM makes the up or down voltage and current vary periodically. For the implementation of the proposed technique, a correlation factor-based index is introduced and presented in terms of and . Correlation element in terms of and is defined as
| (5) |
To calculate the correlation factor of and gives an index for the proposed method. Therefore, the correlation index could be an indication of islanding after being compared with a set threshold.
The proposed correlation element is defined as (6):
| (6) |
Where is the correlation element, and is the scaling factor.
This correction element is considered an index, which is compared with a threshold to provide information on an islanding or non-islanding scenario. Simply, the proposed method is based on the fact that the islanding situation can be determined if the calculated correlation factor in Equation (6) is higher than the threshold values. Figure 3 shows the operational flow chart of the proposed method.
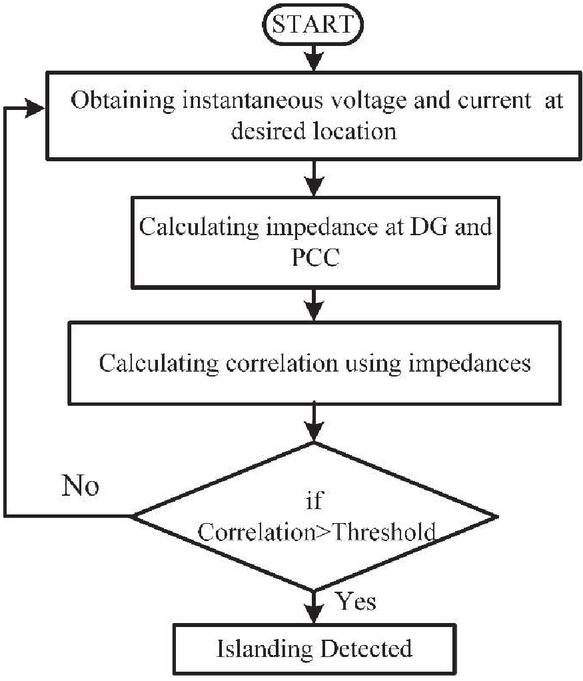
Figure 3 Flow chart for execution of proposed method.
3 Discussion of Results
In this segment, the outcomes for different islanding and non-islanding cases are discussed. The suggested scheme is already discussed in the previous section. According to the proposed IDM, the results are tested and verified for various islanding scenarios such as ZPM, APM, RPM, DG disconnection, unbalanced load, and irradiance deviation are verified. Similarly, for non-islanding different faults, non-linear loads and load swapping (RLC, C, L) are also verified. Apart from these verifications, NDZ, FDZ, and QFs discussion is also included in this section. A communication delay of 100 ms is incorporated for the synchronized PMU procedure.
3.1 Discussion of Zero Power Mismatch Under UL-1741 std.
The UL1741 std. [32] is used to verify the suggested scheme under both islanding and non-islanding cases. The DGs provided 4 MW of active power and 300 kVAR of reactive power while adjusting the total load capacity to match the ZPM condition. For the ZPM condition, the load is set at 3988 kW and 298 kVAR. At 1.0 s, CB is tripped to create the islanding event. The DG and PCC voltage and current are used to calculate impedance. To analyze the voltage and current at the PCC and DG terminals, a 0.1 s delay is added. This delay will serve as a communication delay. The PCC and DG impedance are displayed in Figures 4(a) and 4(b). Using both impedances, the correlation index is calculated and compared with the set threshold (20) as shown in Figure 4(c). The index waveform before 1.0 s is below the threshold, and after CB tripped, the index crossed the threshold after 122.6 ms. As the index crossed the threshold value, it indicated islanding; hence, an AS is generated as displayed in Figure 4(d). The above verification is found to be accurate in the ZPM condition.
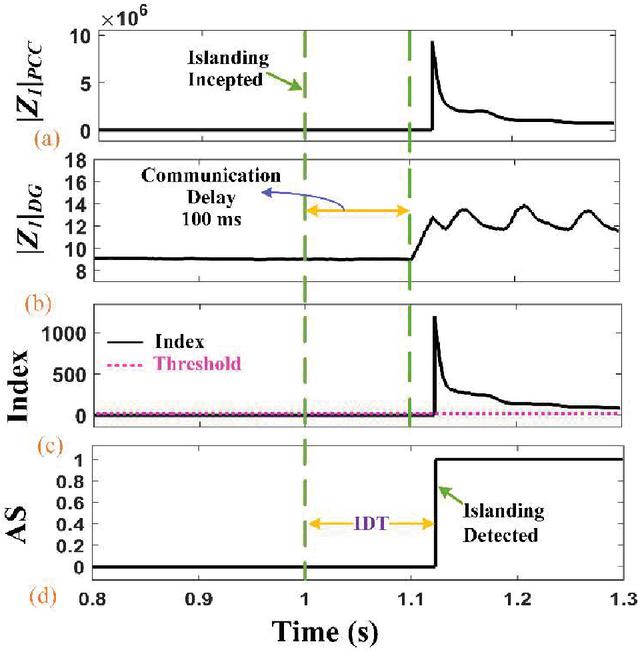
Figure 4 Waveforms in ZPM (a) impedance at PCC, (b) impedance at DG, (c) index, and (d) AS.
3.2 Authentication of Different Quality Factors (QFs) Under IEEE std. 929 [33] and UL1471 std. [32]
Several standards, such as IEEE std. 929 and UL1471, validate the islanding methods by authenticating different load quality factors. QF values up to 2.5 are validated by these standards. This section presents the results for different QFs ranging from 0.8 to 2.0. The 0.8, 1.0, 1.5, and 2.0 index waveforms and their AS are plotted in Figure 5.
Table 2 presents the RLC values and the islanding detection time for all validated quantitative factors (QFs). The indices, as described in (6), surpass the threshold value of 20 during islanding, prompting the generation of alert signals for subsequent indices, as illustrated in Figure 5(b). The proposed methods adhere to the UL1741 standard for detecting islanding under Zero Power Modulation (ZPM) conditions. Across all scenarios, the proposed method consistently delivers reliable and precise results.
Table 3 presents an association of the proposed method with various existing QFs based on islanding detection time. Notably, the maximum islanding detection time among the different QFs does not exceed 123.5 ms, underscoring the high efficiency of the IDT method.
Table 2 RLC load values with islanding detection time for different QFs
| QF | R () | L (H) | C (F) | Detection Time (ms) |
| 0.8 | 42.0 | 1.356 | 0.000120 | 123.30 |
| 1.0 | 42.0 | 3.178 | 0.00080 | 122.88 |
| 1.5 | 42.0 | 1.95 | 0.00110 | 123.05 |
| 2.0 | 42.0 | 4.270 | 0.00060 | 122.89 |
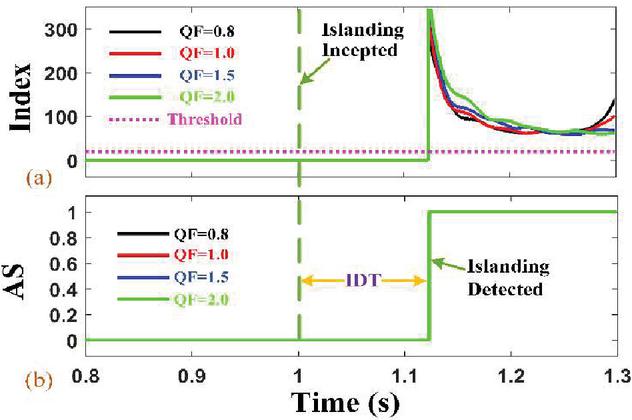
Figure 5 Waveforms of different QFs (a) index, and (b) ASs.
The region, where IDM is unable to sense the islanding condition, is referred to as NDZ. Therefore, calculating NDZ is a crucial factor for any IDM. To determine the NDZ of the suggested IDM, a modified IEEE-13 bus system is simulated under the UL 1741 standard in ZPM conditions. The DGs’ power capacity has a ripple of 12.0 kW and 2.0 kVAR due to the inverter controller’s dynamics. The suggested methods detect islanding under ZPM situations and have a minimal NDZ (0.3 % and 0.66 % for and , respectively). Figure 6 displays an evaluation of the NDZ of the suggested scheme with other existing methods [28, 34, 35].
Table 3 RLC load values with islanding detection time for different QFs
| References | QF | Detection time (ms) |
| [3] | 1.0 | 300 ms |
| [9] | 1.0 | 250 ms |
| [10] | 1.0 | 518 ms |
| [35] | 1.0 | 160 ms |
| [36] | 0.3 | 175 ms |
| [7] | 1.8 | 145.2 ms |
| [22] | 2.5 | 130 ms |
| [34] | 2.5 | 157 ms |
| Proposed | 0.8,1.0, 1.5, and 2.0 | 123.5 ms |
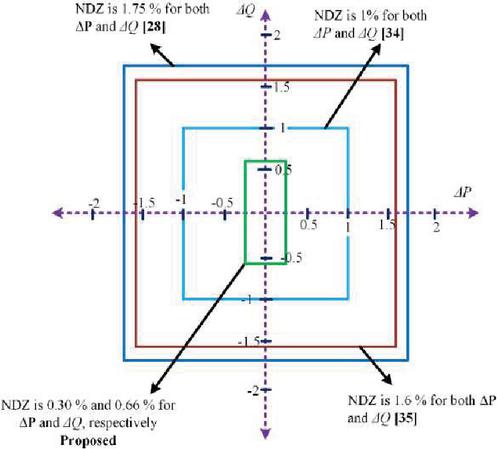
Figure 6 NDZ of the proposed method with other existing methods.
3.3 Discussion of Various APM Situations
The proposed approach has undergone verification for various APM situations, including a wide range of conditions. In the previous section, the ZPM condition is discussed. Regarding ZPM, RLC load was adjusted to create different power mismatch scenarios, ranging from 10% to 30 % with a gap of 10%. To achieve negative APM, the load is increased by 10%, 20%, and 30%, while to obtain positive APM, the load is decreased by 10%, 20%, and 30%, respectively. Each APM scenario involved creating an islanding event by tripping breaker CB at 1.0 s. After opening the breaker, the indices achieved higher values, as shown in Figure 7(a). The indices crossed the set threshold; hence, the respective AS are plotted in Figure 7(b). The maximum islanding detection time for negative APM is 127.10 ms and 122.68 ms for positive APM. Table 4 provides further details on the islanding detection time for each APM case discussed in this section.
| APM Conditions | IDT (ms) | APM Conditions | IDT (ms) |
| 10% APM | 122.55 | 10% APM | 122.68 |
| 20% APM | 127.10 | 20% APM | 122.65 |
| 30% APM | 126.58 | 30% APM | 122.45 |
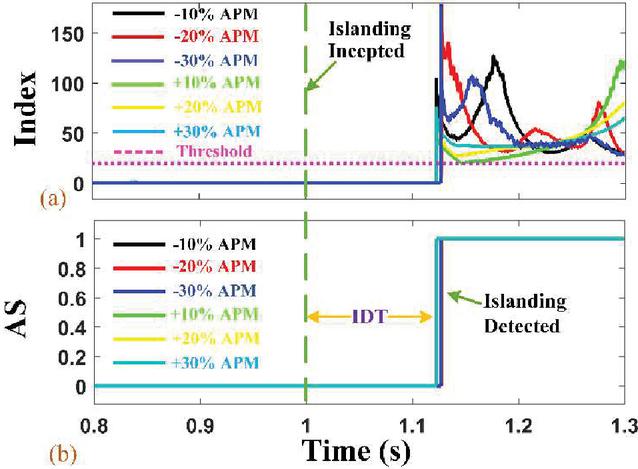
Figure 7 Waveforms of different APM (a) Index and, (b) ASs.
3.4 Results for Various RPMs
The proposed IDM’s effectiveness has been tested for multiple RPM conditions, including variations of 10%, 20%, and 30%. To account for these different conditions, the RLC load parameters are adjusted accordingly by decreasing the load by 10%, 20%, and 30% for negative RPM and 10%, 20%, and 30% for positive RPM cases. Islanding is initiated through the opening of CB at 1.0 s for each RPM case. The index is calculated using Equation (3) and crosses the set threshold (20) after breaker opening, as shown in Figure 8(a). The AS for each RPM case is plotted in Figure 8(b). The maximum islanding detection time for negative RPM is 125.75 ms and 122.55 ms for positive RPM conditions. Table 5 displays the islanding detection time for different RPMs, indicating that the proposed IDM is effective in various RPM situations.
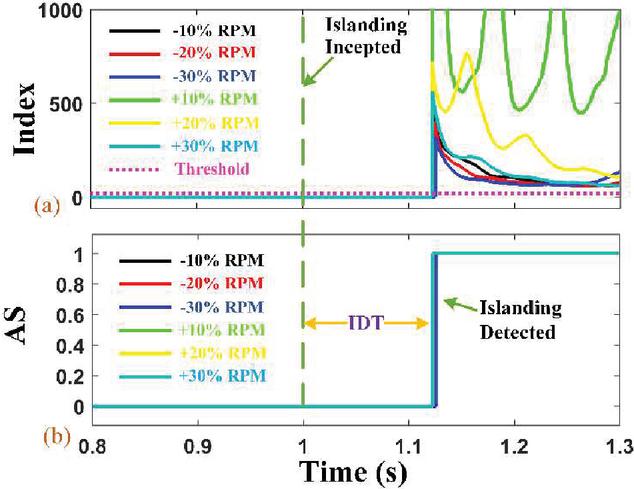
Figure 8 Waveforms of different RPM (a) index and, (b) ASs.
| RPM Conditions | IDT (ms) | RPM Conditions | IDT (ms) |
| 10% RPM | 122.68 | 10% RPM | 122.55 |
| 20% RPM | 124.54 | 20% RPM | 122.55 |
| 30% RPM | 125.75 | 30% RPM | 122.45 |
3.5 Results for DG Disconnection with Inclusion of Noise
To maintain the total load and generation, two DGs are used to supply the power to the load. It is important to investigate when islanding occurs, and at the same time, one DG is disconnected from the system. At that time, the technique should identify islanding with the presence of noise. A Gaussian white noise of 40 dB SNR ratio is introduced on the impedance of the DG and utility grid. To inject islanding, CB is tripped at 1.0 s, and at the same time, CB is also tripped to disconnect DG. Before 1.0 s, the system is in grid-connected mode. After tripping both CBs, the index crosses the threshold value within 122.65 ms, which indicates islanding detection. The technique did not work for SNR less than 40 dB, which is a limitation of the proposed IDM. Figure 9 demonstrates the index and AS for DG disconnection with the inclusion of noise.
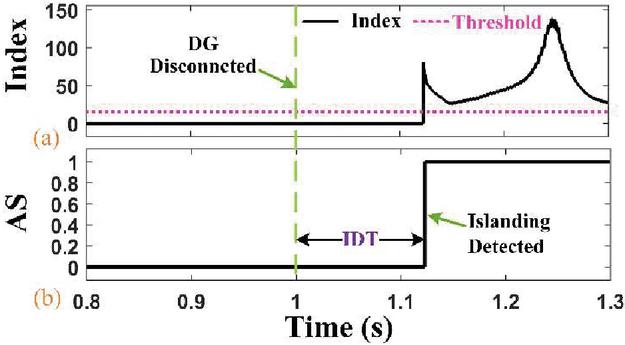
Figure 9 Waveform of DG disconnection (a) index and, (b) AS.
3.6 Results for Unbalanced Load Verification
The distribution system typically accepts unbalanced loading. To generate unbalancing, a inductive load with 450 kW and 100 Var has been initially attached at PCC. To create an unbalance in the system, the CB is tripped at 1 s. The index crosses the set threshold after the opening of CB. It takes 122.78 ms to detect islanding after CB is tripped. The index for unbalanced load and respective AS is plotted in Figure 10.
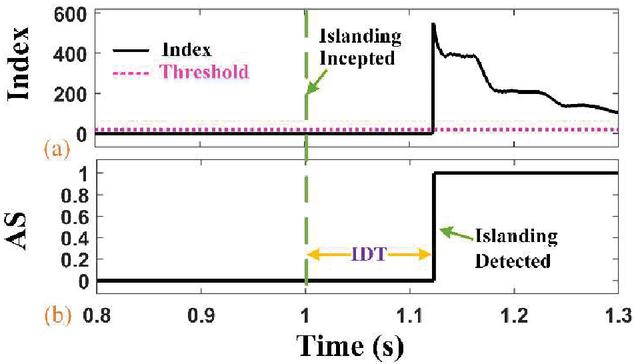
Figure 10 Waveform for unbalanced load (a) index and (b) AS.
3.7 Results for Irradiance Variations
The solar energy that strikes a solar plate per square meter is measured as solar irradiance. It changes as a result of changes in temperature, environmental circumstances, electrical load matching, shadow, solar intensity, sun angle, and other factors. The inverter-based DG design used in this subsection has a 2 MW DG capacity. The irradiance and temperature are maintained at 1000 W/m and 25 for worst-case scenarios. Testing the effectiveness of the suggested IDM is crucial to comprehending the effects of changing solar irradiation.
For verification, the sun irradiation fluctuates between 700 and 1000 W/m. For various scenarios of irradiance of 900, 800, and 700 W/m, the CB1 is tripped at 1.0 s. Figure 11 presents the simulated outcomes for each situation of solar irradiance. Respective ASs are also plotted in Figure 11(b). The index for irradiance change crosses threshold values after tripping CB1. The islanding detection time for 900 W/m, 800 W/m, and 700 W/m is 122.73 ms, 122.72 ms, and 120.55 ms, respectively.
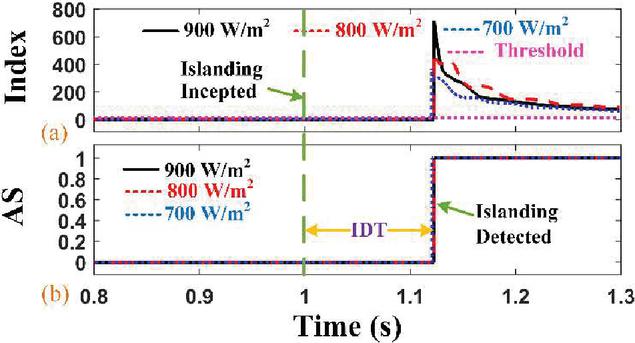
Figure 11 Waveforms of different irradiances (a) index and, (b) ASs.
3.8 Results for Weak and Strong Grid Verification
Weak grids are systems with high internal resistance and little short-circuit capacity. Voltage variation in a weak system is greater than in a strong system (voltage is generally constant in strong systems). The proposed IDM must, therefore, be verified for a weak system in an islanding scenario. This is why the internal impedance of the main utility grid, 0.0428 + j0.110, and the 50 MVA short-circuit capacity are taken into account. The islanding is formed by opening CB at 1 s. Figure 12 shows plots of the islanding detection results under weak grid and strong grid settings. The index crosses soon after CB1 trips. The AS is tripped at 122.62 ms for a weak grid and 122.6 ms for a strong grid system.
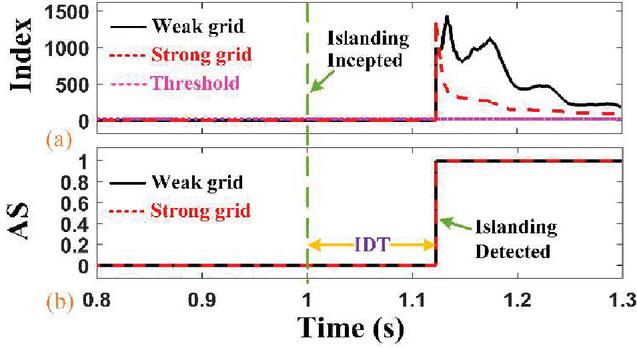
Figure 12 Waveforms for weak grid and strong grid (a) index and, (b) ASs.
The above verifications are all considered for the islanding case. The proposed IDM is verified for ZPM, APM, RPM, DG disconnection, unbalanced load, irradiance change, and weak grid, where all scenarios are found accurate, reliable, and never gave any false signal. Now, it is essential to see the accuracy of the proposed IDM in non-islanding scenarios. The upcoming sub-sections are verified for different faults, load swapping, non-linear load, and feeder disconnection.
3.9 Results for Different Faults
The proposed IDM’s Fault occurrence is probable in the microgrid due to human mistakes and system failures. If the proposed IDM does not identify a fault, the technique is unsuitable for islanding detection in a microgrid. Therefore, some fault is intercepted at PCC and near DG with different fault resistances (1 , 6 , 12 ).
To verify the line-to-ground (LG), double line-to-ground (LLG), and 3-ph to ground (LLLG) faults, a fault is incepted at 1 s to see the impact on the index. LG and LLLG faults with fault resistance of 1 , 6 , and 12 are intercepted at PCC-632. The index waveform reaches up to 0.02 after fault inception, which is below the set threshold (20) as shown in Figure 13. All waveforms are below threshold; hence, no ASs are generated, as shown in Figure 13.
It is not important that a fault occur only at a junction point. Hence, the LLG fault is initiated at node 675 near DG at 1 s. Similar to LG and LLLG faults, the waveform of LLG is not cross-set threshold; hence, no AS is generated for fault resistance of 1 , 6 , or 12 , as shown in Figures 13(c) and 13(d). The fault verification is found to be accurate and did not generate any AS.
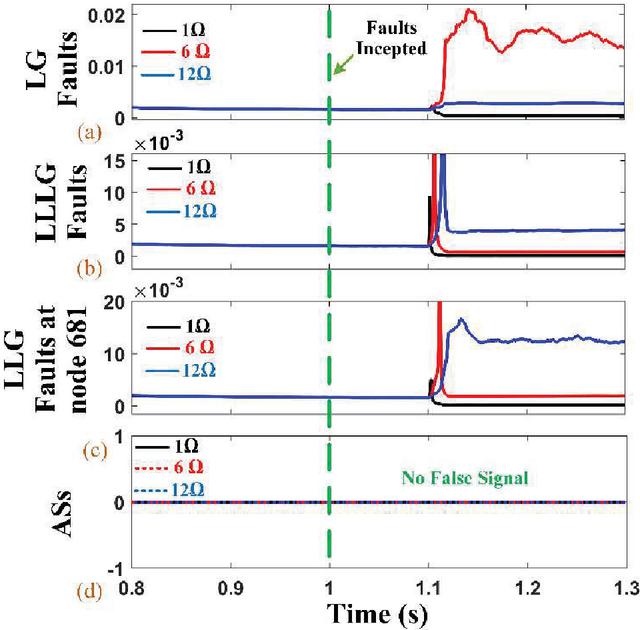
Figure 13 Waveform for different faults (a) LG fault, (b) LLLG fault index, (c) LLG fault index at node-675 and, (b) ASs.
3.10 Results for Loads Switching
The proposed IDM’s The creation of transients during load changeover may cause the protective system to malfunction. Hence, 12.5% of the entire 3-phase RLC load (500 kW) under ZPM is abruptly increased at 1 s at PCC to study 3-phase load swapping situations. As seen in Figure 14, the index rises but does not go beyond the threshold after the opening of CB4. The proposed IDM observes this circumstance as NIE and does not send a warning signal.
The proposed IDM is also verified for capacitor and inductor swapping. For capacitive load swapping, a capacitor bank of 15 kVAR rating is attached at the junction point using CB4. The CB4 is tripped at 1 s to see the impact of capacitor load swapping on the index. The change in reactive power does not significantly affect voltage and current because of the capacitor connection at PCC. Hence, there is no perceived impact on the index waveform, as shown in Figure 14(b). As the waveform peak is below 0.004, it does not cross the set threshold; hence, no AS is generated.
Similarly, a 15 kVAR inductive load is attached at PCC using CB4. The impact of inductor load swapping has a negligible impact on the waveform, as shown in Figure 14(b), so the waveform is below the threshold and does not generate any AS. In terms of accuracy and dependability, the suggested IDM performs well in 3-phase load swapping, capacitor swapping, and inductor load swapping scenarios.
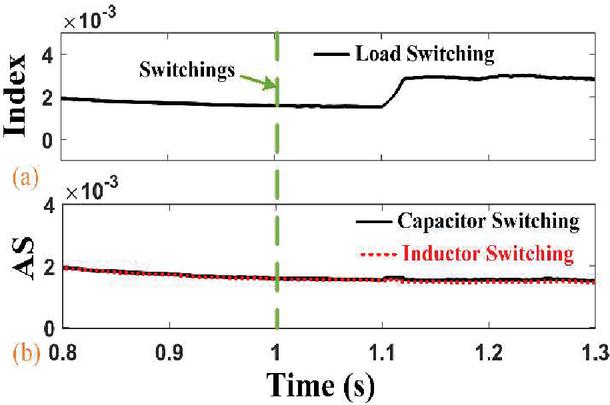
Figure 14 Index waveform for (a) load swapping, (b) capacitor and inductor switching.
3.11 Results for Non-linear Load Verification
Nowadays, the use of electronic equipment such as laptops, UPS, printers, and power electronics switch-based appliances has increased regularly. These types of equipment generate harmonics in the system. Such circumstances lead to the detection of erroneous islanding. To verify such a situation, a non-linear, 3-phase, full-wave diode rectifier with a load capacity of 4.6 kW is attached at PCC-632. The verification is carried out in a non-islanding situation. The waveform after tripping CB at 1 s does not change much, as seen in Figure 15. As the index waveform reaches up to 0.00219, it is below the threshold (20); hence, no AS is generated.
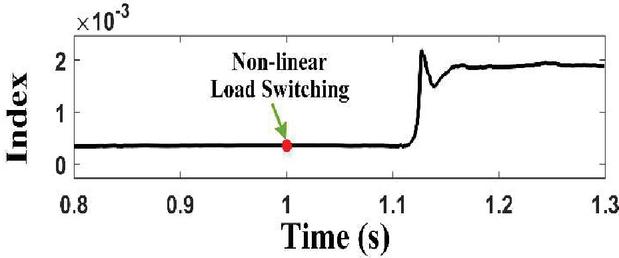
Figure 15 Index waveform for non-linear load swapping.
3.12 Results for Feeder Disconnection
The proposed IDM’s There is a possibility of disconnecting any feeder due to any circumstances. So, verification of feeder disconnection is required for the proposed IDM. For this, feeder disconnection is verified in the non-islanding situation. Node-684 is isolated at 1 s from the microgrid system using CB. The waveform does not cross the set threshold for the entire simulation, so no AS is generated, as shown in Figure 16. The verification is found accurate in the feeder disconnection.
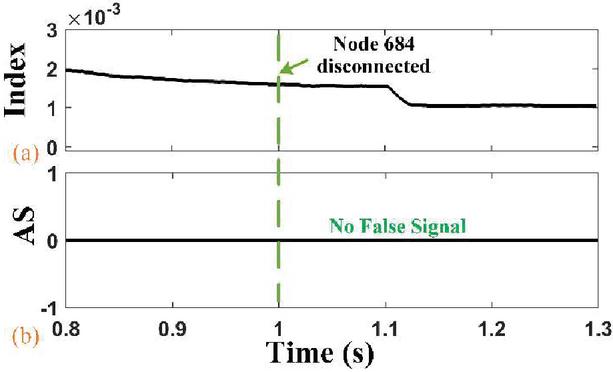
Figure 16 Index waveform for feeder disconnection and AS.
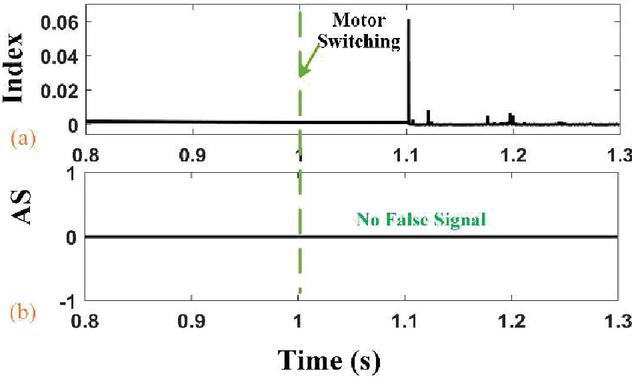
Figure 17 Index waveform for motor swapping and AS.
3.13 Results for Effect of Motor Switching
In the distribution test system, a 460 HP motor load is switched at 1 s to assess the effectiveness of the suggested approach. Figure 17 shows that the index is not greater than the threshold value of 20. As a result, it cannot recognize islanding. An instance of non-islanding occurs when the motor load is switched.
4 Discussion of OPAL-RT Results
The new method has been put into practice. The outcomes have been confirmed using the OPAL RT real-time simulator (OP4510) in the real-time lab. To validate the design was carried out in MATLAB/Simulink on a desktop computer in the lab (Intel Core i8 8600 CPU @ 3.20 GHz/3.19 GHz, RAM 16.0 GB, operating system 64-bit). The setup of the OPAL RT lab for real-time validation is illustrated in Figure 18. Certain MATLAB/Simulink processes must be followed before running the model on a real-time OPAL RT simulator. The three subsystems that make up the model – the SM_master, SS_slave, and SC_console subsystems – each function within a simulator core. Based on model requirements and hardware capabilities, a fixed-time solver selection type is chosen to enable model execution. Subsequently, the system model is run in RT Lab to confirm the effectiveness of the proposed method on a real-time simulator. An analog output interface card (AOIC), with 16 channels is employed to connect the RT Lab box with an oscilloscope. The actual outcome of the suggested method is saved in a Tektronix MDO3014 mixed domain oscilloscope with four channels (input 100 MHz) depicted in Figure 18.
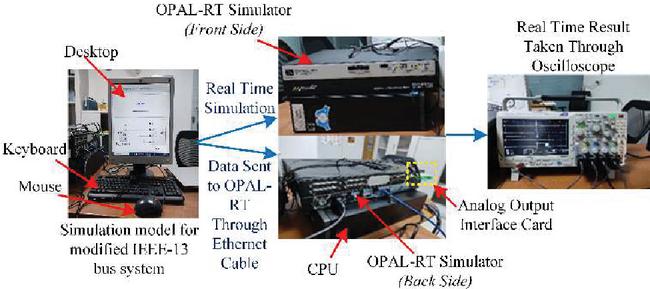
Figure 18 Opal-RT laboratory setup.
The Opal-RT verification result is provided in Figure 19. The ZPM condition is considered for Opal-RT verification. The ZPM index and AS signal plotted by Opal-RT are similar to the simulation result (Figure 4). The islanding detection time for the real-time simulator is 125 ms, which is considerable as the situation time is 122.6 ms. Thus, the real-time verification was also found to be accurate.
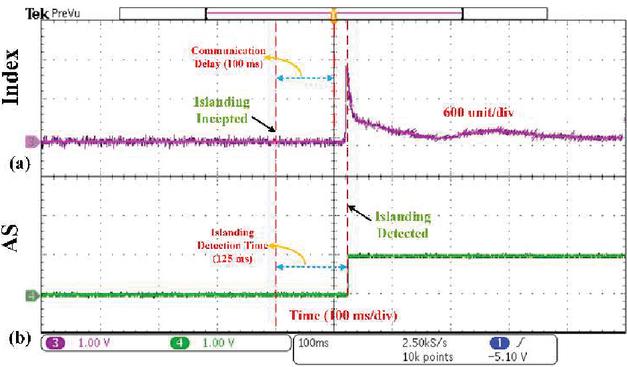
Figure 19 Opal-RT result for ZPM condition (a) index and (b) AS.
5 Conclusions
A communication-based passive IDM is suggested in this article to discriminate between islanding and grid-connected modes. Positive sequence voltage and current at the PCC and DG junction are calculated for further calculation of the correlation element, which is considered as an index of the proposed method. The index is compared with a set threshold that confirms the islanding or grid-connected mode. The proposed technique is verified for the ZPM condition, where many techniques fail to detect islanding. The verification of APM, RPM, QFs, unbalanced load, irradiance change, DG disconnection, and weak grid in islanding situations are found to be accurate and satisfactory as per IEEE 1547 std. and 929-2000 std. The non-islanding verifications, such as different faults, capacitor and inductor swapping, non-linear load swapping, feeder disconnection, and motor swapping, are also tested and confirm the efficacy of the proposed technique and haven’t provided any false signals. The Opal-RT hardware implementation also performed well and was found satisfactory. The proposed IDM has only a 123.5 ms islanding detection time in the ZPM case, which is faster than many existing techniques.
References
[1] N. Tadikonda, J. Kumar, R. N. Mahanty, ‘A technique for detection of islanding in a microgrid on the basis of rate of change of superimposed impedance (ROCSI)’, Electric Power Systems Research, 206, 107838, 2022. https://doi.org/10.1016/j.epsr.2022.107838.
[2] C. R. Reddy, K. H. Reddy, ‘Islanding detection techniques for grid integrated distributed generation-A review’, International Journal of Renewable Energy Research, 9(2), pp. 960–977, 2019. https://doi.org/10.20508/ijrer.v9i2.9371.g7661b.
[3] D. G. Photovoltaics, E. Storage, ‘IEEE standard for interconnection and interoperability of distributed energy resources with associated electric power systems interfaces’, IEEE Std, pp. 1547–2018, 2018. https://doi.org/10.1109/IEEESTD.2018.8332112.
[4] X. Zhaoxia, G. Zhijun, J. M. Guerrero, F. Hongwei, ‘SCADA system for islanded DC microgrids’, In: IECON 2017 – 43rd Annual Conference of the IEEE Industrial Electronics Society, pp. 2669–2674, 2017. https://doi.org/10.1109/IECON.2017.8216449.
[5] B. Dob, C. Palmer, ‘Communications assisted islanding detection: contrasting direct transfer trip and phase comparison methods’, In: 71st Annual Conference for Protective Relay Engineers (CPRE), College Station, TX, pp. 1–6, 2018. https://doi.org/10.1109/PRE.2018.8349783.
[6] A. Bharatee, M. Mishra, B. B. Pati, ‘Anti-islanding protection by power line signaling and wavelet transform’, In: 2019 Global Conference for Advancement in Technology (GCAT), Bangaluru, India, pp. 1–5, 2019. https://doi.org/10.1109/GCAT47503.2019.8978428.
[7] A. Sankar, R. Sunitha, ‘Synchrophasor data driven islanding detection, localization and prediction for microgrid using energy operator’, IEEE Transactions on Power Systems 36(5), pp. 4052–4065, 2021. https://doi.org/10.1109/TPWRS.2021.3060763.
[8] S.R. Samantaray, I. Kamwa, G. Joos, ‘Phasor measurement unit based wide-area monitoring and information sharing between micro-grids’ IET Generation Transmission Distribution, 11(5), pp. 1293–1302, 2017. https://doi.org/10.1049/iet-gtd.2016.1419.
[9] A. Bharatee, M. Mishra, B.B. Pati, ‘Anti-islanding protection by power line signaling and wavelet transform’ In: 2019 Global conference for advancement in technology (GCAT). IEEE, pp. 1–5, 2019. https://doi.org/10.1049/iet-gtd.2016.1419.
[10] D. Reigosa, F. Briz, C. Blanco, P. García, J.M. Guerrero, ‘Active islanding detection for multiple parallel-connected inverter-based distributed generators using high-frequency signal injection’ IEEE Transactions on Power Electronics, 29(3), pp. 1192–1199, 2013. https://doi.org/10.1109/ECCE.2012.6342534.
[11] K. Jia, H. Wei, T. Bi, D.W. Thomas, M. Sumner, ‘An islanding detection method for multi-DG systems based on high-frequency impedance estimation’, IEEE Transactions on Sustainable Energy, 8(1), pp. 74–83, 2013. https://doi.org/10.1109/TSTE.2016.2582846.
[12] M.W. Altaf, M.T. Arif, S. Saha, S.N. Islam, M.E. Haque, ‘Effective ROCOF-based islanding detection technique for different types of microgrid’, IEEE Transactions on Industry Applications, 58(2), pp. 1809–1821, 2022. https://doi.org/10.1109/IAS48185.2021.9677270.
[13] D.A. Asoh, L.N. Chia, ‘Design and implementation of an automatic over/undervoltage protection system for single-phase low voltage power lines’, Journal of Power Energy Engineering, 10(8), pp. 12–25, 2022. https://doi.org/10.4236/jpee.2022.108002.
[14] J. Xing, L. Mu, ‘A new passive islanding detection solution based on accumulated phase angle drift’, Applied Sciences, 8(8), 1340, 2018. https://doi.org/10.3390/app8081340.
[15] M.R. Alam, K.M. Muttaqi, and A. Bouzerdoum, ‘A multifeature-based approach for islanding detection of DG in the subcritical region of vector surge relays’, IEEE Transactions on Power Delivery, 29(5), pp. 2349–2358, 2014. https://doi.org/10.1109/TPWRD.2014.2315839.
[16] M. Usman, S. Raza, H.M. Munir, M. Riaz, S.S.H. Bukhari, J.S. Ro, ‘Novel passive islanding detection technique by monitoring reverse power at PCC’, International Transactions on Electrical Energy Systems, 2022. https://doi.org/10.1155/2022/9971609.
[17] A.A. Chandio, J. Laghari, S. Khokhar and S.A. Almani, ‘A new islanding detection technique based on rate of change of reactive power and radial basis function neural network for distributed generation, Journal of Intelligent & Fuzzy Systems, 37(2), pp. 2169–2179, 2019. https://doi.org/10.3233/JIFS-181849.
[18] M. Kumar, and J. Kumar, ‘A Solution to Islanding Event Detection Using Superimposed Negative Sequence Components-Based Scheme. Arabian Journal for Science and Engineering, 48(11), pp. 14639–14653, 2023. https://doi.org/10.1007/s13369-023-07787-9.
[19] S.R. Samantaray, I. Kamwa, G. Joos, ‘Phasor measurement unit based wide-area monitoring and information sharing between micro-grids’, IET Generation Transmission Distribution. 11(5), pp. 1293–1302, 2017. https://doi.org/10.1049/iet-gtd.2016.1419.
[20] G.P. Kumar, P. Jena, ‘Active slip frequency-based islanding detection technique for grid-tied inverters’ IEEE Transactions on Industrial Informatics., 16(7), pp. 4615–4626, 2020. https://doi.org/10.1109/TII.2019.2949009.
[21] G.P. Kumar, P. Jena, ‘Pearson’s correlation coefficient for islanding detection using micro-PMU measurements’, IEEE System Journal, 2021. https://doi.org/10.1109/JSYST.2020.3021922.
[22] S. Dutta, P.K. Sadhu, M.J.B. Reddy, D.K. Mohanta, ‘Smart inadvertent islanding detection employing p-type PMU for an active distribution network’, IET Generation Transmission Distribution, 12(20), pp. 4615–4625, 2018.
[23] R. Sun, V.A. Centeno, ‘Wide area system islanding contingency detecting and warning scheme’, IEEE Transactions on Power Systems, 29(6), pp. 2581–2589, 2014.
[24] R. Nale, M. Biswal, N. Kishor, ‘A passive communication-based islanding detection technique for AC microgrid’, International Journal of Electrical Power & Energy Systems, 137, 107657, 2021.
[25] V.R. Reddy, E.S. Sreeraj, ‘A feedback-based passive islanding detection technique for one-cycle-controlled single-phase inverter used in photovoltaic systems’, IEEE Transactions Industrial Electronics, 67(8), pp. 6541–6549, 2019.
[26] N. Liu, C. Diduch, L. Chang, J Su, ‘A reference impedance based passive islanding detection method for inverter-based distributed generation system, IEEE J Emerg Sel Top Power Electron, 3(4), pp. 1205–1217, 2015.
[27] S. Raza, H. Mokhlis, H. Arof, J.A. Laghari, H. Mohamad, ‘A sensitivity analysis of different power system parameters on islanding detection’, IEEE Transactions on Sustainable Energy, 7(2), pp. 461–470, 2015.
[28] Y.M. Makwana, B.R. Bhalja, ‘Experimental performance of an islanding detection scheme based on modal components’, IEEE Transactions on Smart Grid, 10(1), pp. 1025–1035, 2017.
[29] B.K. Chaitanya, A. Yadav, M. Pazoki, ‘An advanced signal decomposition technique for islanding detection in DG system’, IEEE Systems Journal, 15(3), pp. 3220–3229, 2020.
[30] A. Yazdani, R. Iravani, ‘Voltage-sourced converters in power systems: modeling, control, and applications’, Wiley, New York, 2010.
[31] R. Mahmud, A. Hoke, D. Narang, ‘Validating the test procedures described in UL 1741 SA and IEEE P1547. 1.’, In: 2018 IEEE 7th world conference on photovoltaic energy conversion (WCPEC) (A joint conference of 45th IEEE PVSC, 28th PVSEC & 34th EU PVSEC). IEEE, pp. 1445–1450, 2018.
[32] X. Xie, W. Xu, C. Huang, X. Fan, ‘New islanding detection method with adaptively threshold for microgrid’ Electric Power Systems Research, 195, 107167, 2021.
[33] X. Xie, C. Huang, D. Li, ‘A new passive islanding detection approach considering the dynamic behavior of load in microgrid’ International Journal of Electrical Power & Energy Systems, 117, 105619, 2020.
[34] G. Marchesan, M.R. Muraro, G. Cardoso, L. Mariotto, A.P. De Morais, ‘Passive method for distributed-generation island detection based on oscillation frequency’ IEEE Transaction on Power Delivery, 31(1), pp. 138–146, 2015.
[35] X. Chen, Y. Li, P. Crossley, ‘A novel hybrid islanding detection method for grid-connected microgrids with multiple inverter-based distributed generators based on adaptive reactive power disturbance and passive criteria’ IEEE Transaction on Power Electronics 34(9), 9342–9356, 2019. https://doi.org/10.1109/TPEL.2018.2886930.
[36] P. Bezawada, P.O. Yeddula, V.R. Kota, ‘A new time domain pas sive islanding detection algorithm for hybrid distributed generation systems’, International Transactions on Electrical Energy Systems 2020. https://doi.org/10.1002/2050-7038.12632.
[37] A.G. Abd-Elkader, S.M. Saleh, ‘Zero non-detection zone assessment for anti-islanding protection in rotating machines based distributed generation system’, Int. J. Energy Res. 2020. https://doi.org/10.1002/er.5705.
[38] Y. Gao, J. Ye, ‘Improved slip mode frequency-shift islanding detection method’ In: 2019 International Conference on Virtual Reality and Intelligent Systems (ICVRIS), pp. 152–155, 2019. https://doi.org/10.1109/ICVRIS.2019.00045.
[39] O.H. Gupta, M. Tripathy, V.K. Sood, ‘Islanding detection scheme for converter-based DGs with nearly zero non-detectable zone’, IET Generation Transmission Distribution. 13(23), 5365–5374, 2019. https://doi.org/10.1049/iet-gtd.2018.5168.
[40] G. Wang, F. Gao, J. Liu, Q. Li, Y. Zhao, ‘Design consideration and performance analysis of a hybrid islanding detection method combining voltage unbalance/total harmonic distortion and bilateral reactive power variation’, CPSS Transactions on Power Electronics and Applications, 5(1), pp. 86–100, 2020. https://doi.org/10.24295/CPSSTPEA.2020.0008.
[41] R. Mahmud, A. Hoke, D. Narang, ‘The test procedures described in UL 1741 SA and IEEE P1547.1’, In: 2018 IEEE 7th World Conference on Photovoltaic Energy Conversion (WCPEC) (A Joint Conference of 45th IEEE PVSC, 28th PVSEC & 34th EU PVSEC), pp. 1445–1450, 2018. https://doi.org/10.1109/PVSC.2018.8547346.
Biographies

Sanjeev Ranjan received his Bachelor’s degree from Integral University, Lucknow India, in 2012 and the Master’s from Motilal Nehru National Institute of Technology Allahabad, Prayagraj, India, in 2014. He was an Assistant Professor in Gaya College of Engineering, Gaya, India from Jan. 2018 to June 2022. He is currently an Assistant Professor in the Department of Electrical Engineering, Government Engineering College Jehanabad, India. His research interests include power system protection, Power Electronics and Power Control for renewable energy source applications.

Munna Kumar received his B.Tech degree in Electrical and Electronics Engineering (EEE) from the School of Engineering & Technology, Paralakhamundi, M.Tech and Ph.D from the National Institute of Technology, Jamshedpur, India. He is currently working as an Assistant Professor & Head of the Department of Electrical Engineering at Alamuri Ratnamala Institute of Engineering and Technology (ARMIET), Shahapur, Thane, Maharashtra.

Jitendra Kumar obtained Bachelor of Technology from UP Technical University, Master of Technology from National Institute of Technology, Kurukshetra and Doctor of Philosophy from Indian Institute of Technology, Roorkee. Dr. Kumar is an Assistant Professor in the Department of Electrical Engineering, National Institute of Technology Jamshedpur. He was Assistant Professor in the department of Electrical & Electronics Engineering at BITS Pilani, (Goa Campus), Teaching associate in Electrical Engineering Department at NIT Uttarakhand. He was guest faculty in Electrical Engineering Department at MNIT Allahabad, India. His research area is related to deregulated electricity market, islanding detection microgrid, and adaptive relaying algorithm design for power system protection including FACTS.

R. N. Mahanty received his B.Sc. (Engg.) degree in Electrical Engineering from VSSUT Burla (Formerly UCE Burla), India, in 1985, M.Tech degree in Power Systems from NIT Jamshedpur (formerly known as RIT Jamshedpur), India in 1988, and a Ph.D. degree in Electrical Engineering from IIT, Kharagpur, India in 2003. Currently, he is working as Professor at the National Institute of Technology, Jamshedpur, India, in the Department of Electrical Engineering. His areas of interest are digital relaying schemes, islanding detection techniques for the microgrid, and recent advances in electric vehicles.

Vijay K. Sood obtained his Ph.D. from the University of Bradford, England in 1977. From 1976–2007, he was employed as a Senior Researcher at IREQ (Research Institute of Hydro-Québec) in Montreal. Since 2007, he has been a Professor at Ontario Tech University, Oshawa. Canada. From 2012–2018, he was the NSERC-OPG Design Engineering Co-Chair. He served as the Chair of the Department of Electrical and Software Engineering for two years (2021–23), Director of the Power Workers Union Smart Grid and EV Research Laboratory and the Principal Investigator for the Panasonic-UOIT Microgrid. His research interests are in the monitoring, control, and protection of HVDC and FACTS power systems. He has published over 200 articles in journals and conferences and written numerous books and book chapters. He is a member of the Professional Engineers of Ontario, a Life Fellow of the IEEE, Fellow of the Engineering Institute of Canada, and Emeritus Fellow of Canadian Academy of Engineers. He is presently the Editor-in-Chief of the Journal Distributed Generation & Alternative Energy.
Distributed Generation & Alternative Energy Journal, Vol. 40_2, 427–456.
doi: 10.13052/dgaej2156-3306.4029
© 2025 River Publishers