Study of Optimization of Economic Law on the Market Structure of New Energy Under the Background of Sustainable/Green Finance
Fengyun Liu1,*, Zhengzhang Zhang, Menglan Song and Jinguang Chen
1School of Finance and Accounting, Anhui Sanlian University, Hefei 230001, China
2Wang Jian Law School, Soochow University, Suzhou, 215006, China
3Credit Approval Department, Anhui Branch of China Construction Bank, Hefei 230001, China
E-mail: liufengyun 2020@163.com; fengyun_liu82@outlook.com
*Corresponding Author
Received 26 May 2025; Accepted 23 June 2025
Abstract
The integration of sustainable/ green finance within economic frameworks has become increasingly pivotal in driving environmentally conscious practices across enterprises, particularly within new energy markets. This study explores the optimization of economic law on the market structure of new energy within the context of sustainable finance. With the imperative to transition towards sustainable energy sources becoming increasingly urgent, understanding the interplay between economic regulations, financial mechanisms, and market dynamics is crucial. Employing multilinear regression analysis, we investigate the impact of economic law variables and sustainable finance metrics on the market structure of new energy. Through the construction of a Sobels model test, this paper seeks to comprehensively analyze the influence paths of green finance on the optimization of the market structure for new energy through the mediating effect of economic regulation. The empirical consequences of this study show that the complementary role of economic regulation impacts the potential of green finance to drive market structural improvements in the new energy sector. Also, this study employs proposed multiple linear regression analysis to explore the drivers of market dynamics in the new energy sector, with a focus on optimizing economic laws to support sustainability objectives. By broadening the scope of inquiry into the transformation of new energy enterprises, these findings offer both theoretical insights and practical guidance. The research underscores the significance of aligning financial mechanisms, regulatory frameworks, and green energy consumption to facilitate the transition towards a more sustainable and resilient market structure for new energy enterprises in China.
Keywords: Green finance, sustainable finance, new energy markets, green energy consumption, economic regulations, proposed multiple regression analysis.
1 Introduction
It is more important than ever to combat climate change and make the switch to renewable energy sources. More countries are realizing the need of sustainable financing in facilitating the transition from climate change to lower carbon emissions and lessen its effects. Sustainable finance is a vital part of addressing global climate change and supporting economic development, as it channels capital to environmental and socially responsible firms, predominantly renewable energy. It employs different mechanisms, including loans, green bonds and insurance, which support a strategy that lowers carbon emissions, guilt margins of innovation and reduces exposure to financial risk. Sustainable finance represents efficiency of the market, timber of technical innovation and frameworks for regulatory policy by bridging financial institutions with environmental objectives. Sustainable finance also assists in achieving balanced regional economic development and agronomics new energy market structures. Sustainable finance encompasses a range of financial mechanisms and strategies aimed at promoting environmental sustainability, social responsibility, and good governance within the financial sector. Central to the transition toward sustainable energy is the development of new energy markets, characterised by the emergence of innovative technologies and business models. However, the structure of these markets is significantly influenced by economic laws and regulations that shape investment incentives, market competition, and innovation. Thus, speeding the shift to a low-carbon economy requires optimizing economic legislation to enable the emergence of new energy markets against the backdrop of sustainable finance.
Green finance, defined as financial products and investments that promote environmentally sustainable development, has gained traction as a key mechanism for mobilizing capital towards clean energy projects and technologies [1]. Concurrently, economic regulations play a pivotal role in shaping market behavior and ensuring compliance with environmental standards and objectives [2]. The interplay between green finance and economic regulation within the new energy sector in China is tcharacterisedby a complex and dynamic relationship, with implications for moptimising arket structure oand achievingsustainable growth outcomes. The convergence of renewable energy and sustainable finance necessitates innovative approaches to optimize market structures, and machine learning (ML) as well as deep learning (DL) algorithms offer promising solutions. ML algorithms leverage historical data to forecast market trends and inform investment decisions, while DL algorithms analyze diverse datasets to mitigate risks associated with renewable energy investments.
Additionally, these algorithms optimize energy production and distribution, personalize renewable energy offerings, and evaluate policy effectiveness, thereby accelerating the transition towards a sustainable energy future. This study makes several contributions to this field. Initially, it validates the notable positive impact of sustainable financing on the optimisation of China’s new energy market structure. Secondly, it differs from other studies in that it employs an index technique for evaluating green finance, which is based on many characteristics, to analyze the typical facts of green or sustainable finance and market structure optimization in China. This creates a new, comprehensive approach to assessing green finance. Thirdly, by using new energy firms as the study subjects and the symbolic meanings of green finance, it offers fresh perspectives on the direct and indirect influence channels of consumption of green energy and green financing on the market structure optimization.
This study focuses on employing multiple linear regression analysis to explore the intricate relationship between economic laws, market structure, and sustainable finance in the new energy sector. By harnessing the power of statistical modelling, we aim to uncover the underlying factors driving market dynamics and identify opportunities to optimise economic laws in alignment with sustainability objectives. The research questions to be concerned in this work are listed below:
RQ1: Does green/sustainable finance influence the optimization of China’s new energy market structure?
RQ2: Does green energy consumption improve new energy market structure optimization?
RQ3: Does exposure to green finance mechanisms impact the market performance and sustainability outcomes of new energy enterprises?
In the subsequent section, a review of pertinent literature is conducted, followed by the formulation of our hypotheses. Chapter 3 is dedicated to elucidating the proposed methodology, wherein we expound upon the models that underpin our analysis and elucidate the variables utilized in estimation. Subsequently, in Chapter 4, we summarise our primary findings and conduct various assessments to evaluate their resilience. Finally, Chapter 5 presents a discussion of our findings, concluding with implications drawn from the study.
2 Literature Review
In 2023, Sheng Zeng et al. [3] proposed an optimisation path obtained by building a multi-dimensional dynamic support vector machine model (SSA-MFD-SVR-ARIMA) using the sparrow algorithm to predict the percentage of Chongqing’s energy structure under the influence of green finance development from 2021 to 2030. This model utilised the Copula function and Granger causality to identify the energy structure that impacted the elements. The results of the new study verify that: (1) Green Finance optimizes Chongqing’s energy structure at a correlated rate of 10.8%; and (2) If Green Finance keeps growing at its current rate of 4.5%, by 2030, non-fossil energy will account for 27% of total energy consumption and coal 40%. It certifies Chongqing’s capacity to meet the goals set forth in the Central Government’s 2025 Energy Development Plan. The paper proposes a four-dimensionally optimal financial pathway that includes green equity investments, digital energy finance, financing environmental rights and interests, and industrial fund development. Additionally, the authors proposed safeguard techniques for this pathway optimization’s financing, innovation, connection, and protection mechanisms. Kumar et al. [4] examined the balanced integration of wind and solar energy to enhance environmental sustainability through optimised performance. This approach is adopted in our proposed work to guide the optimisation of economic laws and market structures for new energy systems under green finance, which supports the development of a balanced, policy-driven energy market that promotes clean energy investment and environmental benefits.
In 2022, Sameh Mahjoub et al., [5] developed and compared three distinct machine learning methods for the purpose of forecasting time series power. The Gated Recurrent Unit (GRU), Drop-GRU, and Long Short-Term Memory (LSTM) were the models that being suggested. As our time series dataset, the power usage data was used to inform the projections. For this reason, the LSTM neural network was selected to predict future load demand and prevent consumption peaks. The work by Deevi et al. [6] presented the influence of the digital economy on industrial structure upgrading and sustainable entrepreneurial growth by promoting structural transformation. Our proposed work leverages this structural optimization approach to reform economic laws governing the new energy market structure under sustainable/green finance. This integration improves industrial rationalisation, stimulates innovation, and supports the sustainable development of the green energy sector. The authors carried out numerous tests using real data on electricity use in different French cities in order to provide a comprehensive evaluation of this strategy. Experimental results over a range of time horizons demonstrate that the LSTM model outperforms the GRU and Drop-GRU forecasting algorithms. Its precision was higher and its prediction mistakes were lower. As a result, these LSTM-based projections were enabled to plan ahead and initiate load shedding when consumption above the permitted threshold. Planning for power quality and equipment maintenance was greatly impacted by this.
In 2023, Avik Sinha et al. [7] examined the inter-quantile relationship between the production of renewable energy and green funding from January 1985 to December 2020. A novel technique called “Multivariate Quantile-on-Quantile Regression” (m-QQR) was also introduced by this study. The results of the study indicate that there is inter-quantile dependence and that external moderating factors influence the impact of green money on the generation of renewable energy. The policy framework recommended by the report is intended to help the United States accomplish the Sustainable Development Goals. Pandey et al. [8] demonstrate that optimising renewable energy integration using advanced algorithms can significantly reduce fuel costs and support sustainable energy goals. These results offer valuable insights for enhancing market structures and economic policies within green finance frameworks. The technical study by Yangbing et al. [9] ensures the stability of wind power systems, supporting reliable energy delivery. This stability is crucial for developing effective economic laws and market structures in new energy sectors. Together, they align under green finance by combining technical reliability with policy and financial support for sustainable energy development. A hybrid PSOGSA algorithm to optimize the sizing of Distributed Generation (DG) units in power systems, aiming to enhance efficiency, reduce energy losses, and improve economic performance emphasized by Prasad, et al., [10]. By integrating the strengths of PSO and GSA, the algorithm achieves effective placement and operation of DG units. The approach supports sustainable energy integration and aligns with efforts to optimize economic laws and market structures under the framework of green finance. Our proposed study on optimising economic law for the market structure of new energy under sustainable finance leverages the cloud-based financial modelling strategy presented by Bobba [11] to enhance the responsiveness and efficiency of economic regulatory frameworks, promote dynamic capital allocation, and strengthen policy support for sustainable energy transitions. The study by Boyapati [12] examines digital finance as a tool for improving income equality across diverse economies. I adopted this strategy to refine economic regulations for new energy markets within a sustainable finance framework. This method enriches inclusiveness and efficiency in energy market structures.
Amidst the backdrop of global climate change, regional pollution, and energy depletion, the United Nations introduced the concept of “green” during international forums in the 1980s, advocating for the establishment of a “green” industrial system to foster sustainable economic growth [13, 14]. As comprehension deepened regarding economic actions, energy consumption, and pollution emissions, addressing the dual challenges of economic growth and environmental sustainability emerged as a focal point of economic inquiry. Consequently, new research paradigms such as green growth, green transformation, and green development were proposed [15]. The panel data analysis method, as proposed by Boyapati and Kaur [16], is incorporated into our work to assess the impact of green finance on new energy market optimization. This strategy helps identify regional disparities and supports the design of equitable and sustainable energy policies. With a growing public consciousness regarding environmental protection and stricter environmental regulations, industrial restructuring is increasingly constrained. Thus, promoting the ecological development of industrial structures has become pivotal for achieving green and low-carbon development [17]. Urgently addressing global climate change necessitates promoting the ecological transformation of industrial structure, reducing the reliance on fossil energy sources like coal, and mitigating carbon dioxide emissions [18]. From a macro perspective, industrial structure optimization primarily focuses on changes in industrial composition and incorporation with the theory of value chains, reflecting societal-wide industrial market structure optimization through shifts in the segment of each industry.
2.1 Theoretical Underpinnings
2.1.1 Green finance mechanisms
Green finance has become a crucial component of China’s economic transition, with supply-side reform assuming increasing significance. The emergence of efficient and green industrial structures is underway, heralding imminent growth in the industrial landscape. Green finance primarily facilitates the optimization and advancement of industrial market structures through the following mechanisms [19]. The relationship between green finance and market structure optimization is grounded in several economic theories. Capital allocation theory suggests that green finance directs resources efficiently toward sustainable sectors enhancing growth in renewable energy industries. Signalling theory highlights how green financial instruments reduce information asymmetry, boosting investor confidence and market transparency. Risk diversification theory supports the role of green finance in spreading financial risks, encouraging investment in high risk but environmentally beneficial projects. Regulatory economics emphasizes the mediating role of government oversight in ensuring that financial flows align with environmental goals and fair competition. Industrial organization theory explains how green finance fosters market restructuring through increased competition and innovation.
Green finance primarily promotes capital development as a means of enabling the optimization and advancement of industrial market structure. Financing constitutes a central aspect of modernizing market structures. Financial markets serve as conduits for gathering surplus capital from savings, directing these funds towards specific sectors or institutions, thereby generating capital for industrial development [20]. Using financial tools including sustainable bonds, environmental funds, and green loans, green finance directs investment into environmentally friendly sectors of the economy. It promotes corporate reorganization by affecting the micro-level distribution of resources across businesses. This strategy allows businesses to contribute to “green value-added” by funding and lowering finance costs for “green” entrepreneurs. Consequently, enterprises expand their market size, enhance market competitiveness, and accelerate industrial expansion and development [21]. The second mechanism operates through information transmission. Within the green financial system, instruments such as green loans, equity, or financial ties serve as signals to the market, prompting enterprises to invest in the green industry [22]. This signalling impact lowers shareholders’ perceived danger concerning future efforts to protect the environment, as does the uncertainty that comes with lowering the use of personal funding. Consequently, the transmission of information facilitates a conducive environment for investments in green initiatives while reducing investors’ risk exposure [23].
The third mechanism involves a risk-diversification approach. Emerging businesses, such as those focused on ecological protection, energy preservation, and new energy, often entail larger scales and higher risks. When enterprises bear excessive risks independently, their inclination to operate as “green enterprises” may diminish. The financial market serves as a mechanism for redistributing risk [24, 25], thereby altering the trajectory of risk-averse investments. By injecting capital into the ecological business and initiating adjustments, the financial market enables enterprises to manage and mitigate their commercial and investment hazards effectively, thus contributing to the modernization of industrial structures. The fourth part device operates through resource allocation. Green finance exerts a positive influence on resource allocation within the new energy market, thereby enhancing market dynamics. Research highlights the pivotal role of green finance in optimizing resource allocation within the new energy sector. By providing financial tools such as loans, green bonds, and funds, green finance channels investment into renewable energy projects and sustainable initiatives. This targeted allocation of financial resources enables companies in the new energy market to access capital for expansion, research, and development. Moreover, green finance mitigates financial barriers and risks associated with new energy ventures. Through risk-sharing mechanisms and the transmission of information, green finance fosters investor confidence in new energy projects, thereby facilitating capital inflows into the sector. This increased capital availability enables firms to invest in innovative technologies, scale up production, and enhance operational efficiency, ultimately leading to optimised market dynamics. The incorporation of green finance into the new structure of the energy market promotes the shift towards a low-carbon economy by channeling funds into clean energy projects. It makes markets more efficient through superior resource allocation and investment risk reduction, making renewable business more appealing. Green finance promotes technological innovation and helps to upgrade industry structures towards cleaner, high-tech sectors. Economically strengthened regulation, coupled with it, makes an enabling policy-financial environment that serves to compel adherence to environmental targets. The coupling also enhances transparency and investor confidence. It connects financial and regulatory architectures to convergence with sustainability targets.
2.1.2 Conceptual model
Green finance has a beneficial impact on various aspects of the new energy market, ultimately leading to optimised market dynamics. Firstly, by facilitating capital formation, green finance enables the allocation of funds towards renewable energy projects and sustainable infrastructure development [26]. This financial inflow enhances market dynamics by fostering innovation, stimulating investment activity, and expanding the adoption of renewable energy. Secondly, green finance plays a crucial role in improving information transmission within the new energy market by promoting transparency and sustainability reporting standards [27, 28]. This leads to better-informed decision-making among investors and stakeholders, contributing to market efficiency and optimization. Additionally, green finance contributes to risk diversification by supporting a diverse portfolio of clean energy assets, which helps mitigate sector-specific risks and enhances market resilience [29]. Furthermore, by directing investment towards environmentally sustainable projects, green finance optimizes resource allocation in the new energy market, aligning financial flows with long-term sustainability objectives and driving market efficiency. Lastly, economic regulation acts as a mediator by providing the necessary framework and incentives to support green finance initiatives and ensure the effective integration of sustainability considerations into market dynamics. All things considered, green financing, combined with economic regulation, creates a favourable atmosphere for sustainable investment and innovation, which in turn optimises the new energy market structure. Economic regulations play a crucial mediating role in linking green finance with market dynamics, especially in the new energy sector. This provide the legal and policy framework needed to direct financial resources toward sustainable projects. By providing incentives and enforcing compliance these regulations reduce investment risks and improve transparency. This encourages greater investor participation and more efficient capital allocation. Economic regulations also gives innovation and the upgrading of industrial structures. They support rationalization by ensuring balanced resource use across sectors. Throughout the mechanisms regulations strengthen the impact of green finance on market transformation. The proposed conceptual paradigm is depicted in Figure 1.
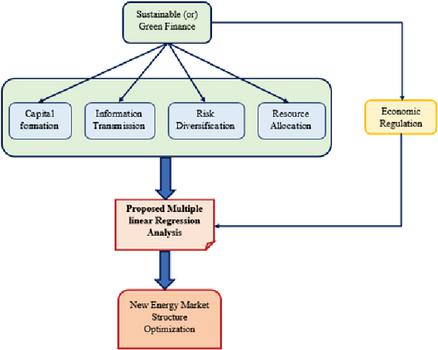
Figure 1 Proposed conceptual model.
The dual-dimensional approach to industrial structure optimization focuses on rationalization and advancement, ensuring efficient resource allocation across sectors and economic modernization through a shift from primary to higher-value tertiary industries. This approach aligns with efficiency and innovation goals. In green finance and new energy markets, rationalization is measured by Theil index and advancement by sectoral hierarchy. Green finance, mediated by economic regulation, enhances both rationalization and advancement, promoting sustainable and competitive industrial transformation.
3 Proposed Methodology
3.1 Data Collection
The empirical analysis in this work is based on a panel dataset including thirty Chinese provinces from 2012 to 2020. This study’s sample span was determined to be from 2012 to 2020. As the “12th Five-Year Program for the National Environment Protection Guidelines and Environmental and Economic Policy” was released by China’s Ministry of Environmental Protection in November 2011, aggressively exploring green financing is the reason for this. Since then, the Chinese colour economics policy framework has undergone constant improvement, and the country has progressively developed a new paradigm for financing green growth. We thus choose to evaluate the effect of green development financing on the structure of enterprise optimization by setting an observation time frame for 2012 to 2020. The China Insurance Yearbook, China Industrial Statistical Annual publication, and China Statistical Handbook spanning the years 2013–2021 are the main sources of data used in this study.
3.2 Measuring the Development of National Green Finance
3.2.1 Entropy weight approach
The entropy weight method enhances classic weighting techniques by allocating weights objectively based on data variability, hence minimizing subjectivity. It emphasizes indicators with higher informative value, evaluating green finance development more responsive to real-world developments. By combining several variables such as investment, insurance, green credit, and government support into a composite index, it allows for a more thorough and comparable assessment across regions, sustainable planning and increasing policy analysis. The most reliable approach to assigning weight to indicators is the entropy weight technique, which takes into account each indicator in its entirety. The following are the steps involved in the entropy weight method calculation. If n items need to be evaluated, the forward transformation matrix produced by M evaluation indicators looks like this:
Let Z be the normalized matrix, and stand for the components of column j and row i in X: For both negative and positive indicators, implement the appropriate standards. To normalize the matrix, the formula . is utilized, where it is the normalization factor computed by dividing the sum of each column by n, the total number of rows.
Regarding information entropy (), it is a measure of uncertainty or randomness associated with the distribution of values within a dataset or system. It is calculated by using Equation (1).
| (1) |
From Equation (1), where represents the probability of occurrence of the value in the dataset. The information utility value is calculated as,
| (2) |
From Equation (2), where esh represents the information entropy associated with the distribution of values within a dataset.
The entropy weight (W) is determined using the formula
| (3) |
From Equation (3), where di represents the information utility value associated with the ith variable. Once the comprehensive weight is determined, it can be applied to each province’s yearly green finance growth level data. This involves multiplying each province’s data by its corresponding entropy weight and summing these weighted values across all provinces. The resulting sum represents the overall green finance development level, considering the relative significance of different variables in the evaluation.
3.2.2 Index selection of sustainable/green finance
The basic principles of this study are particularity, the scientific approach, operability, and data accessibility. All current studies are taken into account. The corresponding selection uses green credit, investment, insurance, and government assistance as four metrics to assess the provinces of the nation’s level of green financial growth.
Among these, green credit is an essential component of the economy. In addition to taking the accessibility of data into account, this study also selects an index for six industries that require energy and six large energy-consuming sectors, accounts for expenses of interest as an adverse index, selects an index for payments of interest or commercial total, and thoroughly assesses the credit index for investments in sustainability. Green investment takes environmental considerations into account and evaluates project investments by the objectives of sustainable and green development. To gauge the relative level of green finance and its capacity to support green project funding, this research uses the encouraging indicator for green investments, which is the GDP percentage invested in pollution prevention.
Green insurance requires that both the environment and the relevant insurance policy be taken into account. The breadth of ginseng protection is constrained since environmental pollution hazards in China emerged later. Crop insurance and green insurance are closely related, and the extent of agricultural insurance may be a good indicator of the amount of the equivalent green insurance. The environment has a major influence on agriculture. The proportionate ratio of income from agricultural insurance coverage to agricultural net output value is chosen by this study as a favorable indication to handle and assess the data. China is the world’s biggest energy consumer and carbon emitter, making it an important player in global sustainable finance. Through green bonds and government incentives to promote renewable energy, it has improved green finance. By reforming economic laws and strengthening regulations, China is optimizing its energy market structure. These efforts promote innovation, improve resource allocation, and encourage cleaner industrial development. The use of robust data and advanced analysis makes China a key reference for other developing nations. Its transition offers a model for balancing economic growth with environmental sustainability worldwide.
The proposed method uses agricultural insurance as a proxy for green insurance due to its strong link to environmental risks and the lack of dedicated green insurance data in China. Agriculture is highly vulnerable to climate-related events, making its insurance coverage a relevant indicator of environmental risk management. The chosen ratio of agricultural insurance revenue to net agricultural output serves as a positive, data-accessible measure of green finance development.
A thorough assessment of the state of green finance development is made possible by the addition of a favorable government assistance indicator, namely the percentage of spending on environmental protection. The chosen indicators are taken from the statistics yearbooks of many Chinese provinces. Table 1 presents the selected indicators.
Table 1 Index selection of green finance
| Indicators | Description | Indicator Characteristics |
| Green Investment | The proportion of interest expenses in sectors with significant energy consumption compared to all industrial sectors’ interest expenses. | Positive Green Credit |
| The proportion of GDP allocated to ecological pollution prevention investments | Negative Green Insurance | Total agricultural production value divided by agricultural insurance revenue |
| Positive Government assistance | The proportion of funds allocated by the government to environmental preservation | Negative |
3.3 Measuring New Energy Market Structure Optimization
3.3.1 Evaluation techniques
a) Industrial market structure’s rationalization An industry’s ability to aggregate quality across industries is referred to as the rationalization level of the industrial market structure. The degree of cooperation across industries is one thing, but it should also demonstrate how effectively resources are being used. Stated differently, it represents the degree of correlation between the input and output structures of a component. Regarding this connection, researchers often quantify the rationalization level of the industrial market structure using the level of structural deviations, which is expressed in Equation (4).
| (4) |
From Equation (4), S stands for the structural deviation level, K for results, L for employment, if or industrial sectors, and n for the number of energy sectors in the estimation. Therefore, the Theil index is employed in this study to assess the rationalization level of the industrial market structure. The following is the calculating formula for it.
| (5) |
From Equation (5), where R represents the Theil index, indicating the rationalization level of the industrial market structure.
b) Advanced Industrial market structure A sector’s evolution from minimal to the highest level, from uncomplicated to complicated goods, and chain of value from low to high ends is referred to as “upgrading.” The K significance, Moore value, and industrial market structure hierarchy coeffi-cient are now the primary metrics used to assess the upgrading of industrial structure. Indicators for the rationalization level of industrial market structure are chosen and measured in this study primarily using the approaches suggested by Wang [30]. According to Wang, who examined the advancement of industrial market structure using psychological laws, the primary industry primarily provides for human needs related to survival, the secondary industry provides for human needs related to enjoyment through industrial products, and the tertiary industry provides for human needs related to advanced needs through services. The tertiary industry’s position must thus grow more significant when the primary energy industry’s share of the production value decreases, marking an advanced aspect of the industrial structure.
Various industries are assigned differing levels of importance when assessing industrial structure development. The tertiary energy sector holds the highest significance, followed by the secondary energy sector, while the primary energy sector is accorded the least importance. Wang simplified the evaluation process by assigning weights of 3 to the tertiary energy sector, 2 to the secondary energy sector, and 1 to the primary energy sector for ease of computation and understanding. The calculation formula can be succinctly summarized as follows:
| (6) |
The following notation is used in Equation (6): , where H is the coefficient of industrial market structure upgrading; Ci is the resulting level of the -th energy sector; and C is the sum of the results of the three energy sectors. The value of the industrial structure upgrading coefficient (H) ranges from 1 to 3 . When the coefficient of upgrading the industrial structure becomes close to infinity, economically speaking, the industrial structure of a region or a country is at a lower level and suggests a slower pace of optimization. Conversely, when the coefficient of upgrading the industrial structure approaches, the industrial structure of a nation or region is at a higher level, indicating a faster rate of optimization.
3.3.2 Index selection of industrial market structure optimization
Industrial structure optimization is an ongoing procedure that involves each sector making constant adjustments to support coordinated economic development and reach a high level of efficiency and sensible resource allocation. Most people agree that industrial market structure optimization encompasses both industrial system boosting and industrial system rationalization. The term “rationalization level of industrial market structure” describes an ongoing procedure that balances demand and supply for an industry’s structure while ensuring an appropriate allocation of environmental factors among industries, contingent upon a particular technological level. The expression of the rationalization level of industrial structure varies depending on the stage of economic growth. The process by which the business topic progresses from a minimal form to the highest-level form is known as the advanced industrial market structure. Hoffman’s law, Kuzlitz’s law, the allotment-Clark theorem, and others state that the advanced industrial market structure is characterized by a decrease in the proportion of primary industry within the industrial market structure, an increase in the proportion of secondary and tertiary industries, and ultimately the dominance of tertiary industry [31]. Based on this, this study analyzes China’s industrial market structure optimization from two perspectives: advanced industrial structure and rationalized industrial structure, using Spracklen’s technique [32]. Table 2 lists the particular evaluation indices.
Table 2 Index selection of green finance
| Indicators | Description | Indicator Characteristics |
| Rationalized Industrial Market Structure | Rationalized industrial market structure denotes to an organizational framework within industries that is optimized for efficiency, productivity, and overall economic performance | Negative |
| Advanced Industrial Market Structure | The process by which the industrial topic progresses from a minimal form to the highest-level form is known as the advanced industrial market structure | Positive |
3.4 Mediating Effect
3.4.1 Index selection
The advancement and optimization assessment of the industrial market structure as well as the sustainable growth index for each province derived from the aforementioned evaluation serve as the study’s key variables. In the meantime, the intermediary variable of economic regulation is presented. Table 3 displays the final empirical model indicators that correspond with it. The Sobel model test is used to determine whether economic regulation mediates the impact of green finance on optimizing the new energy market structure. It quantifies the indirect effect, validates the proposed causal pathway, supports hypothesis testing, provides policy-relevant insights, and distinguishes between direct and indirect effects, offering a clearer understanding of how regulatory mechanisms influence the role of green finance in market transformation. The aforementioned computation serves as the basis for the indicators of the new energy market structure’s advancement and optimization as well as the degree of green or sustainable finance development. These calculations will not be repeated. In the meanwhile, this work uses logarithmic echnique for non-ratio variables to create appropriate models to remove any potential variability. The proposed method identifies economic regulation as a mediator between green finance and the new energy market structure. Using multiple linear regression and the Sobel test, it examines how green finance influences market structure both directly and indirectly through regulatory mechanisms. This highlights the crucial role of government oversight in enhancing the effectiveness of green finance and promoting sustainable market development.
Table 3 Index selection of mediating effect
| Variable Types | Variables | |
| Explanatory variables | Green Finance | Financial goods, services, and investments that promote ecologically friendly enterprises and endeavors are referred to as “green finance.” |
| Explained Variable | New energy market structure | The new energy market structure reflects a paradigm shift in the global energy sector, driven by technological advancements, policy changes, and evolving consumer preferences |
| Intervening Variable | Economic Regulation | Economic regulation refers to the government’s oversight and control of economic activities within a particular industry or sector. |
The interaction of green finance, economic regulation, and the new energy market structure is critical for optimizing economic law. Green finance allocates funding to sustainable projects, necessitating legal mechanisms. Economic regulation implements these principles, ensuring that financial operations are consistent with environmental and market efficiency objectives. This regulatory control lowers investment risks while increasing transparency, technical innovation, leading in better resource allocation, and industrial upgrading. The smooth transition from financial mechanisms to regulatory enforcement demonstrates the potential for a more sustainable and resilient energy market.
3.4.2 Proposed multiple linear regression analysis
Environmental variables, financial sustainability indicators, and legal as well as regulatory considerations are all examined for their impact on the market structure of new energy through a multiple linear regression analysis [33]. The Proposed Multiple Linear Regression Analysis (PMLRA) differs from standard MLR by integrating policy-relevant variables, applying entropy-based weighting for green finance indicators, and including economic regulation as a mediating variable using the Sobel test. It enhances model accuracy through comprehensive validation metrics and K-fold cross-validation, and it outperforms six other regression models in predictive accuracy. Additionally, it employs advanced statistical techniques like contra harmonic and interquartile means to improve robustness. These features make PMLRA a more sophisticated and reliable tool for analyzing the impact of green finance and regulations on new energy market structure. An advantage of employing multiple linear regression analysis in studying the optimization of economic law on the market structure of new energy under the background of sustainable or green finance is its ability to quantify the relationships between multiple independent variables and a single dependent variable. This statistical technique provides a structured framework for assessing the impact of regulatory policies, financial incentives, market dynamics, and environmental factors on the market structure of the new energy sector.
Market concentration index was used to measure the dependent variable, market structure, while additional independent factors included carbon pricing methods, renewable energy subsidies, antitrust rules, and the volume of green bonds issued. Here, the terms “explanatory variable” and “dependent variable” refer to the types of variables that are explained and independent, respectively. The proposed method uses multiple linear regression and the Sobel test to effectively analyze how economic law, green finance, and market structure interact. Regression quantifies the direct effects of financial and regulatory factors on market dynamics, while the Sobel test reveals the indirect influence of economic regulation as a mediator. Together, these methods capture both direct and indirect relationships, making them suitable for studying the complex mechanisms that drive new energy market optimisation.
Let the independent variable be , and the dependent variable be . Next, there exist independent variables with groups associated to their observed values: . Equation (7) provides an expression for the multiple linear regression formula.
| (7) |
The formula for the matrix form is , wherein represents the regression parameter, or the unknown parameter in the multiple linear regression equation. Here, the error between the calculated value and the observed value at each sample point is estimated using the proposed error approach in accordance with Equation (8). Afterwards, reduce the error as stated in Equation (9). whereby
| (8) | |
| (9) |
When exists, then is equal to , as per the differential principle. The least squares estimate of is shown here. The regression analysis outcome is either achieved by using the to obtain the five parameters. These include residual sum of squares , regression sum of squares , statistic value , relationship parameter , and statistic values , which are computed in Equations (10), (11), (12), (13), (14), respectively. The value of is represented in Equation (15), and represents the regression value of the sample point. represents the sample average of .
| (10) | |
| (11) | |
| (12) | |
| (13) | |
| (14) | |
| (15) |
Here, the regression equation as well as the original datum are used to calculate the correlation coefficient , which indicates the degree of matching in the calculation. The correlation’s expression is shown in Equation (16). wherein, and represent the mean of the and variables, respectively. It is recommended to use the proposed correlation coefficient to improve the numerical measures of the direction and strength of the linear link between variables. Here, the variable denotes the contra harmonic mean of . Compared to the arithmetic mean, geometric mean, or harmonic mean, which is represented in Equation (17), it is a less often employed measure of central tendency. Similar to this, represents the variable’s interquartile mean. Extracted and discarded of the data are used to compute the Interquartile mean, which is defined by Equation (18). The data from only the first and third quartiles is used.
| (16) | |
| (17) | |
| (18) |
4 Empirical Analysis
4.1 Green Finance Evaluation Results
The relevant data collected for this assessment typically includes information on factors such as investment in renewable energy projects, adoption of sustainable finance mechanisms, implementation of economic regulations, and the development of green or sustainable financial institutions. The growth level of green or sustainable finance is measured using the entropy weight approach based on relevant data gathered and first-level indicators of the four aforementioned components. The entropy weight approach is used to calculate the sustainable finance growth level for each province in China from 2012 to 2020, as indicated in Table 4.
Table 4 Growth level of green finance (2012 – 2020)
| 2012 | 2013 | 2014 | 2015 | 2016 | 2017 | 2018 | 2019 | 2020 | |
| Anhui | 0.119 | 0.133 | 0.136 | 0.144 | 0.156 | 0.159 | 0.165 | 0.173 | 0.181 |
| Beijing | 0.479 | 0.516 | 0.551 | 0.627 | 0.692 | 0.759 | 0.748 | 0.793 | 0.839 |
| Chongqing | 0.145 | 0.157 | 0.166 | 0.178 | 0.204 | 0.205 | 0.202 | 0.211 | 0.22 |
| Fujian | 0.154 | 0.166 | 0.176 | 0.194 | 0.21 | 0.214 | 0.214 | 0.224 | 0.234 |
| Guizhou | 0.104 | 0.115 | 0.118 | 0.121 | 0.132 | 0.149 | 0.141 | 0.147 | 0.152 |
| Guangxi | 0.144 | 0.156 | 0.172 | 0.178 | 0.181 | 0.187 | 0.203 | 0.213 | 0.224 |
| Guang dong | 0.27 | 0.289 | 0.3 | 0.336 | 0.359 | 0.395 | 0.384 | 0.402 | 0.421 |
| Gansu | 0.104 | 0.115 | 0.122 | 0.124 | 0.143 | 0.155 | 0.146 | 0.152 | 0.158 |
| Hebei | 0.103 | 0.111 | 0.12 | 0.126 | 0.13 | 0.138 | 0.15 | 0.161 | 0.172 |
| Hainan | 0.157 | 0.162 | 0.163 | 0.165 | 0.18 | 0.181 | 0.192 | 0.2 | 0.208 |
| Henan | 0.114 | 0.123 | 0.135 | 0.142 | 0.156 | 0.166 | 0.174 | 0.186 | 0.199 |
| Hunan | 0.118 | 0.131 | 0.141 | 0.151 | 0.163 | 0.176 | 0.188 | 0.202 | 0.219 |
| Hubei | 0.127 | 0.144 | 0.157 | 0.172 | 0.19 | 0.198 | 0.19 | 0.198 | 0.207 |
| Heilong jiang | 0.11 | 0.115 | 0.116 | 0.124 | 0.129 | 0.134 | 0.138 | 0.142 | 0.147 |
| Inner Mongolia | 0.104 | 0.114 | 0.118 | 0.115 | 0.121 | 0.121 | 0.134 | 0.14 | 0.146 |
| Jiangxi | 0.104 | 0.11 | 0.116 | 0.123 | 0.132 | 0.143 | 0.152 | 0.162 | 0.173 |
| Jiangsu | 0.242 | 0.259 | 0.253 | 0.28 | 0.281 | 0.289 | 0.319 | 0.336 | 0.353 |
| Ji Lin | 0.107 | 0.115 | 0.121 | 0.127 | 0.143 | 0.144 | 0.142 | 0.147 | 0.152 |
| Liaoning | 0.151 | 0.163 | 0.166 | 0.167 | 0.16 | 0.166 | 0.188 | 0.197 | 0.207 |
| Ningxia | 0.074 | 0.085 | 0.099 | 0.08 | 0.103 | 0.088 | 0.099 | 0.103 | 0.107 |
| Qingha | 0.108 | 0.114 | 0.127 | 0.127 | 0.136 | 0.138 | 0.144 | 0.151 | 0.158 |
| Shaanxi | 0.153 | 0.17 | 0.175 | 0.185 | 0.199 | 0.199 | 0.208 | 0.218 | 0.227 |
| Sichuan | 0.139 | 0.15 | 0.159 | 0.169 | 0.182 | 0.193 | 0.202 | 0.215 | 0.228 |
| Shandong | 0.184 | 0.201 | 0.21 | 0.22 | 0.229 | 0.24 | 0.267 | 0.285 | 0.305 |
| Shanghai | 0.234 | 0.246 | 0.267 | 0.285 | 0.314 | 0.334 | 0.354 | 0.377 | 0.403 |
| Shanxi | 0.117 | 0.126 | 0.124 | 0.126 | 0.129 | 0.143 | 0.141 | 0.145 | 0.149 |
| Tianjin | 0.233 | 0.249 | 0.265 | 0.28 | 0.289 | 0.291 | 0.331 | 0.353 | 0.376 |
| Tibet | 0.077 | 0.078 | 0.08 | 0.811 | 0.0875 | 0.089 | 0.093 | 0.099 | 0.111 |
| Xinjiang | 0.071 | 0.075 | 0.081 | 0.083 | 0.088 | 0.089 | 0.093 | 0.097 | 0.101 |
| Yunnan | 0.1 | 0.109 | 0.116 | 0.124 | 0.127 | 0.142 | 0.135 | 0.14 | 0.145 |
| Zhejiang | 0.231 | 0.256 | 0.258 | 0.284 | 0.294 | 0.301 | 0.322 | 0.339 | 0.356 |
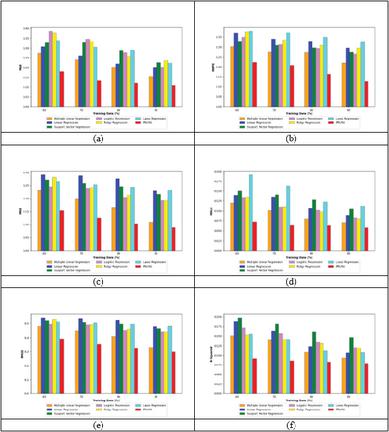
Figure 2 Error Analysis on PMLRA and conventional strategies (a) MAE (b) MAPE (c) MSE (d) MSLE (e) RMSE and (f) R-squared.
4.2 Analysis on Multiple linear Regression Analysis
4.2.1 Error analysis
In Figure 2, the error metric analysis compares the PMLRA Model with Multiple Linear Regression (MLR), Linear Regression, Support Vector Regression (SVR), Logistics Regression (LR), Ridge Regression (RR) and Lasso Regression. The analysis encompasses metrics such as MAE, MAPE, MSE, MSLE, RMSE and R-Squared. The effectiveness of the model is determined by achieving minimal error ratings across these metrics for optimal performance. When analyzing the MSE across various regression models with different proportions of training data, discernible trends emerge. Initially, MLR demonstrates a decline in MSE from 0.231 at 60% training data to 0.1092 at 90%. Linear Regression exhibits a similar pattern, with its MSE decreasing from 0.291 to 0.229 across the same range of training data percentages. This trend is also observed in SVR, where MSE decreases from 0.272 to 0.217 . However, LR consistently outperforms MLR, Linear Regression, and SVR, displaying lower MSE values ranging from 0.245 to 0.192 across the same training data percentages. RR and Lasso Regression also demonstrate competitive performance, with decreasing MSE values. RR ranges from 0.282 to 0.191, while Lasso Regression ranges from 0.264 to 0.232 . Remarkably, the PMLRA Model consistently outshines all others, boasting substantially lower MSE values ranging from 0.153 to 0.088 across the same training data percentages. At of training data, the PMLRA Model demonstrates the lowest R-squared value of 0.0788, whereas the MLR is 0.092, Linear Regression is 0.106, SVR is 0.147, LR is 0.120, RR is 0.119 and Lasso Regression is 0.107, respectively.
At 70% of training data, the PMLRA Model demonstrates an RMSE of 0.3532, which is notably lower than the RMSE values of all other models. This suggests that the PMLRA Model has superior predictive accuracy compared to MLR (0.4480), Linear Regression (0.5366), SVR (0.5079), LR (0.4905), RR (0.4925), and Lasso Regression (0.5026) at this training data. Simultaneously, at the training data, the PMLRA Model emerges as the standout performer, boasting the lowest MSLE of 0.0635 . This underscores its superior performance compared to alternative models. MLR follows with an MSLE of 0.0801, succeeded by Linear Regression at 0.1066, SVR at 0.1281, LR at 0.1019, RR at 0.0982, and Lasso Regression at 0.1227. In addition, the PMLRA scheme acquired the least MAPE of 0.223 at the training data , whereas the MLR, Linear Regression, SVR, LR, RR and Lasso Regression exhibited maximal AMPE of and 0.380, respectively.
Table 5 K-fold validation analysis on PMLRA and conventional methods
| Metrics | MLR | Linear Regression | SVR | LR | RR | Lasso Regression | PMLRA |
| MSE | 0.136 | 0.182 | 0.181 | 0.158 | 0.184 | 0.186 | 0.087 |
| RMSE | 0.369 | 0.427 | 0.425 | 0.397 | 0.429 | 0.431 | 0.295 |
| MAE | 0.181 | 0.261 | 0.218 | 0.237 | 0.247 | 0.233 | 0.123 |
| R-Squared | 0.082 | 0.090 | 0.094 | 0.089 | 0.091 | 0.094 | 0.077 |
| MSLE | 0.071 | 0.080 | 0.083 | 0.071 | 0.082 | 0.083 | 0.059 |
| MAPE | 0.262 | 0.339 | 0.302 | 0.280 | 0.349 | 0.358 | 0.164 |
4.2.2 Statistical analysis on error
In Table 5, a statistical analysis comparing the PMLRA method with conventional strategies is provided. The analysis encompasses key statistical metrics such as Minimum, Maximum, Mean, Median, and Standard Deviation. The minimum statistical metric reveals that the PMLRA method achieved the lowest error rate of 0.089, indicating superior performance in error minimization compared to conventional models. In contrast, conventional models experienced higher error rates, with MLR at 0.109, Linear Regression at 0.230, SVR at 0.217, LR at 0.193, RR at 0.191, and Lasso Regression at 0.233, respectively. In regard to the median statistical metric, the PMLRA method stands out with the lowest error value of 0.114, demonstrating its superior performance. However, the MLR, Linear Regression, SVR, LR, RR and Lasso Regression scored greater error ratings.
5 Implications
The study proposes several implications based on the findings and conclusions derived from the establishment of the model under proposed multiple linear regression analysis. Firstly, it suggests that the government must take a proactive role in advancing the growth of green finance by establishing a comprehensive and robust financial system geared towards sustainability. Additionally, there is a need to strengthen ecological risk management and oversight of loans to prevent capital from flowing into environmentally risky ventures, thereby restricting industries with high pollution levels.
Secondly, the government is advised to prioritize investment in green technology to elevate the level of sustainable financial growth across different regions and facilitate the optimization and upgrading of industrial structures. By implementing sustainable development strategies and fostering technological progress, it aims to achieve a greener and more advanced industrial landscape. Encouraging global technological innovation and enhancing government support, alongside factors like openness to foreign markets, human resources, environmental regulations, and urbanization rates, can contribute to this structural transformation.
Thirdly, it is recommended that the government enhance information exchange and sharing of green financial resources among different regions to bridge the developmental gap between eastern and western areas. Leveraging the rapid development in the east to propel growth in the less developed central and western regions can foster a nationwide trend of green finance growth and new energy market structure optimization.
Lastly, there is a demand to support laws and regulations pertaining to green finance to promote equality, facilitate efficient information dissemination between the government and enterprises, and ensure the smooth functioning of green finance initiatives. By providing empirical evidence of the interplay between economic law, sustainable finance, and market structure in the new energy sector, we have shed light on key factors driving the transition to a low-carbon economy.
5.1 Limitations and Future Recommendations
Despite the comprehensive scope of this research, several limitations should be acknowledged. Initially, the results may not be as applicable to other areas or nations with distinct socioeconomic circumstances due to the study’s dependence on data from 30 Chinese provinces. Furthermore, the study’s 2010–2020 timeframe might not adequately reflect the dynamic nature of developments in the new energy market and green finance, which could have an impact on the analysis’s accuracy. Moreover, while the Sobel test provides valuable insights into the mediating effects of technological progress and economic regulation, it is essential to recognize that mediation analyses are correlational and do not imply causation. Finally, the study may overlook other influential factors beyond green finance and economic policies that could impact the optimization and upgrading of China’s new energy structure.
To address the aforementioned limitations and further advance understanding in this field, future research endeavors could adopt a more longitudinal approach, extending the study period to capture more recent developments and trends in green finance and new energy markets. Moreover, expanding the geographical scope beyond Chinese provinces to encompass a more diverse range of regions would enhance the generalizability and applicability of findings. Additionally, employing mixed-methods approaches, including qualitative interviews or case studies, could provide deeper insights into the mechanisms through which green finance influences new energy structure optimization and upgrading. Furthermore, future studies could explore the interplay among green finance and other relevant factors like technological innovation, policy frameworks, and market dynamics to gain a more comprehensive understanding of their combined effects. Lastly, incorporating comparative analyses with other countries or regions undergoing similar transitions towards sustainable energy systems could offer valuable lessons and insights for policymakers and practitioners globally.
5.2 Conclusion
The findings of this research underscore the significant role of green/Sustainable finance in shaping and advancing China’s new energy market structure. Through an extensive analysis spanning from 2010 to 2020 and incorporating data from 30 provinces in China, the study elucidates the pivotal impact of green finance in driving environmentally conscious practices within enterprises operating in new energy markets. By employing theoretical frameworks of green finance and industrial market structure upgrading and optimization, the study elucidates the intricate dynamics at play in fostering a transition towards sustainable energy practices.
Moreover, the market structure of new energy is inherently influenced by the regulatory environment, which dictates the rules and incentives governing market participants. By incorporating provisions that incentivize sustainable investment and penalize environmentally harmful practices, economic laws can help channel capital towards projects that contribute to both economic growth and environmental protection. This alignment between financial incentives and sustainability goals is fundamental for achieving a transition to a low-carbon economy. This study was utilized a proposed multiple linear regression analysis to delve into the drivers of market dynamics within the new energy sector, specifically concentrating on the optimization of economic laws to align with sustainability objectives. Through this analytical approach, we have systematically examined the multifaceted influences shaping renewable energy markets, encompassing economic, financial, and environmental variables.
Declarations
Funding
2022 Anhui Provincial quality Engineering Project “Economic Law Course Ideological and Political Demonstration Pilot Course” (2021kcszsfkc141)
Key Project of the Ministry of Justice in 2018: Research on the Title Contract in the Title Compilation of the Civil Caree (18SFB1008)
Conflicts of Interests
Authors do not have any conflicts.
Data Availability Statement
The data generated and analyzed during the current study are available from the author Fengyun Liu, upon reasonable request but are not yet publicly available due to ongoing research.
Code Availability
Not Applicable.
Authors’ Contributions
Fengyun Liu, Zhengzhang Zhang is responsible for designing the framework, analyzing the performance, validating the results, and writing the article. Menglan Song, Jinguang Chen, is responsible for collecting the information required for the framework, provision of software, critical review, and administering the process.
References
[1] C. Li, X. Li, D. Song, and M. Tian. Does a carbon emissions trading scheme spur urban green innovation? Evidence from a quasi-natural experiment in China. Energy & Environment, 33(4):640–662, 2022.
[2] H. Amundsen and E. A. Hermansen. Green transformation is a boundary object: An analysis of conceptualisation of transformation in Norwegian primary industries. Environment and Planning E: Nature and Space, 4(3):864–885, 2021.
[3] S. Zeng, Y. Yu, and W. Li. Prediction and evaluation of the energy structure under the green finance development in Chongqing municipality, China. Heliyon, 9(12):e22481, 2023. doi:10.1016/j.heliyon.2023.e22481.
[4] P. M. Kumar, M. M. Kamruzzaman, B. S. Alfurhood, B. Hossain, H. Nagarajan, and S. R. Sitaraman. Balanced performance merit on wind and solar energy contact with clean environment enrichment. IEEE Journal of the Electron Devices Society, 12:808–823, 2024.
[5] S. Mahjoub, L. Chrifi-Alaoui, B. Marhic, and L. Delahoche. Predicting Energy Consumption Using LSTM, Multi-Layer GRU and Drop-GRU Neural Networks. Sensors, 22(11):4062, 2022. doi:10.3390/s22114062.
[6] D. P. Deevi, N. S. Allur, K. Dondapati, H. Chetlapalli, S. Kodadi, and T. Perumal. The impact of the digital economy on industrial structure upgrading and sustainable entrepreneurial growth. Electronic Commerce Research, 2024:1–25, 2024.
[7] A. Sinha, V. Ghosh, N. Hussain, D. K. Nguyen, and N. Das. Green financing of renewable energy generation: Capturing the role of exogenous moderation for ensuring sustainable development. Energy Economics, 126:107021, 2023. doi:10.1016/j.eneco.2023.107021.
[8] A. C. Pandey, V. Das, P. Kumar, R. Singh, and S. K. Maurya. AEFA based optimal dynamic economic load dispatch problem considering penetration of renewable energy systems. Distributed Generation & Alternative Energy Journal, 37(4):979–998, 2022. doi: 10.13052/dgaej2156-3306.3745.
[9] Y. Zhang, X. Xiao, W. Xing, M. Chen, and C. Lu. Stability modeling and analysis of grid connected doubly fed wind energy generation based on small signal model. Distributed Generation & Alternative Energy Journal, 38(2):413–434, 2023. doi: 10.13052/dgaej2156-3306.3823.
[10] C. H. Prasad, K. Subbaramaiah, and P. Sujatha. Economic analysis by optimal placing of DGs in distribution networks by particle swarm optimisation and gravitational search optimisation algorithm. Distributed Generation & Alternative Energy Journal, 38(3):923–942, 2023. doi: 10.13052/dgaej2156-3306.3839.
[11] J. Bobba. Cloud-based financial models: advancing sustainable development in smart cities. International Journal of HRM and Organizational Behavior, 11(3):27–43, 2023.
[12] S. Boyapati. Assessing digital finance as a cloud path for income equality: evidence from urban and rural economies. International Journal of Modern Electronics and Communication Engineering (IJMECE), 8(3):122, 2020.
[13] Z. Cheng, L. Li, and J. Liu. Industrial structure, technical progress and carbon intensity in China’s provinces. Renewable and Sustainable Energy Reviews, 81:2935–2946, 2018.
[14] M. Arens, M. Åhman, and V. Vogl. Which countries are prepared to green their coal-based steel industry with electricity? Reviewing climate and energy policy as well as the implementation of renewable electricity. Renewable and Sustainable Energy Reviews, 143:110938, 2021.
[15] K. Chang, Y. Zeng, W. Wang, and X. Wu. The effects of credit policy and financial constraints on tangible and research & development investment: Firm-level evidence from China’s renewable energy industry. Energy Policy, 130:438–447, 2019.
[16] S. Boyapati and H. Kaur. Mapping the urban-rural income gap: a panel data analysis of cloud computing and internet inclusive finance in the e-commerce era. ISAR International Journal of Mathematics and Computing Techniques, 7(4), 2022.
[17] Y. Hu, C. B. Pratt, W. Adamolekun, and A. R. Ogedengbe. ‘Communicating development’–a cultural shift: emerging discourses on entrepreneurial development and poverty reduction by Nigeria’s banking and microfinance sectors. Critical Arts, 30(5):709–727, 2016.
[18] S. Dikau and U. Volz. Central bank mandates, sustainability objectives and the promotion of green finance. Ecological Economics, 184:107022, 2021.
[19] H. Zhang, C. Geng, and J. Wei. Coordinated development between green finance and environmental performance in China: The spatial-temporal difference and driving factors. Journal of Cleaner Production, 346:131150, 2022.
[20] U. Shahzad, D. Ferraz, B. Doğan, and D. A. do Nascimento Rebelatto. Export product diversification and CO2 emissions: Contextual evidences from developing and developed economies. Journal of Cleaner Production, 276:124146, 2020.
[21] M. Wang, X. Li, and S. Wang. Discovering research trends and opportunities of green finance and energy policy: A data-driven scientometric analysis. Energy Policy, 154:112295, 2021.
[22] M. Li, N. M. Hamawandy, F. Wahid, H. Rjoub, and Z. Bao. Renewable energy resources investment and green finance: Evidence from China. Resources Policy, 74:102402, 2021.
[23] F. Wang, R. Wang, and Z. He. The impact of environmental pollution and green finance on the high-quality development of energy based on spatial Dubin model. Resources Policy, 74:102451, 2021.
[24] Y. Jin, X. Gao, and M. Wang. The financing efficiency of listed energy conservation and environmental protection firms: evidence and implications for green finance in China. Energy Policy, 153:112254, 2021.
[25] T. Zhang. Can green finance policies affect corporate financing? Evidence from China’s green finance innovation and reform pilot zones. Journal of Cleaner Production, 419:138289, 2023.
[26] X. Chen and Z. Chen. Can green finance development reduce carbon emissions? Empirical evidence from 30 Chinese provinces. Sustainability, 13(21):12137, 2021.
[27] J. Hu and H. Zhang. Has green finance optimized the industrial structure in China? Environmental Science and Pollution Research, 30(12):32926–32941, 2023.
[28] G. Zhou, J. Zhu, and S. Luo. The impact of fintech innovation on green growth in China: Mediating effect of green finance. Ecological Economics, 193:107308, 2022.
[29] A. Trinks, M. Mulder, and B. Scholtens. An efficiency perspective on carbon emissions and financial performance. Ecological Economics, 175:106632, 2020.
[30] B. Wang, L. Han, and H. Zhang. The Impact of Regional Industrial Structure Upgrading on the Economic Growth of Marine Fisheries in China—The Perspective of Industrial Structure Advancement and Rationalization. Frontiers in Marine Science, 8:693804, 2021.
[31] X. Zhou, J. Zhang, and J. Li. Industrial structural transformation and carbon dioxide emissions in China. Energy Policy, 57:43–51, 2013.
[32] D. V. Spracklen. China’s contribution to climate change. Nature, 531(7594):310–311, 2016.
[33] L. Guo and X. Deng. Application of Improved Multiple Linear Regression Method in Oilfield Output Forecasting. In 2009 International Conference on Information Management, Innovation Management and Industrial Engineering, pages 133–136, Xi’an, China, 2009. doi:10.1109/ICIII.2009.39.
Biographies

Fengyun Liu received her master’s degree from the Wang Jan Law School, Soochow University, in 2013. She is currently a faculty member at the New Business School, Anhui Sanlian University, engaged in teaching and research in finance and economics. Her research interests include economic law and the governance of social rule of law.

Zhengzhang Zhang received his Ph.D. from the Chinese Academy of Social Sciences in 2010. He is currently a professor and doctoral supervisor at the Wang Jian Law School, Soochow University. His research focuses on civil and commercial law.

Menglan Song graduated from Anhui University in 1997. He is currently the Vice President of Anhui Sanlian University, engaged in undergraduate teaching and administrative affairs.

Jinguang Chen received his master’s degree from the University of Science and Technology of China in 2009. He currently works at the Anhui Branch of China Construction Bank, specializing in credit approval.
Distributed Generation & Alternative Energy Journal, Vol. 40_4, 869–900.
doi: 10.13052/dgaej2156-3306.40411
© 2025 River Publishers