Electric Vehicle Charging Network Planning Based on Multi-Objective Optimization and Real-Time Data Analysis
Pengcheng Zhang, Jinsen Liu, Ning Luo, Ludong Chen and Fei Zheng*
Power Grid Planning and Research Center of Guizhou Power Grid Co., Ltd., Guiyang, 550003, China
E-mail: feizhengfly@outlook.com
*Corresponding Author
Received 12 June 2025; Accepted 22 September 2025
Abstract
Current Electric Vehicle network planning methods have shortcomings in technical standards and layout structures, often failing to consider regional differences and user needs, leading to irrational charging network layouts. This study integrates Multi-Objective Optimization Algorithms with real-time data and employs Graph Neural Networks for dynamic adjustments and optimization of charging strategies. Results show that with a maximum of three user attempts, the proposed framework achieves a total cost of 3.37 106 USD, lower than Moth-Flame Optimization (4.39 106 USD), Monte Carlo (4.57 106 USD), and Fuzzy Multi-objective Optimization (5.42 106 USD). When the degree of aggregation reaches high aggregation, the average waiting time of the research architecture is the lowest, at 3.32ta/min. The algorithm optimizes charging resource allocation, enhances charging station efficiency, and improves Electric Vehicle network planning, making it a valuable contribution to intelligent transportation systems.
Keywords: Multi-objective optimization algorithms, real-time data analysis, charging network, graph neural networks, network planning.
1 Introduction
In recent years, with the popularity of new energy vehicles, Electric Vehicle (EV) have gained increasing favor as green, zero-emission transportation options [1]. However, the planning of charging networks, as an essential factor for the normal operation of EV, has become an important task in promoting the widespread adoption of EV [2]. The planning of charging networks directly determines the convenience of using EV. However, existing EV charging network planning methods have limitations due to differences in charging service coverage between regions. The complexity of charging infrastructure types, along with the difficulty of unifying standards for the overall vehicle-to-pile ratio, increases the complexity of planning management [3, 4]. The incompatibility of communication protocols among charging piles of different brands leads to a low success rate of cross-brand charging, and the chaotic classification of charging power increases the difficulty of grid load regulation. The overlapping construction of charging piles in high-density areas and the insufficient coverage of suburban and highway service areas have led to a relatively high proportion of users with range anxiety. Moreover, the current technical standards for the electric vehicle network planning have not been adjusted in terms of layout in combination with real-time traffic flow data. During peak hours, the queuing time at popular stations exceeds 40 minutes, and there are empty piles within a 3-kilometer radius around them. The imbalance in spatial distribution has led to an increase in the density and idle rate of charging piles in urban areas. Most users are faced with a charging distance of more than 5 kilometers. The mismatch between supply and demand has led to a waiting time of over 50 minutes for charging piles in commercial areas during peak commuting hours, while the utilization rate of charging piles in residential areas is relatively low during the same period. Insufficient grid adaptation can easily lead to disorderly layout, causing the load in some transformer areas to exceed capacity. The voltage fluctuation range and charging interruption rate are higher than those in the planned areas. As mobile energy storage devices, the interaction between EV and the power grid still requires further improvement in related technologies [5]. Graph Neural Networks (GNN) exhibit good generalization capabilities, and the combination of Multi-Objective Optimization Algorithms (MOOA) with real-time data analysis can improve the comprehensiveness of decision-making. Therefore, to enhance the applicability and feasibility of EV charging network planning, this study chooses to combine GNN with MOOA and real-time data analysis to construct a charging network planning algorithm. By monitoring real-time data on EV prices, charging status, and grid loads, key data trends and information are extracted using data analysis tools. GNN updates the current node state through neighboring node information, capturing the complex relationships and patterns in the graph data. This method is expected to improve the system stability and service efficiency of EV charging network planning, thereby increasing the market acceptance of EV.
2 Related Works
MOOA is highly flexible and versatile in solving optimization problems involving two or more conflicting objective functions. When applied to the planning and operation of power systems, they can help improve system stability and optimize power generation costs. Scholars both at home and abroad have conducted various studies on the characteristics of multi-objective optimization. For example, Cao G’s group proposed the use of multi-objective optimization for the design of guide vanes in order to improve the performance of spiral guide vane equipment. By analyzing the design relationships between guide vane parameters, they determined the optimal values for these parameters. The feasibility of the proposed solution was validated through simulation experiments [6]. Xu T et al. proposed a multi-objective optimization method to eliminate the impact of wavefront phase errors on measurements in astronomical observations. They used an equivalent model to correct the wavefront phase errors, and the results demonstrated the effectiveness of this approach [7]. Kermani A and Ehsani A investigated the multi-objective optimization problem in composite materials by studying the sectional effects of ribs. The experimental results revealed that design structures with different criteria did not affect the test results, and by comparing them, they determined the optimal solution [8]. Additionally, real-time data analysis enables real-time monitoring of data, allowing decision-makers to quickly adapt to market changes and understand user preferences. Many scholars have conducted extensive research on this method. Liu J and Liu Y proposed a low-latency data collection protocol to improve the reliability of data acquisition in wireless sensor networks, achieving end-to-end packet retransmission. Simulation experiments validated the feasibility and timeliness of the method [9]. Woo-Kyun Jung’s group proposed developing an optimization simulator to address the shortcomings of traditional industrial revolution technologies and used real-time data to improve productivity. Experimental results showed that this method provided data support for achieving optimal productivity [10].
On the other hand, with the continuous development of technology, EV have become one of the main modes of transportation. As an essential part of EV operations, charging network planning has attracted considerable research attention from scholars around the world. Kathirvel K and colleagues proposed a novel control method for managing EV charging systems to improve the energy production efficiency of microgrids and reduce related issues. The experimental results showed that the proposed technology consumed far less power compared to existing methods [11]. Fareed A and Mohd B proposed a practical approach to select the optimal charging station locations to improve EV charging infrastructure. The results indicated that their method effectively reduced power losses during EV charging [12]. Arjun V and Selvan M P proposed a simulation-based method to examine the technical constraints of EV charging network planning by testing the worst-case charging scenario. Simulation experiments confirmed the effectiveness of this method [13]. Huang N et al. proposed a novel scheduling model to analyze the impact of distribution networks on EV charging loads, considering time-varying temperatures. The results showed that this model could effectively reduce scheduling operation costs [14]. Ferraz R S F and others optimized EV charging station planning using a genetic algorithm to solve the Pareto curve in order to improve the power quality metrics of EV charging. The results indicated that this method could significantly reduce power losses during charging [15].
From the research conducted by scholars globally, it is evident that current MOOA and real-time data analysis still face challenges such as large computational requirements and slow convergence speeds. Additionally, the layout of methods for EV charging network planning remains inadequate. Therefore, this study combines multi-objective optimization and real-time data analysis and introduces GNN for optimization. The goal is to enhance the rationality and operational standards of EV charging network planning and provide reliable data support for the promotion of EV.
3 EV Charging Network Architecture Combining MOOA And Real-Time Data Analysis
3.1 Charging Strategy Based on Real-time Data Analysis and MOOA
Real-time data analysis is a dynamic analysis technology that processes data immediately after it is generated. It has the advantage of quickly capturing data and providing real-time insights [16]. Through real-time data analysis, businesses can more accurately predict future trends and develop strategies to manage risks, helping optimize resource allocation [17]. This study chooses to use real-time data analysis and MOOA as methods for EV charging network planning. By monitoring the usage status of charging piles and the power output, it ensures a reasonable distribution of electrical resources, promoting remote monitoring and intelligent scheduling of the charging network. The data processing module of real-time data analysis is shown in Figure 1.
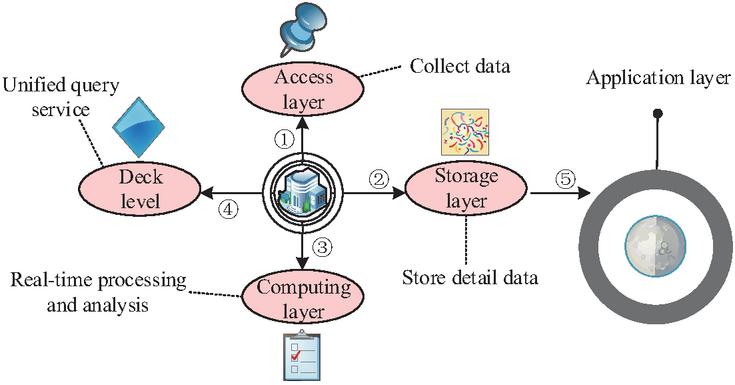
Figure 1 Schematic diagram of data processing module for real-time data analysis.
As shown in Figure 1, the data processing module of real-time data analysis mainly achieves full-process real-time data processing and analysis through five levels of collaboration. The access layer collects data from various systems into a message queue system. The storage layer is responsible for storing raw input data and cleaned related data in different storage engines. The computation layer analyzes real-time data using a stream computation engine. The platform layer manages metadata indicators, unified query services, and data quality. The application layer supports unified query services for various business line data scenarios. Metadata management and data quality are used for unified management and monitoring of real-time data, respectively. The sliding average calculation formula for the current data point in real-time data analysis is shown in Equation (1).
| (1) |
In Equation (1), and represent the previous data points and the window size. The product calculation formula for the current data point is shown in Equation (2).
| (2) |
In Equation (2), and represent the product of the previous data point and the current data point. Compared to real-time data analysis, MOOA is more flexible and scalable, and can be adjusted according to task scenario requirements. Its main workflow is shown in Figure 2.
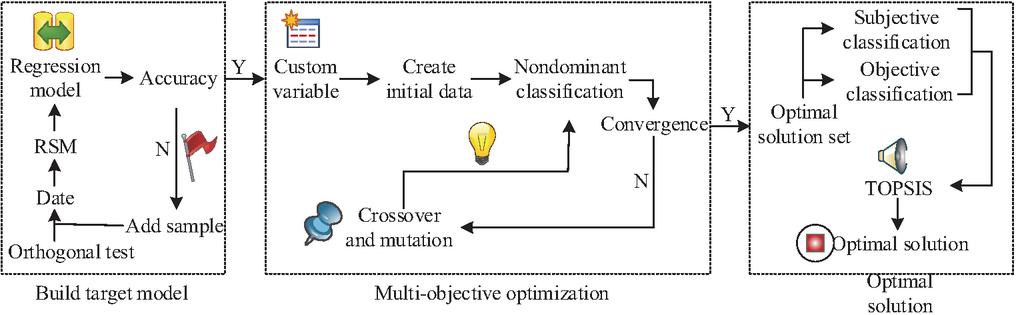
Figure 2 The main workflow of MOOA.
As shown in Figure 2, the main process of MOOA begins with establishing a goal model. A regression model is created through orthogonal experiments, and once the model has sufficient accuracy, initial goal data is created using custom variables. If sufficient accuracy is not achieved, more samples are added to continue analyzing the regression model. If the non-dominant classification result does not meet the convergence criteria, it is reclassified through crossover mutation. When a certain level of convergence is reached, the optimal solution set is obtained. Finally, the subjective and objective classifications are integrated, and the best solution is obtained using the ideal solution approach. MOOA usually involves simultaneously minimizing or maximizing different objective functions, and these objectives may conflict with one another, thus creating a set of optimal solutions that provide different trade-offs between the objectives. The specific MOOA calculation formula is shown in Equation (3).
| (3) |
In Equation (3), represents objective functions in the domain. Real-time data analysis quickly captures trends in the data of the task scenario, while MOOA can consider multiple objectives and derive optimization results through ratio analysis. The combination of the two for EV charging network planning strategies is shown in Figure 3.
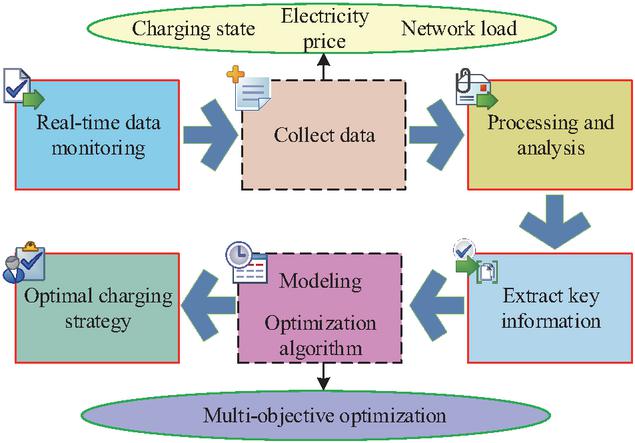
Figure 3 MOOA charging strategy based on real-time data analysis.
As shown in Figure 3, the MOOA strategy based on real-time data analysis first collects key data information such as EV prices, charging status, and grid load through real-time data monitoring. This forms the foundation for devising the optimal EV charging strategy. Next, data analysis tools extract useful trends and information from the real-time EV charging data, such as determining the optimal charging time for EV based on price fluctuations and assessing the grid load to identify any overload risks. The formula for calculating the price elasticity coefficient in the EV charging process is shown in Equation (4).
| (4) |
In Equation (4), represents the micro-increment of the load, represents the price fluctuation, and and represent the time period. The formula for calculating the power demand elasticity matrix is shown in Equation (5).
| (5) |
In Equation (5), represents the load. The formula for calculating the relationship between charging demand and price fluctuation is shown in Equation (6).
| (6) |
After obtaining key information from the MOOA charging strategy based on real-time data analysis, the study uses MOOA for mathematical modeling. Finally, after comprehensively considering multiple goals such as charging cost, grid stability and battery life, the optimal strategy for EV charging is proposes. During the process of behavioral feature extraction, user preferences are mined from historical data and a temporal preference distribution model is established. In MOOA, a new target for user behavior matching degree is added, with a weight set at 0.3. The deviation between the strategy and the actual habit is reduced through a penalty function. The real-time data module updates the behavioral trend every hour, triggers the feature recalculation of GNN nodes, and adjusts the strategy output. The data layer collects data on charging protocols and interface types of different brand models and marks cases of charging failure caused by protocol incompatibility. The model layer incorporates protocol compatibility attributes into the GNN node features and uses edge weights to reflect the success rate of cross-brand charging. The MOOA section increases the cross-brand compatibility rate index by deploying the charging pile protocol conversion module, thereby reducing the rate of users changing stations due to compatibility issues.
3.2 Charging Network Planning Architecture Integrating MOOA Strategy and GNN
Using real-time data analysis and MOOA for EV charging network planning can improve the efficiency of charging network planning to some extent. However, real-time data analysis involves extensive data processing and analysis, and MOOA requires considering multiple objectives, which increases the complexity of data processing and places high demands on infrastructure and technology. Therefore, to improve the efficiency of processing EV charging network planning, the study chooses to incorporate GNN for improvement. GNN has powerful graph data fitting and inference capabilities. It can effectively handle complex graph structure data and relationships, and through integrating information from different neighbors, GNN can adaptively adjust the graph structure and node characteristics [18, 19]. The update process of GNN is shown in Figure 4.
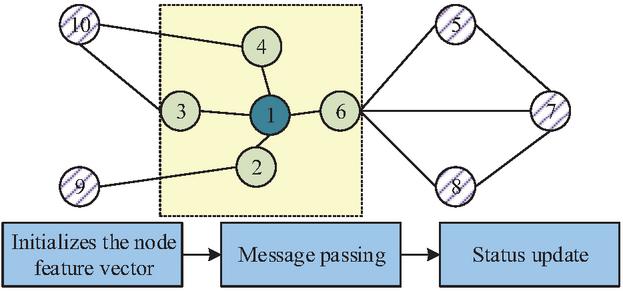
Figure 4 Schematic diagram of the state update process of GNN.
As shown in Figure 4, GNN’s state update is completed through information aggregation between adjacent nodes. In the GNN model, each node represents a state, and the state of each node is updated as information is passed along. The state update process includes three key steps: initializing the node feature vector, message passing, and state updating. At the start of model training, each node is assigned an initial feature vector containing node attributes, and nodes collect information from neighboring nodes for message passing. During the state update process, nodes update their state representations based on the information they collect. This part typically involves a combination transformation of the aggregated information and the current node state, which generates a new node state. The calculation formula for updating the feature of neighboring nodes in GNN is shown in Equation (7).
| (7) |
In Equation (7), and represent the weight between nodes and the feature value of the node. The loss function calculation formula for the model is shown in Equation (8).
| (8) |
In Equation (8), and represent the true and predicted values of the nodes, and represents the number of supervised nodes. The workflow of the hybrid algorithm combining GNN, MOOA, and real-time data analysis is shown in Figure 5.
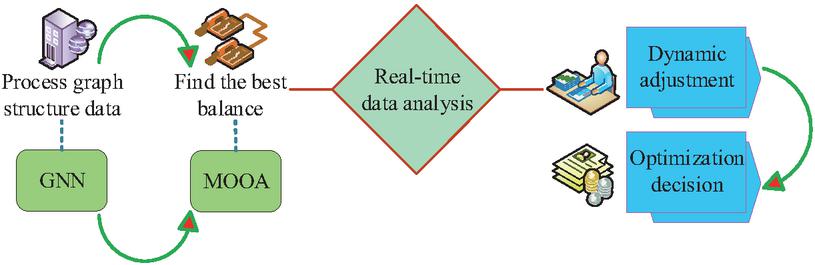
Figure 5 Flowchart of hybrid algorithm of GNN, MOOA and real-time data analysis.
As shown in Figure 5, in the operation of the hybrid algorithm, GNN is responsible for updating the current node state through information from neighboring nodes, thereby capturing the complex relationships and patterns in the graph data. MOOA finds the optimal set of solutions that strike the best balance among multiple objective functions, reducing the possibility of conflicts between objectives. The real-time data analysis part dynamically adjusts and optimizes decisions based on the latest data. In the process of combining with GNN and MOOA, real-time data analysis can monitor changes in the graph data structure and the performance of each objective function. By combining all three parts, the system can adjust GNN parameters and MOOA search strategies to better adapt to the current environment and demands. The calculation formula for the objective function in the algorithm is shown in Equation (9) [20].
| (9) |
In Equation (9), and represent the resource weights in the objective function and the task usage time at the edge end, and and represent the resource weights in the objective function and the resource usage for each task at the edge end. and represent the task usage time at the cloud end and total operation time, while and represent the resource usage and total resources at the cloud end. By integrating information from neighboring nodes and generating node embeddings, GNN can effectively improve the model’s expressive ability. The final design of the charging network architecture based on the GNN, MOOA, and real-time data analysis algorithm is shown in Figure 6.
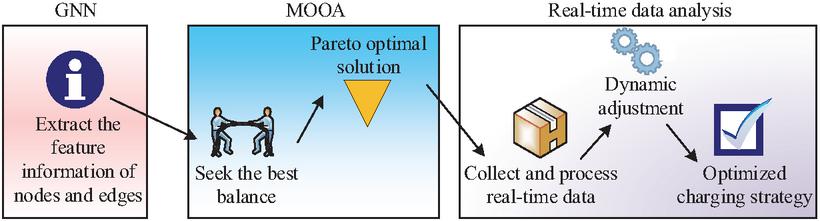
Figure 6 EV charging network architecture diagram based on hybrid algorithm.
As shown in Figure 6, the GNN module extracts the feature information of nodes and edges. Nodes represent EV, grid nodes, and charging piles, while edges represent charging relationships and grid connections. The MOOA module optimizes multiple objectives in the EV charging network, including grid stability, user satisfaction, and charging efficiency. The optimal solution set generated by this module represents a balanced charging strategy derived from different objective functions. The actual application depends on the environment and needs. The real-time data analysis module is responsible for collecting and processing real-time data in the EV charging network and using this data to dynamically adjust and optimize the charging strategy. The mathematical formula for EV travel’s normal distribution is shown in Equation (10).
| (10) |
In Equation (10), , , and represent the EV driver’s driving behavior, the standard deviation of the driving distance distribution, and the mean value of the driving distance distribution, respectively. The formula for calculating the EV’s power during charging is shown in Equation (11).
| (11) |
In Equation (11), and represent the EV battery capacity and charging power, while and represent the interrelationship between the charging equipment’s efficiency and the remaining charge state of the battery in relation to the driving distance. The formula for calculating the EV’s power consumption is shown in Equation (12).
| (12) |
In Equation (12), and represent the charging power and the number of EV charging at the station. and represent the charging consumption time and power factor for the -th car at the charging station, and represents the established objective function. The formula for calculating the distance-time satisfaction during the EV charging process is shown in Equation (13).
| (13) |
In Equation (13), and represent the distance from the demand point to the candidate charging station point and the minimum user satisfaction, while GG represents the maximum user satisfaction. The GNN network structure adopts a two-layer GraphSAGE, with nodes set as charging piles, electric vehicles, and power grid nodes, and edge weights as distance/charging success rate. The aggregation function adopts mean pooling, and the output layer is connected to the softmax classification charging strategy type. The training data is selected from three months of historical data, which includes over 100,000 charging records, 5-minute grid load, and GIS location information. The training set and test set are divided in an 8:2 ratio, with user waiting time and grid load fluctuations as the optimization objectives of the loss function. Every 15 minutes, real-time data is input to update the node features. New strategies are generated through neighborhood information propagation to achieve the collaborative adaptation of charging piles, vehicles and power grids.
4 Performance Verification of the Improved EV Charging Network Planning Algorithm
4.1 Performance Analysis of the EV Charging Network Planning Algorithm
To verify the performance of the proposed EV charging network planning algorithm, the study compared it with the EV charging network planning algorithms based on the Moth-Flame Optimization (MFO) algorithm, the Monte Carlo method (MCM), and the Fuzzy Multi-objective Optimization (FMO) algorithm. The experimental scenarios were selected in Guangzhou City, Guangdong Province, covering six types of areas including commercial districts, residential areas, and expressway service areas. It includes 200 existing charging piles and 50 candidate stations, simulating the dynamic charging behavior of 12,000 electric vehicles, among which 70% are private cars and 30% are ride-hailing vehicles. The charging records are the actual operation data from March to May 2024, including time, location and power. The grid load is sourced from the 15-minute-level transformer area data provided by the power supply bureau, and the user trajectory is derived from the de-identified on-board GPS data. The experiments were conducted in an environment based on an HP Z820 server with a 2.1 GHz, 24-core processor. A total of 3000 training data points were simulated, with the EV charging power set to 3 kW and the time step to 1 minute, and 2000 sampling iterations were performed. The study first compared the cost consumption of the four algorithms, and the results are shown in Figure 7.
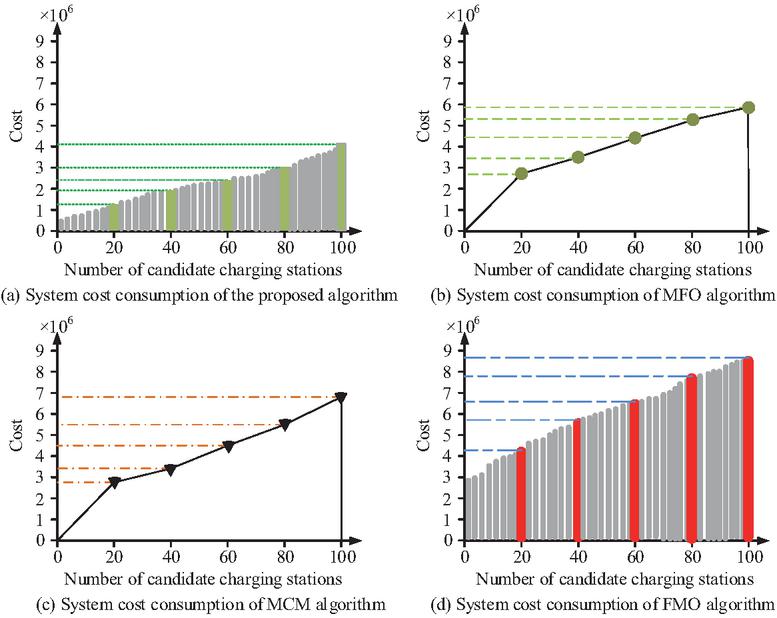
Figure 7 Comparison of cost consumption experiment results.
As shown in Figure 7, the cost consumption of the four algorithms increased gradually with the number of candidate charging stations. The overall cost consumption of the proposed algorithm was significantly lower than that of the other three algorithms. When the number of candidate charging stations was 20, the cost consumption of the proposed algorithm was only 1.23 106 USD, while the costs of the MFO and MCM algorithms reached 2.87 106 USD and 2.89 106 USD, respectively. When the number of candidate charging stations was 100, the cost consumption of the MCM and FMO algorithms was 6.91 106 USD and 8.68 106 USD, respectively, while the proposed algorithm’s cost consumption was 4.11 106 USD. These results indicate that the proposed algorithm had the lowest cost consumption among the four algorithms under the same number of candidate charging stations, demonstrating higher operational efficiency and lower operational costs. Next, the study analyzed the charging task completion rate of the four algorithms, and the results are shown in Figure 8.
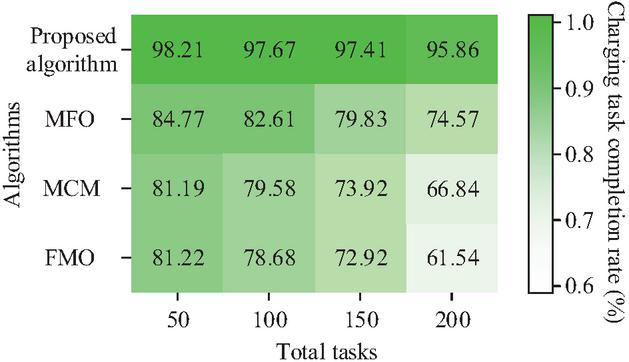
Figure 8 Charging task completion rate experimental results.
As shown in Figure 8, the charging task completion rate of the four algorithms varied with the total number of tasks. The proposed algorithm achieved the highest charging task completion rate of 98.21% when the total number of tasks was 50. Even when the total number of tasks increased to 200, the proposed algorithm maintained a stable completion rate of 95.86%. The highest charging task completion rate of the MCM algorithm was 13.44% lower than that of the proposed algorithm, and the FMO algorithm had a completion rate of only 61.54% when the total number of tasks was 200. Overall, the proposed algorithm had the highest charging task completion rate among the four algorithms, indicating superior efficiency and reliability in completing charging tasks. The study then analyzed the user loss rate under different total task numbers during the EV charging process, and the results are shown in Figure 9.
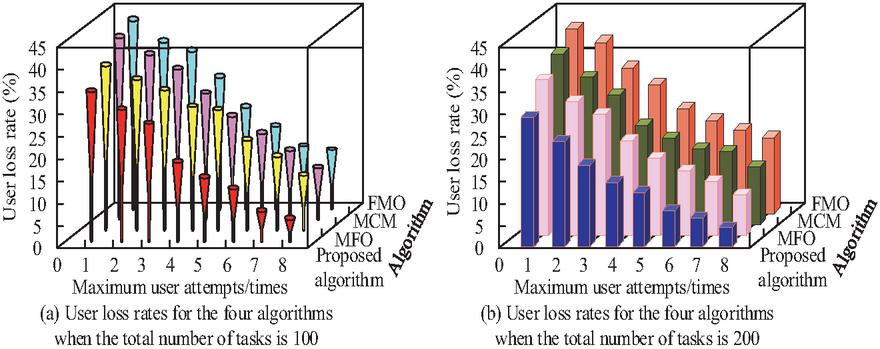
Figure 9 User loss rate results under different number of tasks.
As shown in Figure 9(a), the total number of tasks was 100, the user loss rates for the proposed algorithm and the MFO algorithm were 21.9% and 28.1%, respectively, when the maximum number of user charging attempts was 2. The user loss rates for the MCM and FMO algorithms were 37.2% and 42.3%, respectively. From Figure 9(b), it can be observed that when the total number of tasks was 200, the user loss rate of the proposed algorithm was consistently lower than that of the other three algorithms. When the maximum number of user charging attempts was 5, the user loss rate for the FMO algorithm was the highest among the four algorithms, reaching 24.7%, while the proposed algorithm’s user loss rate was only 6.1%. These results suggest that the proposed algorithm had higher energy utilization efficiency during the charging process, with a smaller difference between the actual energy obtained by the user and the energy provided by the charging station.
4.2 Verification of the Practical Application Effectiveness of the EV Charging Network Planning Architecture
To further validate the performance of the proposed EV charging network planning architecture in real-world application scenarios, the study selected the Tesla Model 3 with a 77 kWh battery as the EV model. The average service rate of a single charging pile was 2 vehicles per hour, with a total of 100 charging stations. The maximum number of charging attempts tolerated by users in the sub-region during the time slot was set to 3. The unit distance user incentive cost and user loss penalty were $0.2/km and $110 per person. The study first tested the average waiting time and the maximum waiting time for the four network planning architectures under different vehicle charging aggregation levels, and the results are shown in Figure 10.
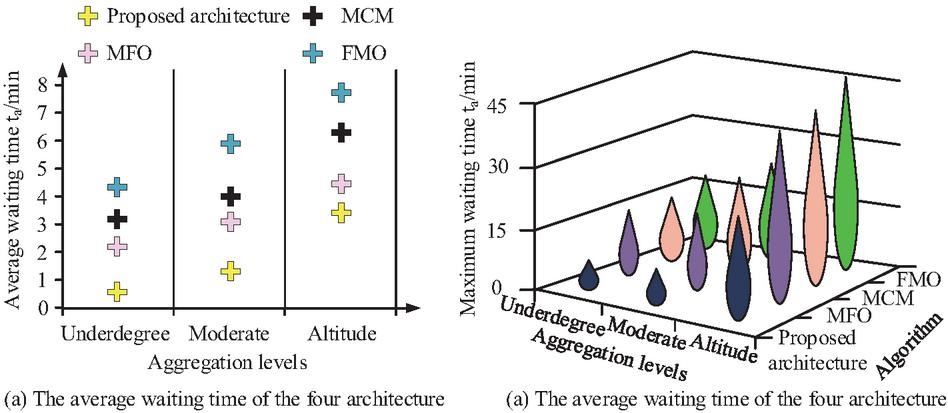
Figure 10 Average waiting time and maximum waiting time experimental results.
As shown in Figure 10(a), the average waiting time for the proposed architecture was 0.56 ta/min under low vehicle aggregation, while the average waiting times for the MFO-based network architecture, MCM-based network architecture, and FMO-based network architecture were 2.19 ta/min, 3.21 ta/min, and 4.22 ta/min, respectively. In Figure 10(b), the maximum waiting time for the proposed architecture was shown to be lower than the comparison network architectures under different vehicle aggregation levels. Under moderate aggregation, the maximum waiting time for the FMO-based network architecture reached 20.64 ta/min, while the maximum waiting time for the proposed architecture was only 6.78 ta/min. These results demonstrate that the proposed architecture could better allocate charging resources according to vehicle charging aggregation levels, ensuring efficient operation of the charging stations and reducing vehicle waiting times. The study then analyzed the solution time, economic cost, and convergence generation of the four network planning architectures under different vehicle charging aggregation levels, and the results are shown in Table 1.
Table 1 Experimental results of solution time, economic cost and convergence times
| Network | Economic | |||
| Aggregation | Planning | Solution | Cost | Convergent |
| Levels | Architecture | Time (h) | (10 USD) | Times |
| Low aggregation | Proposed architecture | 8.25 0.42 | 9.253 0.21 | 12 1 |
| MFO | 11.53 0.65 | 12.841 0.35 | 21 2 | |
| MCM | 12.47 0.71 | 14.698 0.42 | 25 2 | |
| FMO | 15.62 0.83 | 17.253 0.51 | 29 3 | |
| Moderate | Proposed architecture | 9.24 0.48 | 10.427 0.25 | 15 1 |
| aggregation | MFO | 12.47 0.68 | 13.741 0.38 | 25 2 |
| MCM | 13.93 0.75 | 15.656 0.45 | 29 2 | |
| FMO | 16.78 0.89 | 18.351 0.55 | 34 3 | |
| High | Proposed architecture | 10.86 0.55 | 11.854 0.29 | 19 2 |
| concentration | MFO | 14.81 0.72 | 15.878 0.41 | 27 2 |
| MCM | 16.23 0.81 | 18.277 0.48 | 31 3 | |
| FMO | 18.67 0.92 | 19.212 0.58 | 36 3 |
From Table 1, it can be concluded that under low vehicle charging aggregation levels, the proposed architecture outperformed the comparison network architectures in all performance indicators. When vehicle charging aggregation was low, the proposed architecture converged in only 12 1 generations, with a solution time of 8.25 0.42 hours and an economic cost of 9.253 0.21 106 USD. In contrast, the economic cost for the FMO-based network architecture reached 17.253 0.51 106 USD, and the solution time for the MCM-based network architecture was 12.47 0.71 hours. Overall, the proposed architecture demonstrated superior performance in solution time, economic cost, and convergence generations, making it more suitable for EV charging network planning. Finally, the study compared the total system cost and user loss rate of the four network planning architectures under different maximum user charging attempt numbers, and the results are shown in Figure 11.
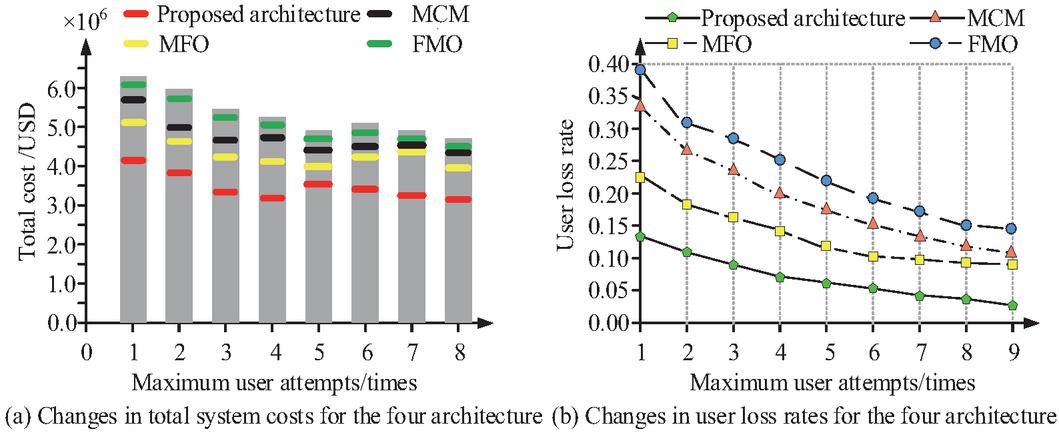
Figure 11 Experimental results of total system cost and user loss rate.
As shown in Figure 11(a), the maximum user charging attempt number was 3, the total cost for the proposed architecture was 3.37 106 USD. The total costs for the MFO and MCM network architectures were 4.39 106 USD and 4.57 106 USD, respectively, while the total cost for the FMO network architecture reached 5.42 106 USD. From Figure 11(b), it can be observed that the user loss rate curves for all four network architectures decreased as the maximum number of user charging attempts increased. The user loss rate for the proposed architecture was only 0.057 when the maximum number of user charging attempts was 4, while the user loss rates for the MFO, MCM, and FMO network architectures were 0.148, 0.197, and 0.259, respectively. These results indicate that the proposed architecture could better meet users’ charging demands, exhibiting good performance in resource allocation and cost control. To test the performance of the model under extreme weather conditions, the study selected three typical extreme weather conditions: heavy rain, blizzard and high temperature, and evaluated them from dimensions such as charging success rate, power grid stability and equipment reliability. The data is based on a 100-hour continuous operation test under simulated extreme weather scenarios.
Table 2 Performance evaluation of the model under extreme weather conditions
| Extreme | Research | ||||
| Weather Type | Evaluation Index | Model | MFO | MCM | FMO |
| Heavy rain | Charging success rate(%) | 92.3 | 78.5 | 72.1 | 65.8 |
| Average repair duration(h) | 1.2 | 3.5 | 4.8 | 5.2 | |
| Snowstorm | The fluctuation range of power grid load(%) | 5.1 | 9.8 | 12.3 | 15.6 |
| The offline rate of charging piles(%) | 8.7 | 22.4 | 28.9 | 33.5 | |
| High temperature | Frequency of equipment shutdown due to overheating (times per week) | 2.1 | 5.6 | 7.3 | 8.9 |
| Charging efficiency retention rate (%) | 90.5 | 76.2 | 70.3 | 63.7 |
It can be seen from Table 2 that in a rainstorm environment, the charging success rate of the research model reaches 92.3%, which is much higher than that of the comparison model. Moreover, its average repair time is only 1.2 hours, significantly reducing the fault recovery time. Under the snowstorm scenario, the fluctuation range of the power grid load of the research model is 5.1%, and the offline rate of charging piles is 8.7%. Compared with the model, the fluctuation and offline rate are higher. Under high-temperature conditions, the number of overheated shutdowns of the research model equipment was 2.1 times per week, and the charging efficiency retention rate reached 90.5%. The comparison model has more frequent shutdowns due to overheating and a rapid decline in efficiency, which affects its actual use. From this, it can be known that the research model has strong robustness under extreme weather conditions and can more reliably support the operation of the charging network.
5 Conclusion
To address the issues of unclear standards and high cost consumption in existing EV charging network planning, the study proposed an EV charging network planning algorithm that combines GNN, MOOA, and real-time data analysis. By monitoring the usage status and power output of charging stations, the algorithm reasonably allocates power resources, promoting the realization of remote monitoring and intelligent scheduling in the charging network. The experimental results showed that when the number of candidate charging stations was 20, the cost consumption of the proposed algorithm was only 1.23 10 USD, while the cost of the MFO algorithm and MCM algorithm reached 2.87 10 USD and 2.89 10 USD, respectively, with the FMO algorithm having the highest cost consumption at 4.19 10 USD. In cases of low vehicle charging concentration, the research architecture converged in just 12 1 generations, with a solution time of 8.25 0.42 hours and an economic cost of 9.253 0.21 10 USD. In comparison, the FMO-based network architecture had an economic cost of 17.253 0.51 10 USD, and the MCM-based network architecture had a solution time of 12.47 0.71 hours. Based on the experimental results, it can be concluded that the proposed network planning architecture offers more reasonable resource allocation, ensuring the efficient operation of charging stations during high vehicle charging concentration, and demonstrates better applicability compared to the contrastive network architectures. However, when the maximum number of user charging attempts was relatively low, the user loss rate of the proposed algorithm did not show a significant performance advantage compared to the comparison algorithms. Moreover, the research has not fully discussed its potential limitations in solving complex optimization problems, such as computational complexity and local optima, which may affect the practical application effect of the algorithm. The research focuses on the optimization of the charging network itself and does not fully consider the collaborative planning with transportation modes such as public transportation and bicycles. However, the framework proposed in the research has the following limitations that need to be further explored: Firstly, the performance of the framework is highly dependent on the quality of real-time data. It needs to rely on high-precision continuous data such as the charging status of electric vehicles, grid loads, and user trajectories to achieve optimization. If the data stream is incomplete or contains noise, it will lead to an increase in the prediction error of GNN node states, a decrease in the completion rate of MOOA charging tasks, and a lag in the adjustment of charging strategies. Secondly, when the maximum number of charging attempts by the user is 2, the algorithm has insufficient adaptability to scenarios where the user has low trial patience. Thirdly, the impact of complex optimization problems such as computational complexity and local optimality has not been fully discussed. Fourth, the coordinated planning with public transportation, bicycles and other means of transportation has not been taken into consideration. Future research will carry out targeted optimization: (1) Develop a data preprocessing module with noise reduction and missing value compensation to enhance the robustness of low-quality data; (2) Optimize the MOOA objective function (increase the weight of user trial cost) to adapt to scenarios with a low number of attempts; (3) By integrating an adaptive search strategy, the computational complexity is reduced and local optima is avoided; (4) Integrate multiple transportation data, explore the spatial coupling layout of charging stations with bus hubs and shared bike parking spots, and enhance the adaptability of comprehensive transportation planning.
Funding
The research is supported by Guizhou Power Grid “14th Five-Year Plan” Charging Infrastructure Integration into Distribution Network Planning Research (0676002024030201PW00007).
Competing Interests
The authors have no relevant competing interests to disclose.
References
[1] QuHaohao, KuangHaoxuan, WangQiuxuan, LiJun, YouLinlin. A Physics-Informed and Attention-Based Graph Learning Approach for Regional Electric Vehicle Charging Demand Prediction. IEEE Transactions on Intelligent Transportation Systems, 2024, 25(10): 14284–14297.
[2] Chen L, He L, Zhou Y. An Exponential Cone Programming Approach for Managing Electric Vehicle Charging. Operations Research, 2024, 72(5): 2215–2240.
[3] Ullah I, Zheng J, Jamal A, Zahid M, Almoshageh M, Safdar M. Electric vehicles charging infrastructure planning: a review. International Journal of Green Energy, 2024, 21(7): 1710–1728.
[4] Kmay O B, Gzara F, Alumur S A. Charging Station Location and Sizing for Electric Vehicles Under Congestion. Transportation science, 2023, 57(6): 1433–1451.
[5] Alansari M, Al-Sumaiti A S, Abughali A. Optimal placement of electric vehicle charging infrastructures utilizing deep learning. IET intelligent transport systems, 2024, 18(8): 1529–1544.
[6] Cao G, Sun G, Yuan S, Yue Y, Wu Y. Multiobjective Optimization of Spiral Guide Vanes for Boosting Separation Performance of Cyclone Separators. Industrial & Engineering Chemistry Research, 2024, 63(20): 9162–9175.
[7] Xu T, Luo J, He X, Li C, Zhang X. Wave aberration corrections in PSF ellipticity measurements of astronomical telescopes using a multi-objective optimization. Applied Optics, 2024, 63(3): 743–756.
[8] Kermani A, Ehsani A. Multi-objective optimization of a sandwich structure with a hybrid composite grid core. Advances in Structural Engineering, 2023, 26(1): 137–152.
[9] Liu J, Liu Y. High-Throughput Real-Time Reliable Data Collection in Wireless Sensor Network: Implementation and Analysis. IEEE sensors journal, 2024, 24(17): 28251–28266.
[10] Woo-Kyun Jung, Song Y, Suh E S. Garment production line optimization using production information based on real-time power monitoring data. Systems engineering, 2024, 27(2): 338–353.
[11] Kathirvel K, Ragavan S, Balashanmugham A, Sundaram M G. Hybrid methodology-based energy management of microgrid with grid-isolated electric vehicle charging system in smart distribution network. Electrical engineering, 2024, 106(3): 2705–2720.
[12] Fareed A, Mohd B. Allocation of plug-in electric vehicle charging station with integrated solar powered distributed generation using an adaptive particle swarm optimization. Electrical engineering, 2024, 106(3): 2595–2608.
[13] Arjun V, Selvan M P. Assessing the need for network-based technical constraints in economic optimization of electric vehicle charging. Electrical engineering, 2023, 105(3): 1629–1641.
[14] Huang N, Hu L, Wang R, Cai G, Guo Y, Zhao X. Multi-Objective Optimal Scheduling of Distribution Network with Electric Vehicle Charging Load Considering Time-Varying Road Impedance. Journal of Electrical Engineering & Technology, 2023, 18(4): 2667–2681.
[15] Ferraz R S F, Ferraz R S F, Medina, Augusto C. Rueda C. Fardin, Jussara F. F. Multi-objective approach for optimized planning of electric vehicle charging stations and distributed energy resources. Electrical engineering, 2023, 105(6): 4105–4117.
[16] Chen H, Niu S, Shao Z, Jian L. Recognizing Multitype Misalignments in Wireless EV Chargers with Orientation-Sensitive Coils: A Data-Driven Strategy Using Improved ResNet. IEEE transactions on industrial informatics, 2024, 20(1): 280–290.
[17] Shweta M, Anoop A. Optimal planning of power distribution system employing electric vehicle charging stations and distributed generators using metaheuristic algorithm. Electrical engineering, 2024, 106(2): 1373–1389.
[18] Elkasrawy M A, Abdellatif S O, Ebrahim G A, Ghali H A. Real-time optimization in electric vehicle stations using artificial neural networks. Electrical Engineering, 2023, 105(1): 79–89.
[19] Zhang Z, Liu S, Xiong Q, Liu Y. Strategic Integration of Machine Learning in the Design of Excellent Hybrid Perovskite Solar Cells. The Journal of Physical Chemistry Letters, 2025, 16(3): 738–746.
[20] Zhang J, Jing W, Lu Z, Wu H, Wen X. Collaborative strategy for electric vehicle charging scheduling and route planning. IET Smart Grid, 2024, 7(5): 628–642.
[21] Jiahuan Wang, Haixiao Jia, Xuejiao Bai, et al. Research on The Location of Railway Train in Tunnel Based on Factor Graph Optimization[J]. Applied Computer Letters, 2023, 7(1), pp. 5–10.
[22] Jiahuan Wang, Haixiao Jia, Peifen Pan, et al. Research on The Technology of Man-Machine Collision Early Warning System in Tunnels Based on Bds High-Precision Positioning in Tunnel[J]. Applied Computer Letters, 2023, 7(1).
Biographies

Pengcheng Zhang, male, born in May 1996, from Sinan, Guizhou, Han ethnicity. He graduated with a master’s degree from Tongji University in 2021 and has been working at the Power Grid Planning Research Center of Guizhou Power Grid Co., Ltd. Since graduation, his main research areas include primary planning of distribution networks and new power systems. During this period, he has won multiple awards from Southern Power Grid Corporation and Guizhou Power Grid Corporation. Published over 5 academic papers, conducted 3 research projects, and obtained over 5 patents.

Jinsen Liu, Male, born in May 1983, from Cangzhou, Hebei, Han ethnicity. He graduated with a master’s degree from Guizhou University and has been working at the Power Grid Planning and Research Center of Guizhou Power Grid Co., Ltd. Since graduation, his main research areas include primary planning of distribution networks and new power systems. During this period, he has won multiple awards from Southern Power Grid Company and Guizhou Power Grid Company. Published over 15 academic papers, conducted 10 research projects, and obtained over 10 patents.

Ning Luo, female, born in February 1986, from Kaifeng, Henan, Han ethnicity. She graduated with a master’s degree from Guizhou University and has been working at the Power Grid Planning Research Center of Guizhou Power Grid Co., Ltd. since graduation. Her main research areas include primary planning of distribution networks and new power systems. During this period, she has won multiple awards from Southern Power Grid Corporation and Guizhou Power Grid Corporation. Published more than 10 academic papers and obtained over 10 patents.

Ludong Chen, male, born in November 1986, from Bijie, Guizhou, of the Miao ethnic group. He graduated from Guizhou University with a bachelor’s degree and has been working at the Power Grid Planning and Research Center of Guizhou Power Grid Co., Ltd. since graduation. His main research areas include primary planning of distribution networks and new power systems. He has published over 4 academic papers and obtained more than 5 patents.

Fei Zheng, male, born in December 1995, is from Zheng’an, Guizhou. He is of Han ethnicity and graduated with a master’s degree from Guizhou University. Since graduation, he has been working at the Power Grid Planning Research Center of Guizhou Power Grid Co., Ltd. His main research areas include secondary planning of distribution networks and distribution automation. Published more than 5 academic papers and obtained over 2 patents.
Distributed Generation & Alternative Energy Journal, Vol. 40_5&6, 1331–1356.
doi: 10.13052/dgaej2156-3306.405617
© 2025 River Publishers