Optimization Method for Energy Network Consumption Considering Marketing Objectives of Energy Vehicles
Nan Jiao1, 2, Kewei Zhang3,* and Hang Su1
1Business School of College of Humanities & Information Changchun University of Technology, Changchun, 130122, China
2Department of Global Business Administration of Shinhan University, Gyeonggi-do, Uijeongbu City, 11644, South Korea
3Chassis Development Department of FAW Jiefang Commercial Vehicle Development Institute, Changchun, 130000, China
E-mail: 15665850272@163.com
*Corresponding Author
Received 19 June 2025; Accepted 15 July 2025
Abstract
As new energy vehicles continue to advance rapidly, a large number of charging stations and new energy generation systems have been established in various regions based on marketing goals. This study proposes an energy network consumption model based on energy integration strategy to address the effective consumption of intermittent and fluctuating energy in the power grid. By integrating different types of charging stations and intelligently adjusting prices at different time periods based on actual electricity consumption, the model accelerates energy consumption. The experiment outcomes indicate that the new model increases electricity consumption from 7208 kWh to 11240 kWh, reduces abandoned electricity from 4059 kWh to 27 kWh, and increases the profit of charging stations from 3604 yuan to 5620 yuan. In practical applications in a certain area, user consumption has decreased by 33.52%. From this, he new model can absorb energy networks and reduce resource waste. The research not only enhances the steadiness and economy of the energy network, but also reduces the charging cost for users, providing a new technology for promoting the development of new energy vehicles and improving the grid’s ability to absorb renewable energy.
Keywords: New energy vehicles, energy network, energy storage, consumption, battery, charging station, marketing.
1 Introduction
With the increasing worldwide awareness of preserving the natural environment and escalating energy shortage situation, the new energy vehicle market has brought about unprecedented chances for growth, and the marketing goals of new energy vehicles are growing year by year [1, 2]. Correspondingly, renewable energy sources such as solar and wind power are becoming increasingly crucial components of the power system as clean and sustainable forms of energy [3]. Solar energy, as a clean and renewable energy source, has experienced rapid technological development [4, 5]. The development of wind energy storage technologies, such as lithium-ion batteries, flywheel energy storage, and compressed air energy storage, effectively balances the supply and demand of wind energy and improves its utilization [6]. To achieve sustainable energy supply and reduce carbon emissions, power planning needs to be combined with the integration of renewable energy to meet the growing new energy marketing goals and electricity demand [7, 8]. New energy consumption refers to the process of effectively integrating the electricity generated by power plants into the grid and consuming it. It is of great significance for achieving power supply and demand balance, improving grid operation stability, and promoting green energy transformation.
Many scholars have investigated the utilization of renewable energy. Wang K et al. proposed a microgrid optimization scheduling method that considered the consumption of new energy to address the issue of a low percentage of renewable energy usage in microgrids and decrease operational expenses of the system. The experiment results showed that the improved algorithm was in line with the prompt scheduling of individual microgrid components discussed herein, and promoted the integration of new energy while ensuring system economy [9]. Garcia AVM et al. proposed a hybrid renewable energy system to foster the sustainable growth of renewable energy. Experiment results showed that the hybrid renewable energy system could reduce 2838 tons of carbon dioxide emissions annually and generate 553 kWh of electricity using non-renewable energy sources [10]. Alzoubi proposed an energy prediction scheme based on data fusion technology to enhance the efficiency of renewable energy utilization. The experiment outcomes indicated that this scheme had a prediction accuracy of 92% and could effectively allocate new energy [11]. Shi B et al. raised a routing protocol grounded on ant colony optimization algorithm to reduce the energy consumption of sensors in IoT networks. The experiment results showed that compared with existing methods, the proposed method could retain more than 40% of energy [12]. Wu W et al. proposed a parameter optimized adaptive fractional order grey Bernoulli model to study the total energy consumption of a certain area in response to energy policies. The experiment outcomes indicated that the mean absolute validation percentage errors of the new model in total energy consumption, coal consumption, and natural gas consumption were smaller than those of the comparative model, which were 1.31%, 1.43%, and 2.41%, respectively [13]. Liu E et al. proposed a method that introduced soft frost search strategy, hard frost penetration mechanism, and positive greedy selection mechanism to minimize energy consumption and carbon emissions of compression stations. The experiment results demonstrated that the new method reduced the total carbon emissions by 10.68%, providing a new method for operational guidance in this field [14]. Nagarajan M K et al. raised a hybrid metaheuristic algorithm to achieve optimal energy consumption selection in order to enhance the power effectiveness of wireless sensor networks. The simulation results showed that the protocol outperformed the benchmark protocol in terms of energy efficiency and load balancing, and could effectively absorb new energy [15].
Although these methods have achieved certain results in new energy consumption, system operation cost reduction, energy prediction accuracy, and network energy consumption reduction. They generally have limitations in generalization ability, dependence on specific conditions, high initial cost, strong dependence on data quality, insufficient adaptability, complex parameter determination, high computational cost, and slow algorithm convergence speed. These limitations limit their widespread promotion and continuous optimization in practical applications. In order to enhance the energy network’s ability to absorb intermittent and fluctuating energy under the marketing objectives of new energy vehicles, while optimizing the operational efficiency of charging stations and user charging costs, a Consumption Model of Energy Network (CMOEN) based on Energy Integration Strategy (EIS) is proposed. The CMOEN model optimizes the allocation of power resources through intelligent scheduling and demand response mechanisms to cope with changes in charging demand at different time periods, ensuring efficient and stable operation of charging stations. The innovation of the CMOEN model lies in its comprehensive consideration of the charging user demand and the reuse of retired batteries under marketing objectives, achieving optimized scheduling and consumption of distributed generation energy networks. The CMOEN model provides strong support for the promotion and sales of new energy vehicles by analyzing consumer behavior and market trends in depth. It improves energy efficiency, reduces energy waste, enhances the economic benefits of charging stations, and reduces user charging costs. The CMOEN model can be directly applied to the operation and management of charging stations in practical scenarios, such as guiding users to charge off peak by adjusting the peak valley difference of electricity prices, or constructing distributed energy storage systems using retired batteries. It can not only enhance the power grid’s ability to absorb renewable energy, but also reduce the loss of abandoned electricity at charging stations. At the same time, the CMOEN model can also reduce charging costs through user participation in demand response, forming a win-win situation of “power grid – charging station – user”.
2 Method and Materials
2.1 Design of EIS
With the speedy prosperity of renewable energy, the large-scale grid connection of Distributed Power Generation Energy Network (DPGEN) in the distribution network has brought unprecedented challenges [16]. Especially in the case of limited grid regulation capacity, how to effectively absorb these intermittent and fluctuating energy sources has become a challenge [17]. In response to this issue, a new EIS has been proposed to integrate resources of various types of electric vehicle charging stations, providing a foundation for the consumption of DPGEN. The EIS also considers the integration of marketing objectives. By analyzing the load characteristics of different types of electric vehicle charging stations, demand response strategies are formulated to promote the achievement of marketing goals for new energy vehicles. The overall structure of EIS is in Figure 1.
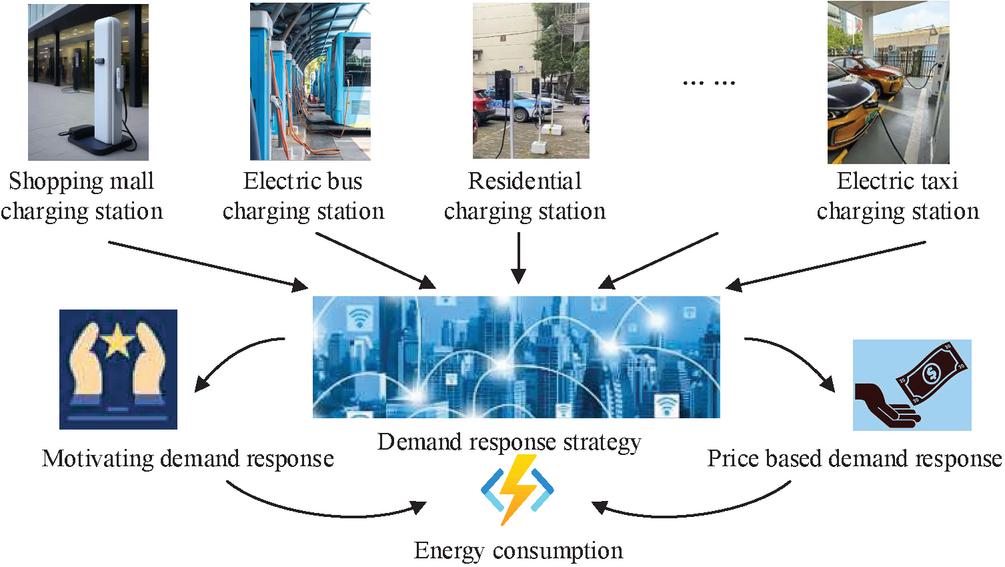
Figure 1 Overall EIS structure.
As shown in Figure 1, the core of EIS lies in utilizing the flexibility and schedulability of electric vehicle charging stations, and achieving unified management and regulation of loads for different types of charging stations through electric vehicle charging station operators. Firstly, collect data from different types of electric vehicle charging stations. The basic data of charging stations includes static parameters such as the number, power level, and geographical distribution of charging piles for different types of charging stations (residential areas, taxis, buses). User behavior data includes dynamic behavioral characteristics such as charging time distribution, charging duration, and charging frequency of electric vehicle users. Then, based on their respective load characteristics and consumption capacity, combined with the characteristics of distributed power sources, adjust the charging priority and formulate corresponding demand response strategies. Before integrating power resources, it is necessary to first analyze the load situation of each charging station. The load of charging stations is primarily influenced by various factors such as time, user behavior, and battery configuration. The load analysis process of the charging station is shown in Figure 2.
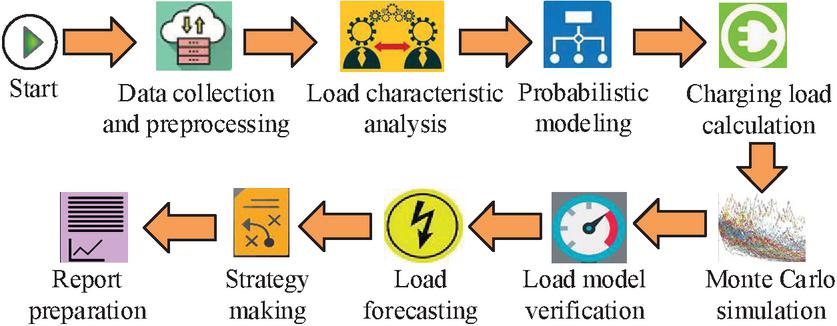
Figure 2 Load analysis process of charging station.
In Figure 2, the load analysis process of the charging station involves collecting and preprocessing data on the charging behavior of electric vehicles, analyzing charging characteristics, and establishing a probability model. Monte Carlo simulation is used to simulate the load curve of the charging station, verify the accuracy of the model, and predict future load trends based on the analysis results. Finally, strategies for operating the charging station and interacting with the power grid are formulated. In the process of data collection and preprocessing, the calculation for data standardization is shown in Equation (1) [18].
| (1) |
In Equation (1), is the standardized data, is the raw data, is the mean of the data, and is the standard deviation of the data. The normalization process is calculated as shown in Equation (2) [19].
| (2) |
In Equation (2), means the normalized data, represents the minimum value of the data, and represents the maximum value of the data. The Cook distance is used to evaluate the impact of data points on the model, and the calculation is shown in Equation (3) [20].
| (3) |
In Equation (3), represents the Cook distance, is the residual of the th data point, is the fitted value of the th data point, is the number of parameters in the regression model, is the mean square error, and is the leverage ratio of the th data point. The charging load prediction model adopts the machine learning method of selecting Random Forest (RF) as the charging load prediction [21]. The RF algorithm can calculate the importance of each feature, which is usually achieved by observing the impact of each feature on the model performance when constructing the decision tree. The calculation for feature importance is shown in Equation (4).
| (4) |
In Equation (4), is the out of bag error value of the out of bag data containing feature on each decision tree, is the out of bag error value calculated by re substituting the out of bag data containing feature a into the model after noise interference, and is the total number of decision trees. The prediction results of the RF model are determined by the average of the prediction results of all decision trees. For classification problems, the calculation method is shown in Equation (5) [22].
| (5) |
In Equation (5), is the total number of trees, and is the prediction function for the th tree. represents the predicted value of the classification problem. For regression problems, the predicted value is the average of the predicted values of all trees, calculated as shown in Equation (6) [23].
| (6) |
In Equation (6), represents the predicted value of the classification problem. When training RF models, the performance of the model can be optimized by adjusting its parameters. The arrival charging time and initial State of Charge (SOC) of electric vehicles are usually assumed to follow a normal probability distribution, and the corresponding probability density calculation method is shown in Equation (7) [24].
| (7) |
In Equation (7), represents the probability density of charging time, represents the time when the electric vehicle arrives at the charging station, represents the mean of the electric vehicle arrival time, and represents the standard deviation of the electric vehicle arrival time. The calculation method for the normal distribution of the initial SOC is shown in Equation (8) [25].
| (8) |
In Equation (8), means the probability density of the initial SOC, represents the SOC of the electric vehicle, represents the mean SOC, and means the standard deviation of the SOC. The calculation for charging duration is shown in Equation (9) [26].
| (9) |
In Equation (9), represents the required charging time, represents the target SOC, represents the initial SOC, represents charging power, represents charging efficiency, and represents constants related to battery characteristics. The formula for calculating the probability of the cumulative distribution function is shown in Equation (10).
| (10) |
In Equation (10), represents the probability that the charging start time is less than or equal to , and represents the error function. The power sources of some charging stations are photovoltaic and wind power, which have unstable conditions. For example, photovoltaic power often generates electricity better during the day, while wind power often generates electricity better in the evening and at night. The allocation of different cars at such charging stations is shown in Figure 3.
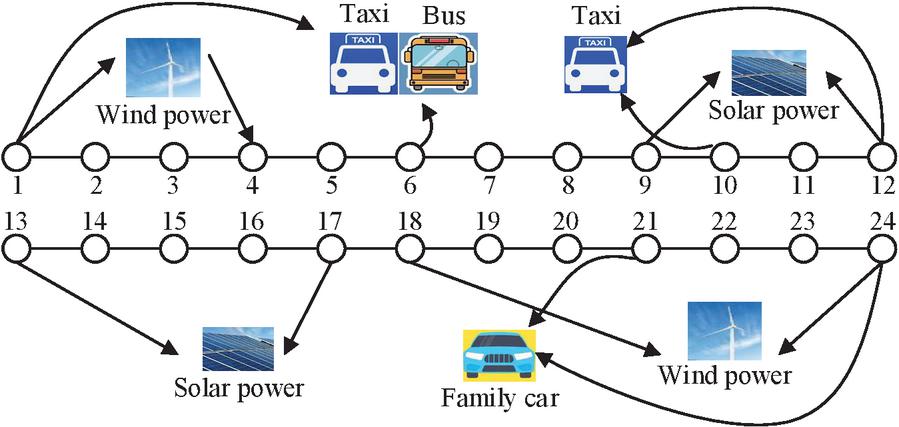
Figure 3 Charging distribution time of different vehicles in new energy driven charging stations.
From Figure 3, it can be seen that in the entire power supply system, wind power mainly has a high power generation during the time period from 18:00 to 4:00 the next day, while solar power mainly works during the time period from 9:00 to 17:00. The charging time of vehicles is mainly concentrated in the nighttime period, while family new energy vehicles have relatively fewer kilometers traveled during the day and have higher charging power. Therefore, the charging time is mainly concentrated between 21:00 and 24:00. During the day, solar power is mainly stored and supplied to vehicles for nighttime charging, in order to balance energy supply and demand. Intelligent scheduling and demand response mechanisms will optimize power distribution, adapt to fluctuations in charging demand, ensure efficient operation of charging stations, and help achieve marketing goals for new energy vehicles.
2.2 Establishment of Energy Network Consumption Model
The above process demonstrates that there is a significant matching problem between the charging demand of electric vehicles and the supply of renewable energy, especially in intermittent and fluctuating energy supply systems such as photovoltaic and wind power. In order to solve this problem and ensure effective energy consumption and stable operation of the power grid, a CMOEN model based on EIS is established. The CMOEN model will comprehensively consider the charging user demand and battery degradation under marketing objectives to achieve optimized scheduling and consumption of DPGEN. A demand response plan is a method used in the power system to balance supply and demand, improve energy efficiency, and reduce costs. In considering the DPGEN consumption strategy for the operation of electric vehicle charging station clusters, the demand response strategy structure is in Figure 4.
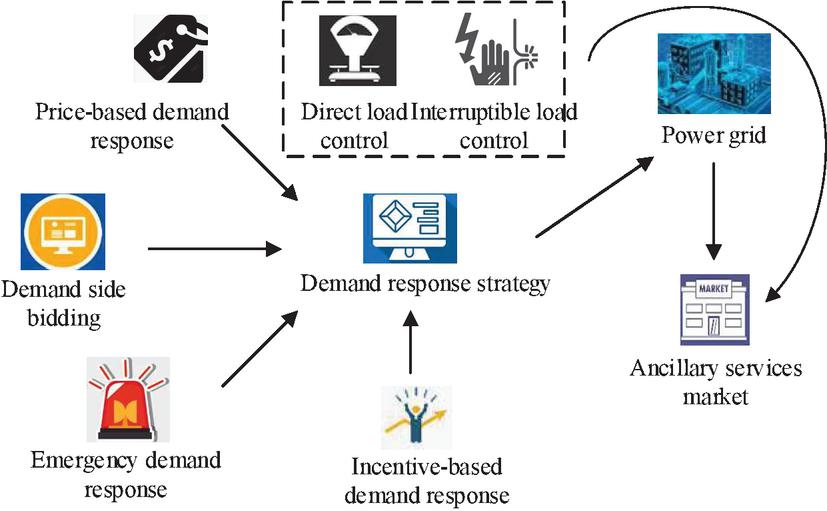
Figure 4 Demand response policy structure diagram.
As shown in Figure 4, the demand response strategy occupies a crucial position in the consumption of distributed generation resources in the operation of electric vehicle charging station clusters. It guides users to charge or reduce charging during low load periods of the power grid through incentive and price-based demand response mechanisms. This not only helps balance the load of the power grid, but also serves as an important means to achieve marketing goals. Among them, incentive-based demand response encourages user participation through economic compensation such as subsidies or discounts, while price-based demand response uses time of use electricity prices and real-time electricity prices to guide users to adjust their charging behavior according to changes in electricity prices. The incentive calculation is shown in Equation (11).
| (11) |
In Equation (11), represents the incentive amount, is the incentive coefficient, and represents the amount of electricity transferred during the response period. The formula for calculating the total incentive cost is shown in Equation (12).
| (12) |
In Equation (12), represents the total incentive cost, and represents the incentive cost at time . The formula for calculating price elasticity in response to price-based demand is shown in Equation (13).
| (13) |
In Equation (13), means the price elasticity value, means the change in demand, means the change in price, means demand, and represents price. The calculation method of the dynamic pricing model is shown in Equation (14).
| (14) |
In Equation (14), is the electricity price at time , is the base electricity price, is the price adjustment coefficient, and represents the demand deviation. The corresponding total cost calculation method is shown in Equation (15).
| (15) |
In Equation (15), represents the total cost and represents the demand for time . Direct load control and interruptible load control enable grid operators to adjust charging station power in emergency situations. Emergency demand response involves temporarily adjusting loads during power grid tension to maintain grid stability. Demand side bidding allows charging stations to participate in market peak shaving, while the ancillary service market provides support such as frequency regulation. Intelligent technology and user behavior analysis optimize charging plans, and transparent communication enhances user engagement. Transparent communication of information can enhance users’ understanding of grid operation and encourage their participation in demand response. These strategies aim to improve the charging station’s ability to consume DPGEN and promote new energy marketing goals. While reducing costs, enhance the flexibility and reliability of the system. The CMOEN model also needs to consider battery attenuation, which is an uncontrollable factor. The principle of attenuation is shown in Figure 5.
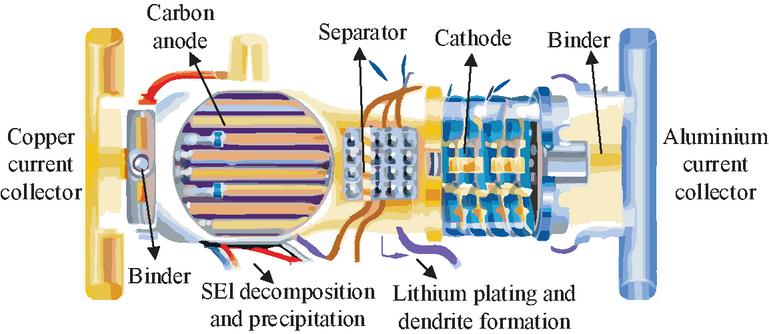
Figure 5 Battery attenuation schematic.
It can be seen from Figure 5 that the attenuation of lithium ion battery is mainly caused by anode aging, including the formation and growth of Solid Electrolyte Interface membrane (SEI), lithium deposition and dendritic formation, and structural changes of active materials. The SEI film protects the electrode but is unstable, leading to lithium consumption and electrolyte decomposition, increasing impedance and causing attenuation. Lithium dendrites may puncture the membrane, leading to short circuits and failure. The structural changes of active materials affect their performance. These factors interact with each other to affect battery life and reliability. From this, the CMOEN model needs to consider the attenuation characteristics of the battery in order to predict its service life and replacement cycle. For retired batteries, the model will consider the possibility and economic benefits of their cascading utilization, such as using retired batteries as energy storage systems when there is surplus electricity and as energy supply systems during periods of energy scarcity, further exploring the economic value of retired batteries. The process of the CMOEN model is shown in Figure 6.
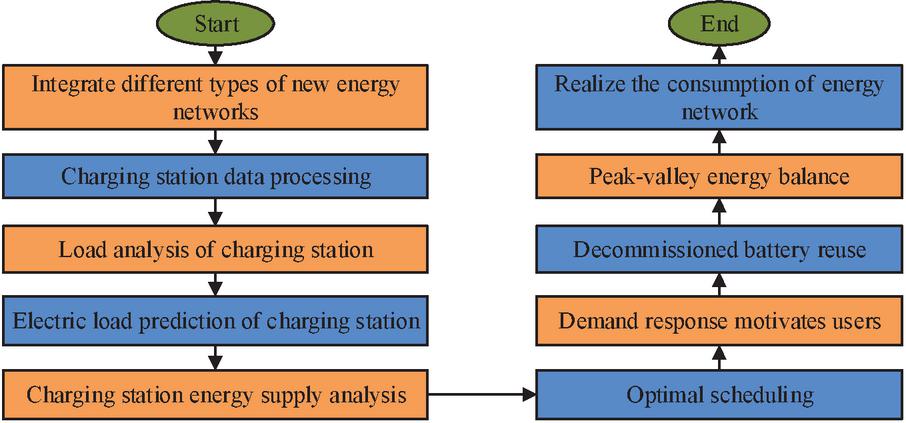
Figure 6 CMOEN model flow chart.
As shown in Figure 6, the CMOEN model first integrates the existing new energy system, summarizes and organizes the data of various charging stations, and obtains the basic data of system operation by predicting the power generation of new energy and the load demand of the power grid. Then the model adjusts the operation of the power grid based on the current state of the energy storage system and the demand response strategy. Then the model uses optimization scheduling models to develop power scheduling plans and optimize resource allocation. Considering that energy has certain marketing goals for each time period, relying solely on incentive plans to encourage users to consume it has certain limitations. Although the capacity of retired batteries has significantly decreased, affecting their endurance and making them unsuitable as the main battery for new energy vehicles, they can be used as energy storage devices to fully realize their value. Finally, the stability and economy of the power grid are ensured through real-time scheduling and control. Users can charge their vehicles at low electricity prices and discharge them at high electricity prices to earn the difference in electricity bills, thereby achieving effective consumption of new energy and efficient operation of the power grid, and achieving the marketing goals of new energy.
3 Result
3.1 Analysis of Energy Consumption of Different Types of Charging Stations Using CMOEN Model
To fully compare the energy consumption of various charging stations, a 24-hour energy consumption simulation experiment was conducted on a standard power system topology (Institute of Electrical and Electronics Engineers, IEEE) multi-node distribution system. The experimental platform adopts a power system simulation environment based on MATLAB and Simulink, combined with Python machine learning library for load forecasting. The hardware configuration includes an Intel i7 processor, 32 GB RAM, and NVIDIA RTX 3080 GPU to support large-scale matrix operations. The power grid model is based on the IEEE 33 node distribution system, consisting of 33 nodes and 37 branches, with a total length of 10.588 kilometers, a rated voltage of 12.66 kV, and a reference capacity of 100 MVA. The maximum load of the system is 3.79 MW and the minimum load is 1.23 MW, including distributed photovoltaic and wind power sources. The total capacity of the photovoltaic system is 4000 m, with a conversion efficiency of 15%. It is installed in a south facing direction with a tilt angle of 30. The wind power system adopts a horizontal axis wind turbine with a rated power of 1000 kW, a cutting in wind speed of 3 m/s, a cutting out wind speed of 25 m/s, and a rated wind speed of 12 m/s. The battery energy storage system adopts lithium iron phosphate batteries with a total capacity of 500 kWh, a maximum charging and discharging power of 100 kW, and a charging and discharging efficiency of 90%. In terms of demand response parameters, the price elasticity coefficient is set to 0.5, the incentive coefficient is 0.8, and the time of use electricity price is divided into three periods: peak, off peak, and off peak. The price adjustment coefficients are 1.5, 1, and 0.5, respectively. The power generation of photovoltaic and wind turbines was maintained within a certain range during power generation, while having a minimum power generation to maintain the basic operation of the system. The wind power utilization under different minimum power generation is shown in Figure 7.
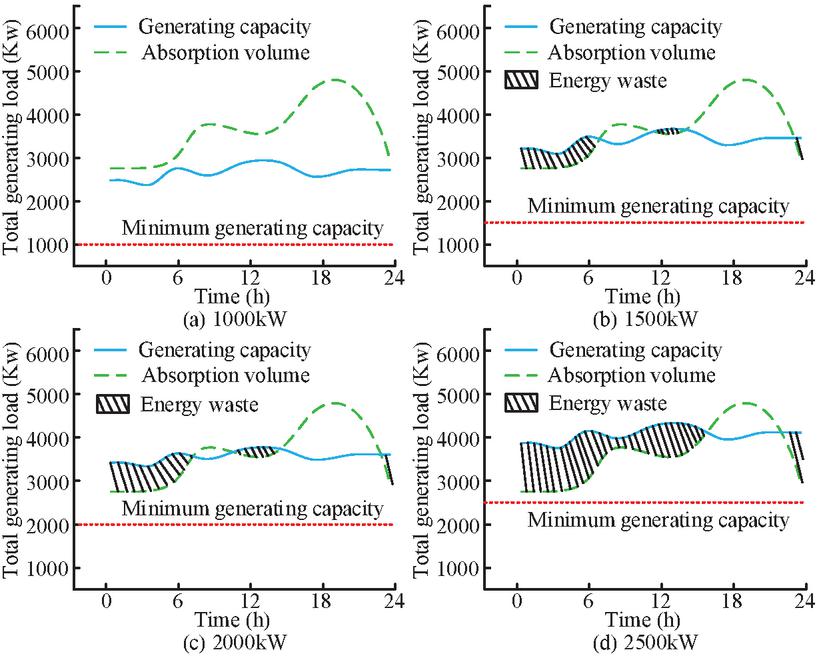
Figure 7 Wind power utilization under different minimum generating power.
As shown in Figure 7(a), when the minimum power generation was 1000 kW, there was also a severe shortage of energy at night. As shown in Figure 7(b), when the minimum power generation was 1000 kW, some energy was wasted during the early morning hours. The energy supply and demand situation during the day was basically balanced, and the energy supply from 17:00 to 22:00 could not fully meet the required energy. As shown in Figure 7(c), when the minimum power generation was 2000kW, there was also a certain degree of energy waste during the noon period. As shown in Figure 7(d), when the minimum power generation was 2500 kW, a large amount of energy was wasted, and the wasted energy was much higher than the energy shortage from 17:00 to 21:00. In summary, when the minimum power generation of the corresponding photovoltaic and wind power systems in the node was 2000 kW, the overall energy could be fully utilized. The CMOEN model encouraged users to store energy during periods of low energy demand through incentive mechanisms and other means, avoiding waste caused by excessive energy consumption. At the same time, retired batteries were also used for energy storage, and users were encouraged to release energy during the high energy demand period from 17:00 to 22:00, in order to achieve full energy absorption. When the minimum power generation of the power generation system was 2000 kW, there was surplus energy in the entire power generation system during the periods of 0:00 to 6:00 and 11:00 to 16:00. The surplus amounts of different types of energy at different times are shown in Table 1.
Table 1 Various types of energy surplus at different times
| Time | 0:00–1:00 | 1:00–2:00 | 1:00–2:00 | 3:00–4:00 | 4:00–5:00 | 5:00–6:00 |
| Wind power margin(Kwh) | 0 | 0 | 0 | 0 | 0 | 0 |
| Photovoltaic margin(Kwh) | 503 | 501 | 509 | 508 | 441 | 116 |
| Time | 11:00–12:00 | 11:00–12:00 | 13:00–14:00 | 14:00–15:00 | 15:00–16:00 | / |
| Wind power margin(Kwh) | 61 | 10 | 12 | 17 | 0 | / |
| Photovoltaic margin (Kwh) | 267 | 291 | 278 | 287 | 258 | / |
According to Table 1, when the minimum power generation of the power generation system was 2000 kW, the surplus energy during the nighttime period from 0:00 to 6:00 was mainly wind energy, and photovoltaics did not participate in power generation. During the daytime from 11:00 to 16:00, photovoltaic power generation was at its maximum, and there were fewer vehicles charging at this time, resulting in a large amount of surplus photovoltaic energy. The wind energy during the day was relatively low and unstable, so the fluctuation of wind energy was relatively large. From this, there was a significant surplus of wind power and photovoltaic power during this period, which could be effectively absorbed using the CMOEN model. When the minimum power generation of the power generation system was 2000 kW, the consumption capacity of surplus energy by various charging stations using the CMOEN model is shown in Figure 8.
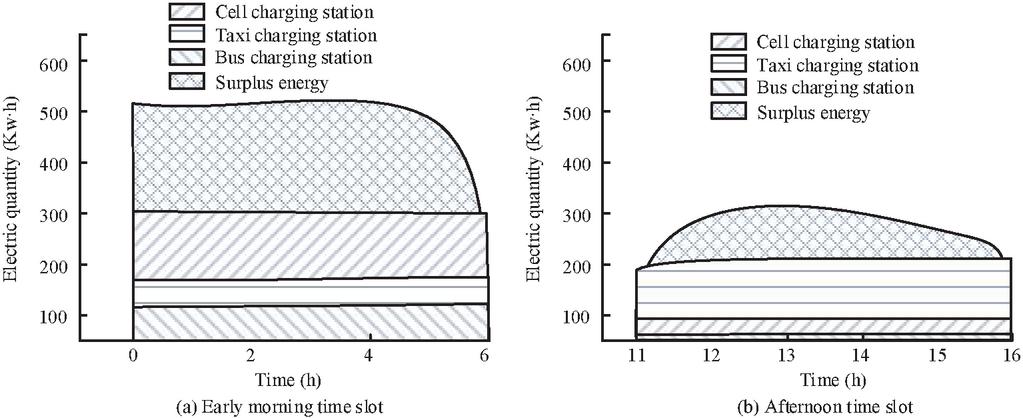
Figure 8 The capacity of various charging stations to absorb excess energy.
As shown in Figure 8(a), during the time period from 0:00 to 6:00, the cell charging stations were the main force for the consumption of surplus energy. Due to the fact that vehicles in residential areas are usually parked inside the community all night and can be charged at scheduled times, users will be more willing to charge during this time period, influenced by the CMOEN model incentive strategy. Taxi charging stations and bus charging stations usually stop when fully charged and then leave their positions, without setting automatic charging times. From Figure 8(b), it can be seen that between 11:00 and 16:00, the cell charging stations and bus charging stations consumed very little surplus energy. At this time, it was mainly the taxi charging stations that consumed it, because only taxi drivers have free time to charge during this period. It can be seen that the total energy consumption capacity of all types of charging stations under the CMOEN model was just enough to consume all surplus energy.
3.2 Performance Comparison of CMOEN Models
The use of CMOEN model for energy integration of various charging stations can help effectively absorb surplus energy. To further analyze the performance of the CMOEN model, a Mixed Integer Linear Programming (MILP) model and a Dynamic Programming (DP) model were used as comparative models. The comprehensive situation of charging station price adjustment and load under different models is shown in Figure 9.
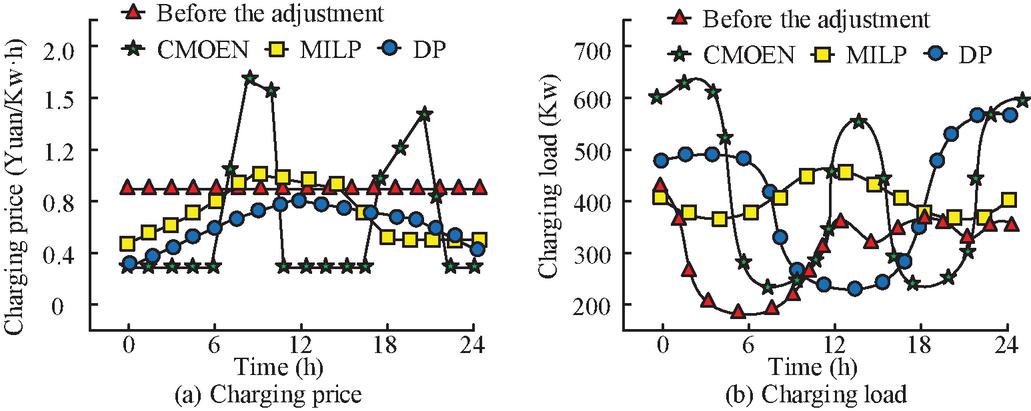
Figure 9 A synthesis of charging station price adjustment and load under different models.
From Figure 9(a), the original charging price of the charging station was a 24-hour uniform price. After adjustment by the CMOEN model, the price changes at different time periods were more obvious. However, although the charging prices adjusted by the MILP and DP models changed, the price difference was not significant. As shown in Figure 9(b), the load of the charging station before adjustment was mainly concentrated in the afternoon period, and a large amount of electricity was wasted. After adjusting the CMOEN model, users’ willingness to use charging stations significantly increased. During periods of lower prices, users were more willing to consume energy and then charge for discharging energy during periods of higher prices. The energy consumption effect of CMOEN model was directly reflected in the load of charging stations. The effects of MILP and DP models after adjustment were generally average. From this, the CMOEN model was more capable of mobilizing users to consume energy during periods of surplus energy, reducing energy waste. The daily profit and user consumption of the charging station before and after applying various models are shown in Table 2.
Table 2 Profit and user consumption of charging stations after applying various models
| Electricity | Discharge | Charging | User | |
| Consumption | Capacity | Station | Consumption | |
| Model | (Kwh) | (Kwh) | Profit (Yuan) | (Yuan) |
| Before | 7208 | 4059 | 3604 | 8766 |
| CMOEN | 11240 | 27 | 5620 | 6182 |
| MILP | 8074 | 3193 | 4037 | 6459 |
| DP | 10217 | 1050 | 5109 | 7152 |
According to Table 2, after applying various models, there were significant changes in the operation of the charging station. Due to the significant adjustment of charging station prices by the CMOEN model, the total electricity consumption of charging stations significantly increased, resulting in a significant increase in their profits. Specifically, compared to the original situation, the CMOEN model increased its electricity consumption from 7208 kWh to 11240 kWh, with an increase of 55.9%. This indicated that the CMOEN model could more effectively utilize electricity resources. At the same time, the abandoned electricity was reduced from 4059 kWh to 27 kWh, which may mean that the CMOEN model reduced unnecessary energy waste through optimized scheduling, thereby improving energy utilization efficiency. In terms of profit, the CMOEN model increased the profit of charging stations from 3604 yuan to 5620 yuan, an increase of 55.9%, which is the highest profit increase among all models, demonstrating the economic advantage of the CMOEN model. The decrease in user consumption from 8766 yuan to 6182 yuan indicated that the CMOEN model achieved maximum profit while improving user satisfaction and service quality. The use of various models at a charging station for a period of time is shown in Figure 10.
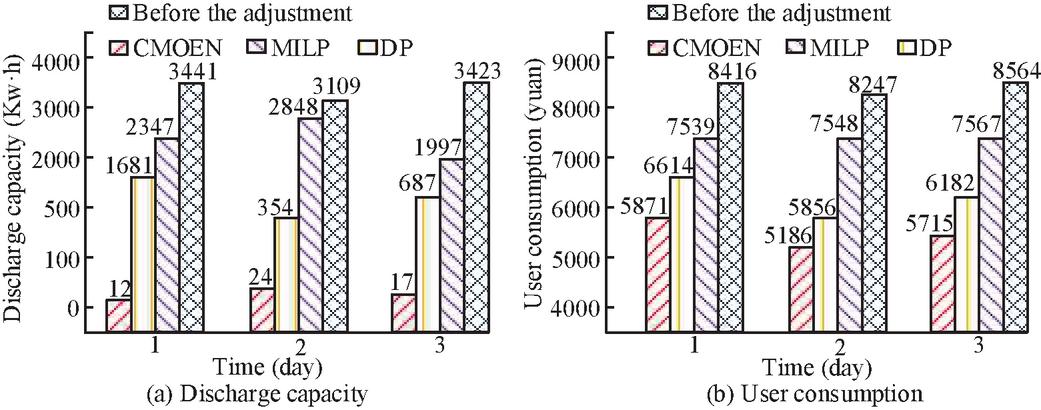
Figure 10 The actual effect of each model applied in a charging station.
From Figure 10(a), the CMOEN model exhibited good energy consumption in the area, with a minimum abandoned power of 12 Kwh, which was superior to the MILP and DP models. According to Figure 10 (b), the CMOEN model could stably reduce users’ charging costs, with an average reduction of 33.52% compared to before using the CMOEN model, which was better than the 26.06% of the second DP model. From this, the CMOEN model had a positive effect on energy consumption, and lower charging costs were also beneficial for the marketing of new energy vehicles as a whole. In order to verify the progressiveness of CMOEN model, the research also uses Particle Swarm Optimization (PSO) model, Fuzzy Logic Control (FLC) model and Deep Reinforcement Learning (DRL) model as comparison. The performance of each model is shown in Table 3.
Table 3 Performance of each model
| Electricity | Abandoned | Profit of | User | Calculation | |
| Consumption | Electricity | Charging | Consumption | Time | |
| Model | (kWh) | (kWh) | Station (Yuan) | (Yuan) | (Min) |
| Original | 7208 | 4059 | 3604 | 8766 | / |
| situation | |||||
| CMOEN | 11240 | 27 | 5620 | 6182 | 12.45 |
| PSO | 9856.32 | 528.47 | 4892.15 | 6843.27 | 18.63 |
| FLC | 10123.58 | 897.36 | 5014.72 | 6985.43 | 15.21 |
| DRL | 11032.64 | 85.73 | 5516.89 | 6324.18 | 35.89 |
According to Table 3, the CMOEN model has significant advantages in energy consumption and economy. Its electricity consumption reached 11240.00 kWh, an increase of 1.88% compared to the DRL model and 14.04% compared to the PSO model. This is because CMOEN achieves precise matching between photovoltaic/wind power and charging loads through the cascading utilization of retired batteries and the coordination of time of use electricity prices. The abandoned electricity is only 27.00 kWh, significantly lower than DRL’s 85.73 kWh and FLC’s 897.36 kWh, indicating that it is more efficient in scheduling intermittent energy. The charging station has the highest profit of 5620.00 yuan, as the dynamic pricing mechanism effectively guides users to charge during off peak hours, improving energy utilization efficiency. The lowest user consumption was 6182.00 yuan, a decrease of 29.48% compared to the original situation, reflecting the user friendliness of the “low-cost charging+discharging profit” model. The calculation time is 12.45 minutes, which is better than DRL’s 35.89 minutes, indicating that CMOEN has both high efficiency and practicality in engineering applications. To sum up, CMOEN has achieved a better balance between consumption efficiency, economic benefits and calculation costs, which verifies its progressiveness.
4 Conclusion
This study aims to effectively absorb new energy and ensure the stable operation of the power grid, promote the marketing of new energy vehicles, and propose a CMOEN model based on EIS. The CMOEN model comprehensively considers the charging user demand and energy distribution at different time periods under marketing objectives to achieve optimized scheduling and consumption of DPGEN. The research results indicated that the CMOEN model performed well in simulating energy consumption over a 24-hour period on a standard power system topology. Compared with not using model optimization, the CMOEN model increased electricity consumption from 7208 kWh to 11240 kWh, reduced abandoned electricity from 4059 kWh to 27 kWh, and increased the profit of charging stations from 3604 yuan to 5620 yuan. In practical application in a certain place, it had the best effect, reducing user consumption by 33.52%. In summary, the CMOEN model had significant advantages in improving energy utilization efficiency, reducing energy waste, enhancing the economic benefits of charging stations, and reducing user charging costs. However, the CMOEN model requires a large amount of real-time data support during its implementation. If there are errors, missing or delayed data, it may lead to inaccurate predictions and decision-making errors; When integrating the CMOEN model with existing power systems and charging station operation management systems, compatibility issues may arise. In the future, more efficient data processing and prediction algorithms will be developed to improve the real-time and accuracy of models; Simultaneously carry out additional interface development and system modification work to enhance its compatibility.
References
[1] Yao L. New energy utilization in environmental design and realization. Energy Reports, 2022, 8(1): 9211–9220.
[2] Shokouhandeh H, Ahmadi Kamarposhti M, Asghari F, Colak I, Eguchi K. Distributed generation management in smart grid with the participation of electric vehicles with respect to the vehicle owners’ opinion by using the imperialist competitive algorithm. Sustainability, 2022, 14(8): 4770–4771.
[3] Cai W, Wu X, Zhou M, Liang Y, Wang Y. Review and development of electric motor systems and electric powertrains for new energy vehicles. Automotive Innovation, 2021, 4(1): 3–22.
[4] Habib S, Kamarposhti M A, Shokouhandeh H, Colak I, Barhoumi E M. Economic dispatch optimization considering operation cost and environmental constraints using the HBMO method. Energy Reports, 2023, 10(1): 1718–1725.
[5] Rusilowati U, Ngemba H R, Anugrah R W, Fitriani A, Astuti E D. Leveraging ai for superior efficiency in energy use and development of renewable resources such as solar energy, wind, and bioenergy. International Transactions on Artificial Intelligence, 2024, 2(2): 114–120.
[6] Zhang Y, Li R, Zhang J. Optimization scheme of wind energy prediction based on artificial intelligence. Environmental Science and Pollution Research, 2021, 28(29): 39966–39981.
[7] Liu Z, Deng Z, Davis S J, Giron C, Ciais P. Monitoring global carbon emissions in 2021. Nature Reviews Earth & Environment, 2022, 3(4): 217–219.
[8] Makahleh F M, Amer A, Manasrah A A, Attar H, Solyman A A, Kamarposhti M A, Thounthong P. Optimal management of energy storage systems for peak shaving in a smart grid. Computers, Materials and Continua, 2023, 75(2): 3317–3337.
[9] Wang K, Xie Y, Zhang W, Cai H, Liang F, Li Y. Research on optimal dispatch of distributed energy considering new energy consumption. Energy reports, 2023, 10(1): 1888–1898.
[10] Garcia A V M, Sánchez-Romero F J, López-Jiménez P A, et al. A new optimization approach for the use of hybrid renewable systems in the search of the zero net energy consumption in water irrigation systems. Renewable Energy, 2022, 195(1): 853–871.
[11] Alzoubi A. Machine learning for intelligent energy consumption in smart homes. International Journal of Computations, Information and Manufacturing (IJCIM), 2022, 2(1): 1–15.
[12] Shi B, Zhang Y. A novel algorithm to optimize the energy consumption using IoT and based on Ant Colony Algorithm. Energies, 2021, 14(6): 1709–1727.
[13] Wu W, Ma X, Zeng B, Zhang Y. A conformable fractional-order grey Bernoulli model with optimized parameters and its application in forecasting Chongqing’s energy consumption. Expert Systems with Applications, 2024, 255(2): 124534.
[14] Liu E, Li X, Zhou L, Lu X, Ma X. Optimization research on energy consumption and carbon emissions in hydrogen-blended natural gas pipeline networks considering compressor performance-A case study of the west-east gas pipeline (line 1). International Journal of Hydrogen Energy, 2024, 79(1): 221–237.
[15] Nagarajan M K, Janakiraman N, Balasubramanian C. A new routing protocol for WSN using limit-based Jaya sail fish optimization-based multi-objective LEACH protocol: an energy-efficient clustering strategy. Wireless Networks, 2022, 28(5): 2131–2153.
[16] Li L, Lin J, Wu N, Xie S, Meng C, Zheng Y, Zhao Y. Review and outlook on the international renewable energy development. Energy and Built Environment, 2022, 3(2): 139–157.
[17] Tirunagari S, Gu M, Meegahapola L. Reaping the benefits of smart electric vehicle charging and vehicle-to-grid technologies: Regulatory, policy and technical aspects. IEEE Access, 2022, 10(1): 114657–114672.
[18] Ikotun A M, Ezugwu A E, Abualigah L, Abuhaija B, Heming J. K-means clustering algorithms: A comprehensive review, variants analysis, and advances in the era of big data. Information Sciences, 2023, 622(1): 178–210.
[19] Henderi H, Wahyuningsih T, Rahwanto E. Comparison of Min-Max normalization and Z-Score Normalization in the K-nearest neighbor (kNN) Algorithm to Test the Accuracy of Types of Breast Cancer. International Journal of Informatics and Information Systems, 2021, 4(1): 13–20.
[20] Giraldo R, Leiva V, Christakos G. Leverage and Cook distance in regression with geostatistical data: methodology, simulation, and applications related to geographical information. International Journal of Geographical Information Science, 2023, 37(3): 607–633.
[21] Georganos S, Grippa T, Niang Gadiaga A, Linard C, Lennert M, Vanhuysse S, Kalogirou S. Geographical random forests: a spatial extension of the random forest algorithm to address spatial heterogeneity in remote sensing and population modelling. Geocarto International, 2021, 36(2): 121–136.
[22] Li H, Hao T, Li Z, Zhao E, Wang C, Xu L. Research on a self-coordinated optimization method for distributed energy resources targeting risk mitigation. Distributed Generation and Alternative Energy Journal, 2024, 39(3): 659–690.
[23] Hebbi C, Mamatha H. Comprehensive Dataset Building and Recognition of Isolated Handwritten Kannada Characters Using Machine Learning Models. Artificial Intelligence and Applications, 2023, 1(3):179–190.
[24] Zhao Z, Jiang Z, Li Y, Li C, Zhang D. Effect of loads on temperature distribution characteristics of oil-immersed transformer winding. Distributed Generation and Alternative Energy Journal, 2022, 37(2): 237–254.
[25] Jackins V, Vimal S, Kaliappan M, Lee M Y. AI-based smart prediction of clinical disease using random forest classifier and Naive Bayes. The Journal of Supercomputing, 2021, 77(5): 5198–5219.
[26] Sundarajoo S, Soomro D M. Artificial Neural Network-Based Voltage Stability Online Monitoring Approach for Distributed Generation Integrated Distribution System. Distributed Generation and Alternative Energy Journal, 2023, 38(06): 1839–1862.
Biographies

Nan Jiao obtained her Master’s degree in Curriculum and Teaching Theory from Northeast Normal University in 2019. She is a doctoral student at Sinhan University in South Korea. Currently serving as a faculty member in the Business School of College of Humanities & Information Changchun University of Technology, she was awarded the professional title of Lecturer in E-Commerce in 2022. Her research focuses on e-commerce and management studies.

Kewei Zhang Obtained a Bachelor of Engineering from Harbin Institute of Technology (2017) and Obtained a Master’s degree in Mechanical Engineering from Shandong University (2020). Presently, he is working as a chassis testing engineer in the Chassis Development Department of FAW Jiefang Company, Commercial Vehicle Development Institute. He is mainly responsible for the testing and verification of commercial vehicle chassis products. He obtained the titles of Assistant Engineer (2021) and Intermediate Engineer (2023).

Hang Su obtained his Ph.D. in Management Science and Engineering from Jilin University in 2006. Currently, he serves as a professor and the dean of the Business School of College of Humanities & Information Changchun University of Technology. He is a graduate supervisor. His research interests lie in marketing.
Distributed Generation & Alternative Energy Journal, Vol. 40_5&6, 923–946.
doi: 10.13052/dgaej2156-3306.40562
© 2025 River Publishers