Adaptive Monitoring Method for the Operation Status of Centrally Installed Switchgear Based on RFID and Finite Difference Time-domain Algorithm
Jie Wang, Zhiyong Hu*, Jianbo Zhang, Feng Zheng, Haijun Wang and Jingang Yao
State Grid Nanyang Power Supply Company Economic and Technical Research Institute, Nanyang, 473000, China
E-mail: HZY2023121@outlook.com
*Corresponding Author
Received 19 June 2025; Accepted 08 August 2025
Abstract
Centrally installed switchgear plays an important role in power system distribution. However, traditional manual monitoring methods have shortcomings in reliability, accuracy, and real-time monitoring of the temperature and operating status of switchgear. Therefore, a temperature monitoring system for radio frequency identification switchgear is designed to track temperature and humidity data in real-time and transmit it to cloud servers for daily management and fault diagnosis. In addition, the study proposes an improved monitoring strategy using the time-domain finite difference method. This strategy combines derivative and Fourier transform to capture and convert signals and creates a mathematical model with Support Vector Machine (SVM) to distinguish interference signals. The Lagrange function method is used to accurately obtain interference signals for wide-area interference monitoring. These experiments confirm that the research method exhibits excellent stability in processing interference signals, with minimal fluctuations, ensuring the reliability of monitoring. This method can cover a wide frequency range of 1832 Hz and demonstrates advantages in detecting interference in wide domain signals. By increasing the threshold, the accuracy of fault detection increases, and the training sample achieves a 100% recognition rate. When the threshold is 3.1, the accuracy of the test sample is the highest, reaching 98.3%, which can effectively achieve fault warning. The research method has improved the automation level of centrally installed switchgear monitoring, thereby enhancing the stability and reliability of the power system.
Keywords: Centrally installed switchgear, RFID, finite difference time-domain algorithm, temperature and humidity, monitor.
Introduction
Centrally Installed Switchgear (CIS) is an electrical device typically used in power systems to control, protect, and monitor power transmission and distribution. It plays an important role in substations or distribution systems, including various electrical components such as circuit breakers, isolation switches, relays, control devices, etc [1, 2]. The stable operation of CIS directly affects the reliability of data center services and business continuity. Real-time monitoring can detect potential faults and anomalies in the power system in advance, and promptly notify management personnel to take corresponding measures. This can reduce the risk of power system interruption and potential losses. In addition, analyzing accumulated operational data can provide predictive maintenance for equipment and enable more refined operation and maintenance management [3, 4]. However, China has not yet fully developed the mechanical structure and control system of high-voltage CIS. The real-time monitoring of the entire operating system is even more lacking, and some parameter designs are not yet mature [5]. At present, the core development of China’s smart grid utilizes advanced sensing technology to comprehensively and real-time monitor key parts of the grid, such as power generation, transmission, distribution, and consumption [6]. Secondly, efficient and reliable communication technologies are used to transmit and centrally process the data generated during power operation. Finally, analyzing these data can effectively allocate and optimize the overall resource allocation of the power grid. Radio Frequency Identification (RFID) is a type of automatic identification technology that enables tag recognition and data reading through radio waves [7]. Finite Difference Time-Domain (FDTD) is an important method for numerical calculation of electromagnetic fields, mainly applied in electromagnetic field analysis and sensor signal processing [8]. Based on the above analysis, an innovative CIS operation situation adaptive monitoring method based on RFID and FDTD is proposed. RFID tags have been installed on key components of CIS, coupled with sensors, to monitor their working status and environmental conditions in real-time. Meanwhile, the collected data are processed using FDTD.
The research aims to provide an efficient and accurate CIS operation situation monitoring solution for the power system, ensuring the stable operation and safety of the power system. The research contribution is mainly reflected in the following aspects. Firstly, at the theoretical level, RFID technology is combined with FDTD algorithm to construct a new adaptive monitoring framework, breaking through the limitations of traditional monitoring methods in real-time and anti-interference ability. Secondly, a new paradigm for signal processing based on central difference algorithm and Support Vector Machine (SVM) model is proposed in methodology, significantly improving the ability to extract and classify signal features in complex electromagnetic environments. In terms of engineering applications, an optimization scheme for power equipment monitoring is designed, including low-power wireless sensor networks and innovative RFID tag layout methods, providing a practical and feasible technical path for intelligent operation and maintenance of power systems. In addition, the study also expands the application boundaries of FDTD algorithm in the field of power equipment monitoring, providing new theoretical perspectives and methodological references for related research. These innovations not only have important academic value, but also have practical significance for improving the safety and reliability of power system operation.
The study adopts a four-section progressive structure. The first section comprehensively reviews the current research status in the field of power grid equipment monitoring, focusing on analyzing the characteristics and limitations of technologies such as the Internet of Things (IoT) and sensor fault diagnosis. The second section elaborates on the research methods, including a temperature monitoring system based on RFID and a comprehensive monitoring scheme integrating FDTD algorithm, with a focus on key technologies such as signal acquisition, feature extraction, and interference recognition. The third section verified the effectiveness of the proposed method through comparative experiments, evaluating it from multiple dimensions such as stability, anti-interference ability, and monitoring range. The fourth section summarizes the research results, objectively analyze the applicability and limitations of current methods, and provide suggestions for future research directions, providing reference for subsequent research.
1 Related Works
Technological innovation is driving the development of smart grids and providing direction for the improvement of the entire power grid system. CIS, as an important secondary distribution equipment, is closely related to the development of smart grids. Therefore, scholars at home and abroad have conducted extensive research. In response to the challenges of system integration, scalability limitations, and cross system collaboration, Bly A et al. developed a new method for intelligent power monitoring based on the IoT. They combined multiple data analysis techniques to provide decision support for building operation and maintenance. The system successfully achieved the expected goals in the experiment [9]. Kai Y A et al. proposed a sensor fault diagnosis method based on generalized quasi natural comparison testing, which quickly located faults. An optimized communication algorithm for building health monitoring systems was proposed. These experiments demonstrated the accuracy of this method [10]. Sharma et al. combined sequential floating forward selection method and artificial neural network to reduce feature dimensions through principal component analysis and select the optimal feature set. It successfully improved the performance of mechanical fault automatic recognition, which was superior to SVM [11]. Alcaiz A et al. proposed a new collaborative monitoring strategy to improve the power generation efficiency of residential photovoltaic systems and identify faults. This method utilized machine learning techniques to optimize the photovoltaic system, effectively distinguishing system faults from diagnosing actual faults, and adapting to new environmental changes [12].
Elewe A M et al. developed an RFID that could monitor chemical changes in train carriages in real-time. The system used RFID readers from two specific sites and labels on the carriages to collect data, demonstrating the efficiency and stability of its network design [13]. Miao Y et al. focused on IoT and RFID in smart cities, tracking inspection personnel through RFID to improve power detection efficiency. The effectiveness of this method was demonstrated by merging alarm data through an expert system [14]. Du S et al. solved the convergence of the solver in acoustic simulation using the time-domain finite difference method, which could predict room acoustic parameters at appropriate times [15]. Yang C et al. proposed a new FDTD algorithm that used an implicit Wendroff difference scheme and combined it with a field line coupling model to verify its efficiency and advantages. The experimental results showed that this algorithm was more effective than traditional methods [16].
In summary, there are some shortcomings in the current monitoring methods for the operation status of the power system. They are mainly manifested in low data processing efficiency, limited fault diagnosis accuracy, and weak adaptability to complex environments. In addition, as an important component of the power system, CIS also faces many challenges in monitoring its operational status. These challenges include inadequate reliability of monitoring equipment, outdated data collection and analysis methods, and inadequate response to emerging issues such as network security and environmental changes. Therefore, further innovation and improvement are necessary in the power system and CIS monitoring technology to enhance overall stability and efficiency. Therefore, a new adaptive monitoring method for CIS operation status is proposed, which monitors its real-time operation status to ensure its long-term stable operation.
2 Adaptive Monitoring Method for Centrally Installed Switchgear Operation Status
The designed RFID switchgear temperature monitoring system can track temperature and humidity data in real-time and send it to a data concentrator or cloud server. Operations personnel can take these data for daily management and fault diagnosis. Aiming at the insufficient stability of traditional wide area monitoring methods in communication interference signal processing, an improved monitoring strategy using the time-domain finite difference method is proposed. This strategy combines derivative and Fourier Transform (FT) to capture and convert signals, and a mathematical model with SVM is created to distinguish the types of interference signals. The Lagrange function method is used to accurately obtain interference signals, effectively conducting wide-area interference monitoring.
2.1 Design of a Temperature Real-time Monitoring System for Centrally Installed Switchgear Based on RFID
As the core of the power system, the efficiency and intelligence of the distribution process directly affect the overall performance. Intelligent CIS, as a secondary distribution equipment, is the key to achieving intelligence and informatization in the distribution process. Compared with the traditional CIS, intelligent CIS integrates control, protection, and monitoring functions, utilizing modern computer, sensor, automatic control, and internet communication technology. It is a new device for digitalization, informatization, and intelligence of power distribution systems [17]. Understanding the internal structure of intelligent CIS control devices is crucial before designing them. Taking KYN28A-12CIS as an example, Figure 1 shows its structure.
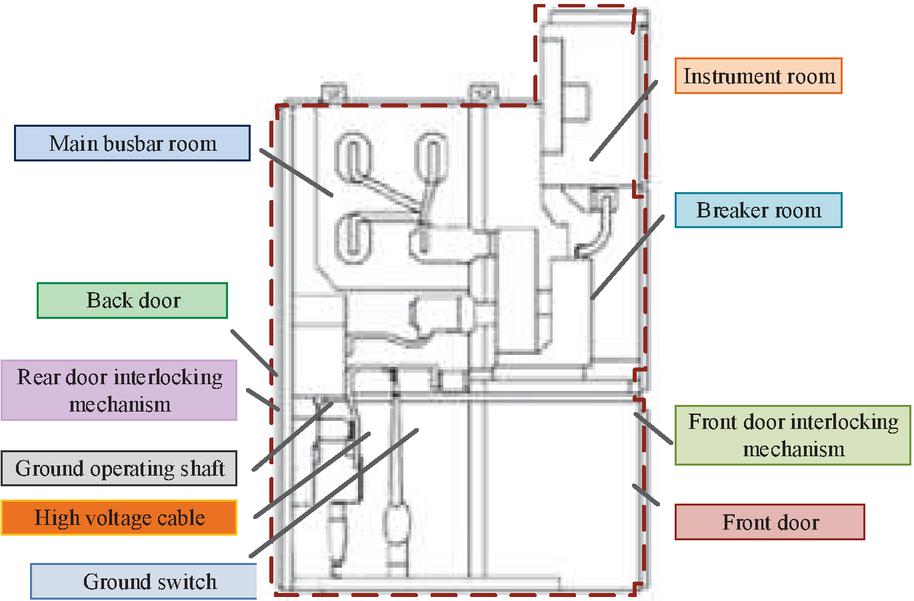
Figure 1 Structure diagram of the KYN28A-12 mid-cabinet.
In Figure 1, in its busbar compartment, multiple independent main busbars are connected to each other through branch busbars. The size and strength of each busbar meet specific dynamic and thermal stability requirements. In addition, it has become particularly important to develop a stable and intelligent temperature monitoring system to ensure the status and safe operation of the busbar. In the cable room of CIS, safety equipment such as lightning arresters and grounding busbars are installed to ensure their safe operation in various natural environments. RFID is a non-contact automatic identification technology that utilizes radio frequency communication and can work in various harsh environments. Generally speaking, RFID includes three parts: radio frequency tags, readers and writers, and data management systems. Figure 2 is the structural diagram of RFID [18].
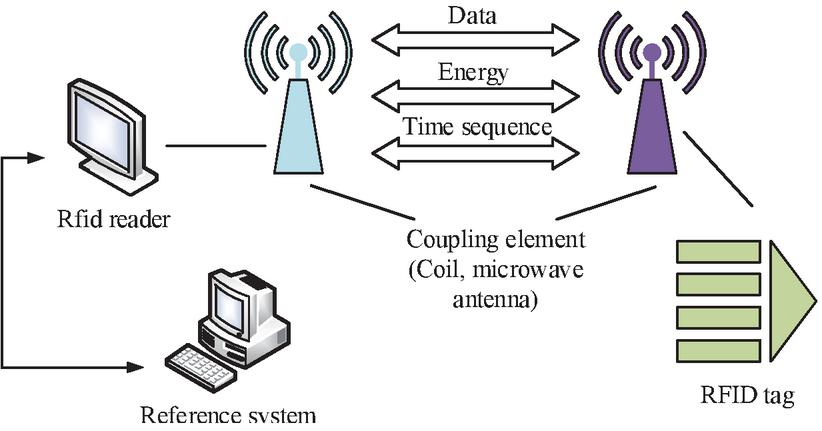
Figure 2 RFID system structure diagram.
Figure 2 shows the RFID based on RF tags and readers. The tag consists of an antenna and a chip that stores unique identification codes and data, attached to the object. The reader/writer interacts non-contact to achieve the reading, writing, and transmission of label information. The data management system in RFID is responsible for data storage and management and controls the reading and writing of tags. The types of tags include passive, active, and semi-active, while readers and writers are divided into active and passive. The RFID-based temperature monitoring system is aimed at real-time monitoring of key parameters such as temperature and humidity in the power grid CIS, automatically adjusting and transmitting data to the central processing unit or cloud [19]. Power grid operation and maintenance personnel can conduct daily supervision and fault analysis through these centralized data. Figure 3 shows the layout of the system.
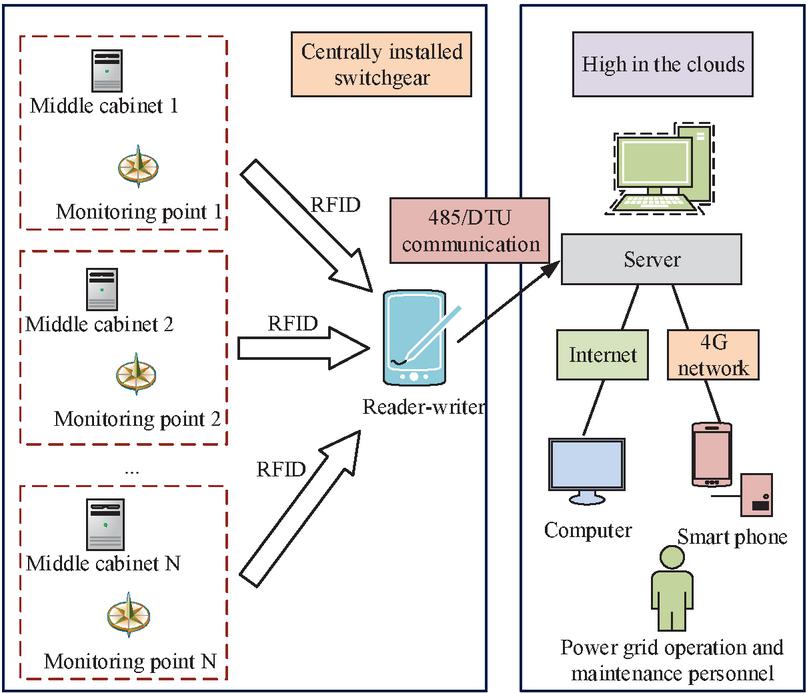
Figure 3 Real-time temperature monitoring system of switch cabinet based on RFID.
In Figure 3, the system mainly includes CIS and cloud, with RFID tags, readers, and communication devices configured internally in CIS, forming a monitoring node. These nodes will transmit monitoring data to readers and writers through RFID. The latter takes Modbus485 protocol or DTU module to communicate with cloud servers, ensuring real-time updates of monitoring data for operation and maintenance personnel to query and analyze [20]. During installation, the layout is optimized based on on-site conditions and requirements. When selecting RFID tags, the characteristics of actual temperature measurement points are considered. A tuning fork shaped tag is used at the connection point of the busbar, and a clamp type tag is selected at the busbar. Figure 4 shows the specific system installation method.
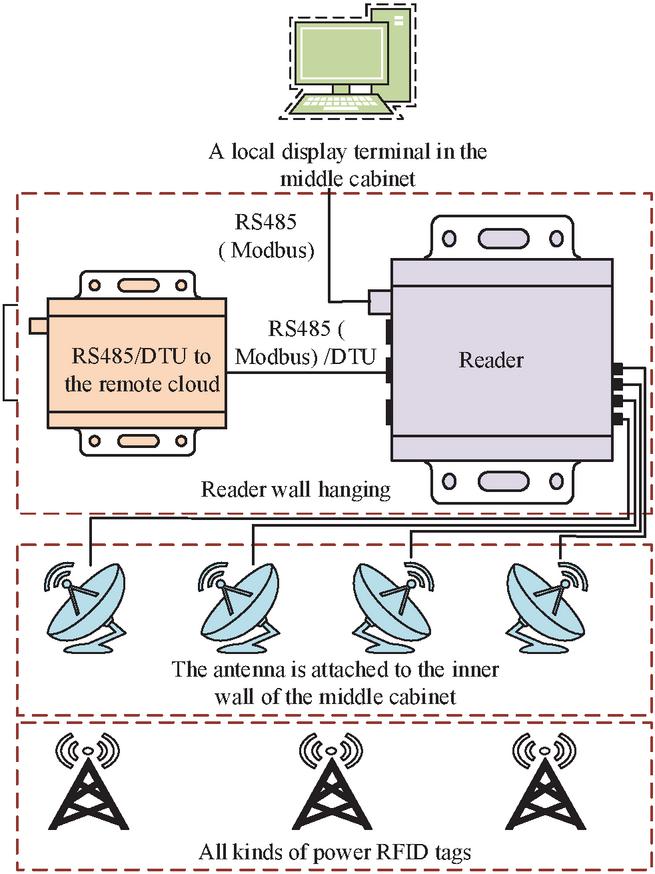
Figure 4 System installation structure.
In Figure 4, to effectively monitor the temperature of the switchgear, an RFID reading and writing device operating at 902–928 MHz is selected, following the ISO18000-6C standard, with a power supply voltage of DC 12 to 36 V, and operates stably in an environment of 20 to 75C. This device is equipped with a 5 dB circularly polarized antenna and professional RFID tags, achieving a detection distance of up to 10 m. The reader/writer has RS485 and RJ45 interfaces, supports ModBUS RTU protocol, and provides up to 16 SMA female interfaces. Its power consumption is less than 10 watts and its service life exceeds 10 years. The antenna size is 127 mm 127 mm 14 mm, with a temperature resistance range of 40 to 75C, a center frequency of 915 MHz 3 MHz, excellent standing wave ratio, bandwidth exceeding 20 MHz, protection level of IP55, and convenient for magnetic suction installation. RFID is installed at the busbar connection of the switchgear and uses tuning fork tags to monitor temperature changes at the busbar connection point. The main body of the busbar adopts a clamp type label for monitoring the temperature rise of the busbar body. Circuit breaker contacts are labeled with plum blossom contacts to monitor the temperature of the circuit breaker contact. The ring main unit plug adopts a plug type label for monitoring the temperature of the ring main unit plug.
2.2 Design of a Real-time Monitoring System for Centrally Installed Switchgear Based on RFID and Time-domain Finite Difference Algorithm
Wireless temperature measurement technology has shown many advantages in online monitoring of switchgear, but there are also some challenges in practical application. Especially, the power supply of temperature sensors and microprocessors has become a core challenge. The wireless temperature sensor needs to be placed in a critical position on the switchgear. Therefore, a low-energy wireless temperature module is designed to extend its working cycle and ensure the continuous and stable operation of the switching equipment. Its acquisition mode is set to single-conversion to minimize the energy consumption of the temperature sensor. Based on the operation timing data of the TMP112 temperature sensor, a corresponding program is developed, as shown in Figure 5.
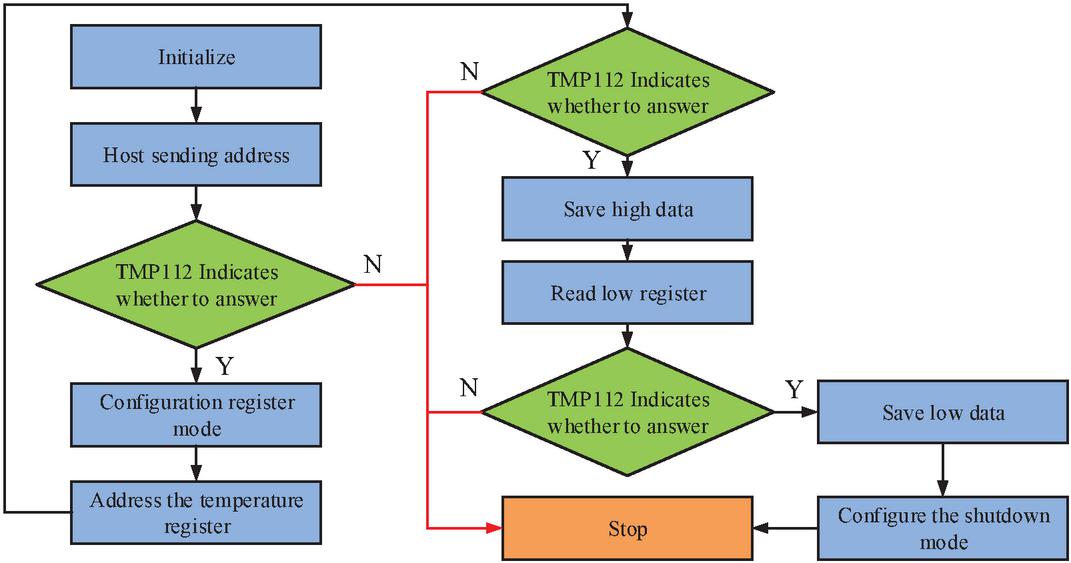
Figure 5 TMP112 temperature reading.
The process described in Figure 5 involves the interaction between the host and the TMP112 temperature sensor. Firstly, the host sends a startup signal and slave address, and TMP112 responds with confirmation. The host configures the TMP112 register and the sensor confirms. Next, the host sends the temperature register address and TMP112 confirms again. The host reads the temperature data (high and low) of TMP112 and completes the data transmission of temperature measurement. When the CC1101 wireless module is in the sending state, current consumption is the focus of attention. To address power consumption issues, adjusting the transmission power of CC1101 can effectively reduce overall energy consumption. When communicating, if the input signal is weak to 15 dbm or the distance between the sending and receiving ends is too close, it may cause difficulty in receiving. Considering the close proximity of CIS temperature monitoring points, measures are taken to improve communication quality. FDTD utilizes the difference approximation of Maxwell’s equations for electromagnetic field simulation and analysis. The electromagnetic field is divided into grids, and the vectors of the electric and magnetic fields are discretized at the grid points. The differential algorithm is applied to solve the Maxwell equation, thereby predicting the electromagnetic waves generated by communication interference signals and obtaining numerical solutions, represented by Equation (1).
| (1) |
In Equation (1), represents the strength of the magnetic field. refers to the strength of the electric field. is the dielectric value. represents the magnitude of magnetic permeability. is the equivalent conductivity value. The time-domain finite difference equation is applied to electromagnetic field calculations. By continuously iterating through the central difference algorithm, electromagnetic fields at different time points can be derived. The specific application process of the central difference algorithm is as follows. By calculating the first derivative of the signal using the central difference algorithm, the abrupt features in the signal can be captured. The derivative calculation takes 0.1 ns as the time step. When the absolute value of the derivative exceeds the threshold of 0.15 V/ns, the system will automatically mark it as a potential fault feature. This step effectively distinguishes between normal operating surges (usually less than 0.05 V/ns) and actual fault pulse signals (usually greater than 0.2 V/ns). This technology can accurately capture communication signals, effectively handle interference, and optimize the performance of wide area monitoring systems. The collection of communication signals is represented by Equation (2).
| (2) |
In Equation (2), represents the spectral width of the communication signal. is a two-dimensional spatial coordinate parameter for communication signal acquisition. refers to the communication signal transmission factor. represents the size of the collection frequency. refers to the transmission delay factor. The communication signal acquisition time is represented by Equation (3).
| (3) |
The derivative of the communication signal is calculated using Equation (4).
| (4) |
In Equation (4), represents the communication signal transmission distance. describes the signal conversion factor, represented by Equation (5).
| (5) |
In Equation (5), represents the equilibrium coefficient. is the coordinate of the communication signal acquisition point. The spatial position of the acquisition points obtained is represented by Equation (6).
| (6) |
If the time interval for collecting communication signals is short enough, Equation (7) can be used to obtain the short-term FT of the signal.
| (7) |
In Equation (7), represents the collected raw communication signal. is a window function. Choosing the appropriate window size is crucial when performing short-term FT, as it accurately reflects the temporal structural changes of the communication signal. The duration or width of the signal in the time-domain can be calculated using Equation (8).
| (8) |
In the frequency-domain space of the communication signal, the bandwidth of the signal is calculated according to Equation (9).
| (9) |
In Equation (9), and represent the initial time-domain conversion factor and frequency-domain conversion factor of the communication signal, respectively. The optimal window selection criteria are obtained using Equation (10).
| (10) |
When achieving the optimal conversion of communication signals between time-domain and frequency-domain, it is necessary to find a narrow window that minimizes the conversion factor. In practical applications, it is difficult to determine the optimal window. A generalized optimal window can be defined using fractional order methods, and the relevant calculations follow Equation (11).
| (11) |
The comparison between generalized and narrow optimal windows can effectively support communication signal processing. If signal meets under , then fractional domain FT can be applied. Equation (12) can perform Fourier analysis on the collected signal.
| (12) |
Based on the above equation, it is possible to perform FT on the collected communication signals and provide accurate data for the wide area monitoring results of communication interference signals below. The specific application of FT in frequency-domain analysis is as follows. The signal is segmented at a sampling frequency of 256 Hz, and each segment of data is windowed and subjected to fast FT to generate a time-frequency spectrum. In wide area communication interference monitoring, if the interference sample set , is obtained, multiple wavelet SVM are defined at scales to monitor interference. Based on these machine learning algorithms, corresponding interference monitoring mathematical models and can be established at different scales of . These models can effectively identify the interference sample features in different scales and , , forming a monitoring function . represents the mapping extracted by kernel functions in scale . The wide area monitoring function model of SVM for the final harmonic kernel function obtained is represented by Equation (13).
| (13) |
In Equation (13), represents the insensitive cost function. is a penalty parameter. Based on this monitoring function model, the optimization problem for identifying interference signals can be achieved, which needs to satisfy Equation (14).
| (14) |
In Equation (14), represents the relaxation parameter. refers to the insensitive function factor in scale . A Lagrange function is constructed based on the objective function conditions for identifying interference signal types, and is taken to calculate this function. A monitoring model for interference signals in scales can be obtained, represented by Equation (15).
| (15) |
Based on the above process, the appropriate number of decomposition scales is first determined to adapt to interference signals. Relevant parameters are calculated, and an SVM-based monitoring model is established to accurately identify the category of communication interference signals, thereby achieving interference monitoring. The DHT11 sensor uses a single-bus for data communication and control. Communication and synchronization between MCU and DHT11 are achieved through the DATA pin. A single-bus is connected with a 4.7K pull-up resistor to ensure high level when idle. In the master-slave communication structure, the slave only responds when requested by the host. The host must strictly follow the single-bus communication sequence. Otherwise, the sensor will not respond. This system integrates RFID and FDTD for temperature and humidity monitoring during CIS operation, as shown in Figure 6.
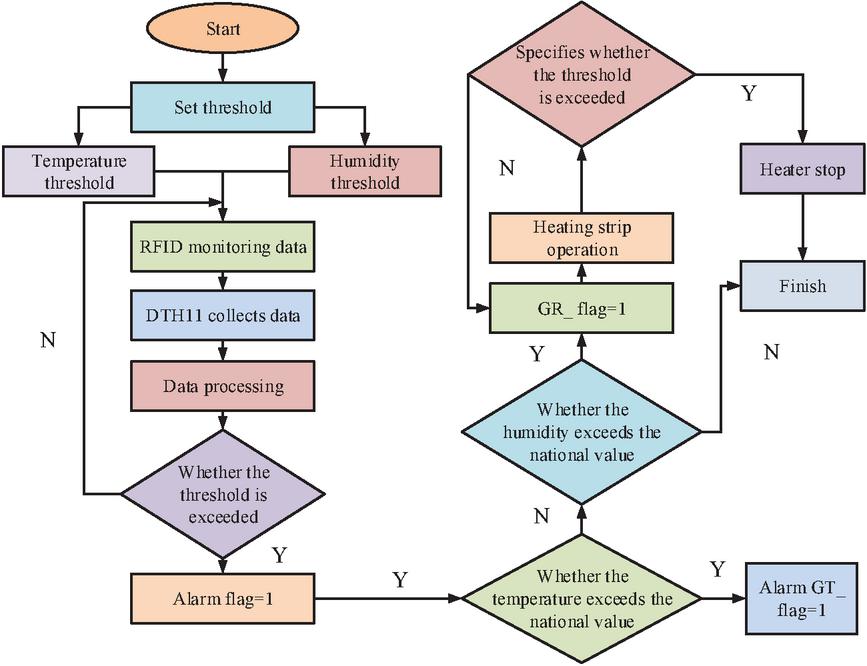
Figure 6 Temperature and humidity monitoring process of a mid-cabinet.
In Figure 6, the temperature and humidity of CIS are set to a specific alarm threshold. Once the alarm condition is triggered, the warning flag is set to 1. Next, the system will verify whether the temperature exceeds the limit. If it exceeds the limit, the GT_flag is 1. If there is no crossing, it is 0. If the temperature is normal, the humidity is verified again. If the threshold is exceeded, the GR_flag is 1, triggering the MCU heating operation. On the contrary, during high temperatures, GT_flag activates 1, and the system terminates heating and sends an alarm signal to the main control for uploading.
According to the above content, the specific application logic of FDTD in the system is as follows. Firstly, by installing RFID temperature sensors in key areas of the central cabinet, real-time temperature and humidity data is collected and transmitted wirelessly to the RFID reader. Secondly, the FDTD algorithm is used to numerically simulate the electromagnetic environment around the central cabinet and analyze the impact of possible interference sources (such as partial discharge, electromagnetic radiation, etc.) on communication signals. Then, the received raw signal is subjected to differential and FT processing under FDTD modeling to extract effective signal components and suppress interference noise. Based on the processed signal features, a SVM classification model is constructed to recognize and classify different types of interference signals. Finally, the data processed and recognized by FDTD is uploaded to the cloud platform through Modbus or DTU modules for visual monitoring and fault diagnosis by operation and maintenance personnel. The DTD module is deployed between RFID readers and cloud platforms, serving as the core unit for signal preprocessing and interference analysis.
3 Experimental Simulation Results and Analysis of the Operation Status Monitoring of Centrally Installed Switchgear
A series of comparative experiments are conducted to verify the practicality and accuracy of the proposed FDTD-based communication interference signal wide area monitoring method in monitoring CIS temperature and humidity. These experiments evaluate the reaction and monitoring capabilities of the technology under different conditions and environments, and compare its performance differences with current technologies. The experimental design includes multiple variable settings to measure the response speed and sensitivity of the method under temperature fluctuations, humidity changes, and other electromagnetic interference conditions. The experimental samples are collected from the monitoring records of 48 KYN28A-12 switchgear units operated by a power supply company from 2022 to 2024, covering various operating conditions such as normal operation, minor fault, and severe fault. A total of 16,000 sets of data are collected and divided into training and testing sets in a 4:1 ratio. The ratio of normal operating conditions to fault operating conditions in both datasets is 2:1. Table 1 shows the experimental environment settings.
Table 1 Experimental environmental parameters
| Experimental | Experimental | ||
| Environment | Argument | Environment | Argument |
| Operating system | Windows 7(64-bit) | Sampling point | 256 |
| CPU frequency | 1.90 GHz | Sampling frequency | 256 Hz |
| Internal memory | 16.0 GB | bandwidth | 8 MHz |
| Mechanical hard disk volume | 1 TB | Frequency band | 140145 MHz |
| Communication signal power | 9 dBm | Narrow-band interference signal power | 14 dBm |
| Laboratory temperature and humidity benchmark | 25 1C/45 5%RH | Interference signal type | Power frequency harmonics (50 Hz 5%) |
| Interference additional noise | Pulse noise (0.1ms pulse width) | / | / |
The randomness of interference signals requires the transformed signal strength to be as stable as possible to reflect the monitoring accuracy. Figure 7 shows the results of the comparative experiment.
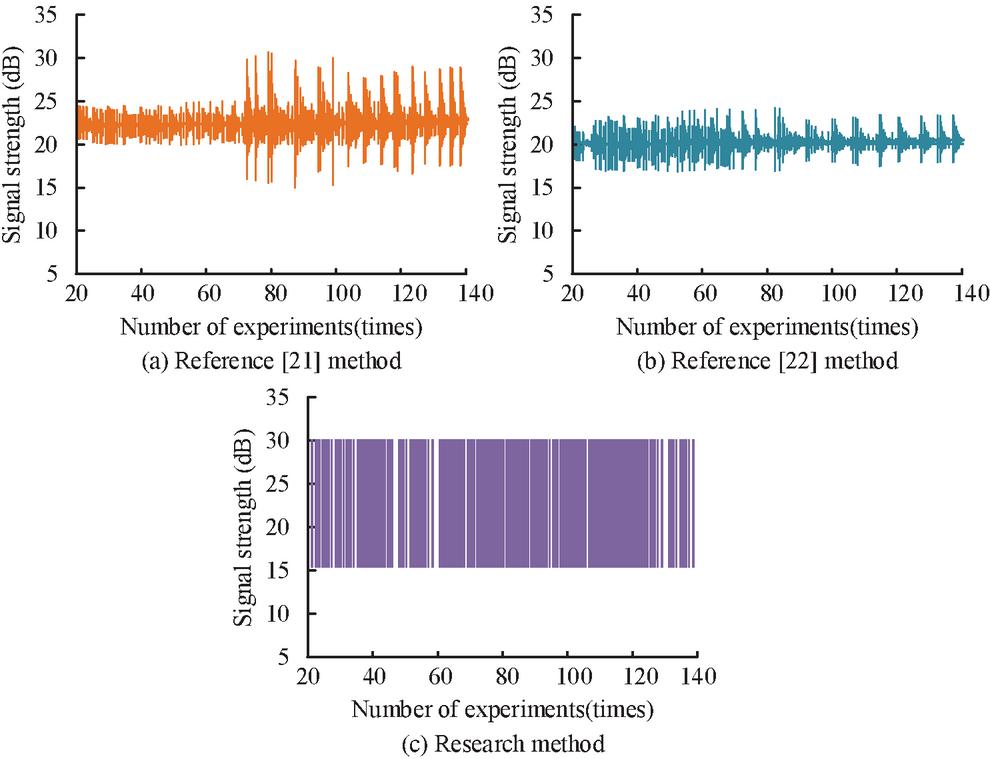
Figure 7 Comparison of monitoring stability of different methods.
In Figures 7(a) and 7(b), the interference signals obtained using the methods in references [21] and [22] exhibited significant fluctuations in intensity, indicating that these methods performed poorly in signal processing stability. In Figure 7(c), the proposed method had minimal fluctuations in signal strength, demonstrating superior stability, confirming its efficiency in interference signal processing, and providing reliable monitoring results. The monitored interference signal was converted into an orthogonal baseband signal through frequency conversion, and low-pass filtering was performed to obtain the signal denoising results of different methods. The clear signal curve indicates that this method has better denoising effect. Figure 8 shows the experimental results.
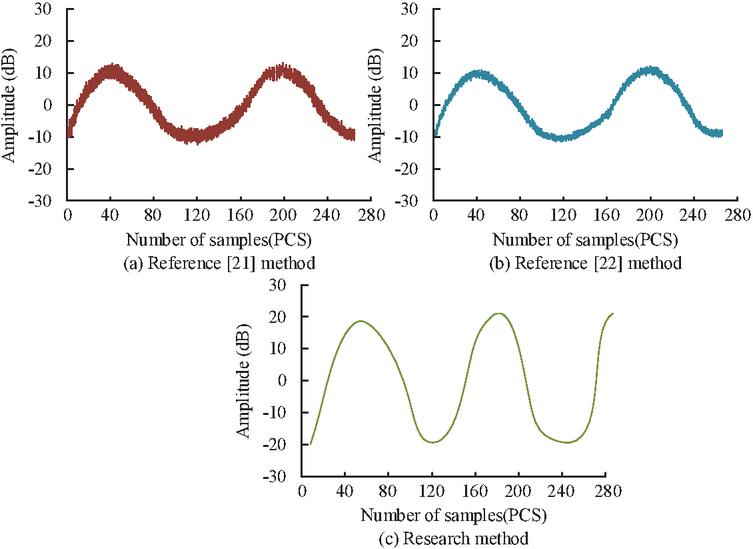
Figure 8 Comparison of denoising effect of different methods.
In Figure 8, under different experimental signal points, the denoising effect of the method in reference [21] was the worst, while the denoising effect of the method in reference [22] was improved, but it was still not ideal. In contrast, the research method had the best denoising effect. Therefore, the above data can prove that the research method performs the best in denoising performance. It can effectively monitor interference signals and avoid their impact on the entire communication signal. To further validate the effectiveness of the research method, comparative experiments are conducted on the signal monitoring range of different methods, as shown in Figure 9.
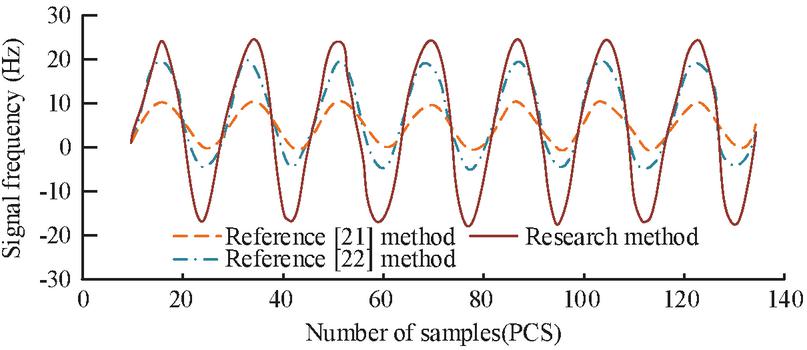
Figure 9 Comparison of monitoring ranges of different methods.
In Figure 9, the monitoring range of the method in reference [21] was Hz, while the method in reference [22] covered Hz. In contrast, the monitoring range of the research method was significantly wider, with a monitoring coverage range of Hz. This demonstrates the advantages of the research method in wide area monitoring of communication interference signals. It can capture and analyze interference signals more comprehensively, thereby providing more effective monitoring results. Figure 10 shows the 256-point sampling results of the FT algorithm.
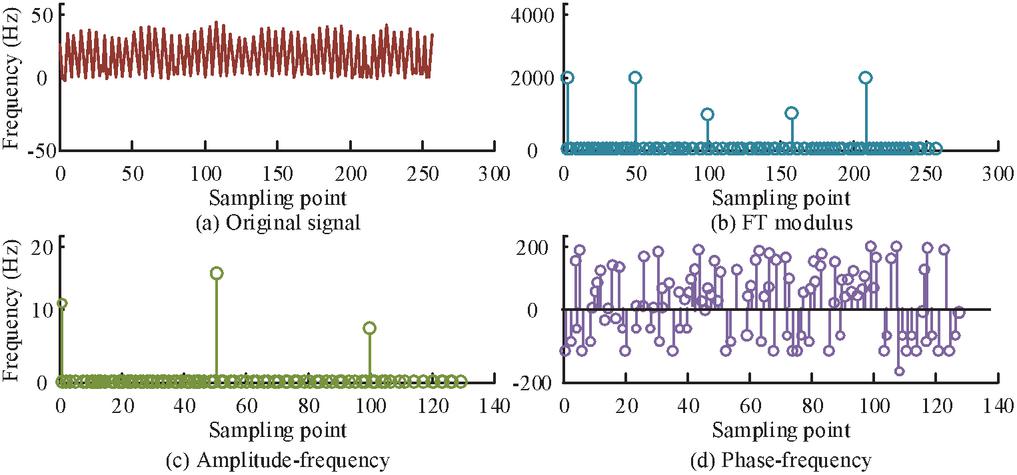
Figure 10 FT algorithm 256 sampling results.
In Figures 10(a), (b), and (c), larger values appeared at points 1, 51, and 101 after FT algorithm. According to Figure 10(d), the FT showed significant numerical changes at points 1, 51, and 101, while the signal amplitudes at other frequency points were close to zero. Specifically, the modulus of point 1 was 2,560, corresponding to a DC component amplitude of 10. The modulus of point 51 was 1,920, corresponding to a 50 Hz signal amplitude of 15. The modulus of point 101 was 960, corresponding to a 100 Hz signal amplitude of 7.5. These results validate the spectral analysis accuracy. In addition, by increasing the sampling points, frequency resolution can be improved, but it also prolongs calculation time. In practical applications, to quickly complete analysis, periodic signals are usually sampled in a short period of time and zeros are filled after the data to achieve the required number of points, thereby improving resolution through FT algorithm. Figure 11 shows the temperature of CIS cable house and cable joint under different operating conditions, as well as the accuracy of CIS fault alarms under different thresholds.
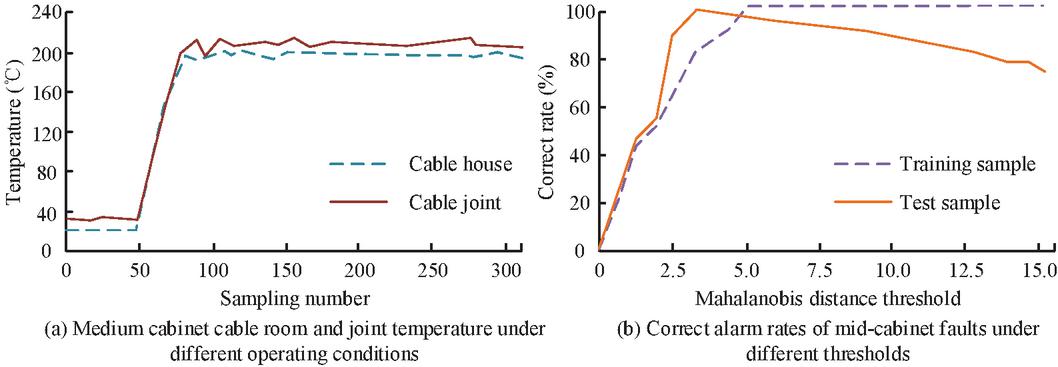
Figure 11 Temperature monitoring and fault alarm accuracy of CIS.
In Figure 11(a), there were many types of CIS faults, resulting in a wide range of Mahalanobis distances for the fault samples. From Figure 11(b), the accuracy of switchgear fault alarms showed a specific trend with the change of the Mahalanobis distance threshold. Specifically, as the threshold gradually increased from 0, the accuracy of fault alarms also gradually improved. When the threshold was greater than 5, the accuracy of the training samples remained at 100%. In the test sample, when the threshold was 3.1, the accuracy reached the highest level of 98.3%, corresponding to a 95% confidence interval of 97.6%–99.0%. However, as the threshold increased, the accuracy actually decreased. The performance degradation after the threshold was greater than 3.1 may be due to the enhanced ability of the system to suppress high-frequency interference components (28 Hz). Meanwhile, it leads to a decrease in the signal-to-noise ratio of the arc fault characteristic signal (mainly distributed in the 26–32 Hz frequency band). The electromagnetic thermal coupling effect inside the switchgear will change the propagation characteristics of fault signals. When the threshold increases, the signal distortion caused by the temperature field can lead to some effective fault features being misjudged as interference. Therefore, the Mahalanobis distance threshold for CIS fault alarms is not necessarily better. Selecting a threshold between 3.1 and 5 can yield more accurate alarm results.
4 Conclusion
To improve the efficiency of CIS operation situation monitoring, an RFID switchgear temperature monitoring system is designed, which tracks temperature and humidity data in real-time and transmits it to the data center or cloud server. In response to the instability of communication interference processing in traditional wide area monitoring methods, a monitoring strategy is proposed to be improved using the time-domain finite difference method. The derivative, FT capture, and conversion signals are combined with SVM to create a mathematical model to distinguish the interference signals, and the Lagrange function method is used to accurately obtain the interference signals. These experiments confirm that the proposed method generates minimal signal strength fluctuations and exhibits superior stability, which confirms its efficiency in interference signal processing and can provide reliable monitoring results. The monitoring range of the research method is significantly wider, with a monitoring coverage range of Hz. This demonstrates its advantages in wide area monitoring of communication interference signals, as it can capture and analyze interference signals more comprehensively, thereby providing more effective monitoring results. As the threshold gradually increases from 0, the accuracy of fault alarms also gradually improves. When the threshold is greater than 5, the accuracy of the training samples remains at 100%. In the test sample, when the threshold is 3.1, the accuracy reaches the highest 98.3%, and then decreases as the threshold increases. Therefore, the Mahalanobis distance threshold for CIS fault alarms is not necessarily better. Based on the above analysis, selecting a threshold between 3.1 and 5 can yield accurate alarm results. However, in practical applications, technical challenges such as signal coverage, interference issues, and system integration complexity of RFID still need to be considered.
Declarations
Ethical Approval
This declaration is “not applicable”.
Competing Interests
The authors declare no conflict of interests.
Authors’ Contributions
Jie Wang (First Author): Conceptualization, Methodology, Software, Investigation, Formal Analysis, Writing – Original Draft; Zhiyong Hu (corresponding author): Writing – Review & Editing. Jianbo Zhang: Resources, Supervision; Feng Zheng: Review & Editing. Haijun Wang: Formal Analysis. Jingang Yao: Software, Investigation,
Funding
No Funding.
Availability of Data and Materials
This declaration is “not applicable”.
References
[1] Misbakhov R S, Vasev A N, Sakhabutdinov A Z, Nureev I I, Lipatnikov K A. Address fiber optical sensor for acoustic detection of a partial discharge in a switchgear. Electrical and Data Processing Facilities and Systems, 2019, 15(3):101–110.
[2] Morris J, Long K, Kelley S, Cochran D. Successful Project Execution Replacing Four 15-kV Switchgear Lineups and Seven Medium-Voltage Motor Control Centers: A Case Study During a 35-Day Turnaround. IEEE Industry Applications Magazine, 2021, 27(1):35–47.
[3] Williams A. Human-Centric Functional Computing as an Approach to Human-Like Computation[C]//Artificial Intelligence and Applications. 2023, 1(2): 118–137.
[4] Kim Y W, Son Y K, Ko S, et al. Parallel Operation of Permanent Magnet Generators and Diode Rectifiers in Maritime DC Power System Considering Fuel Economy. IEEE Transactions on Transportation Electrification, 2022, 8(2):2721–2735.
[5] Fan Y, Xu B, Wu J, Ding Y, Cai L, Wang J. Portable Noise Time-Frequency Characteristic Monitoring System for Environmental Assessment of Power Transformer Rooms. IEEJ Transactions on Electrical and Electronic Engineering, 2022, 17(3):361–368.
[6] Fu T, Wang D, Fan X, Huang Q. Component Importance and Interdependence Analysis for Transmission, Distribution and Communication Systems. Journal of Power and Energy Systems of the Chinese Society of Electrical Engineering, 2022, 8(2):488–498.
[7] Flanagan J, Mcgovern C. A qualitative study of improving the operations strategy of logistics using radio frequency identification. Journal of Global Operations and Strategic Sourcing, 2023, 16(1):47–68.
[8] Elgweri H K, Hamed A, Mansor M. Numerical Solutions of Finite Well in Two Dimensions Using the Finite Difference Time Domain Method. Physical Sciences and Applications: English, 2022, 12(1):12–18.
[9] B L Y A, B B N, A Y W. Intelligent power monitoring of building equipment based on Internet of Things technology. Computer Communications, 2020, 157:76–84.
[10] Kai Y A, Yao Z A, Yan Y B. Fault diagnosis method of sensors in building structural health monitoring system based on communication load optimization. Computer Communications, 2020, 159:310–316.
[11] Sharma A, Mathew L, Chatterji S, Goyal D. Artificial Intelligence-Based Fault Diagnosis for Condition Monitoring of Electric Motors. International Journal of Pattern Recognition and Artificial Intelligence, 2019, 34(13):16–30.
[12] Alcaiz A, Nikam M M, Snow Y, Isabella O, Ziar H. Photovoltaic system monitoring and fault detection using peer systems. Progress in photovoltaics, 2022, 30(9): 1072–1086.
[13] Elewe A M, Zaboon W A. Real Time Rfid-Based Equipment for Monitoring Environmental Railway Systems. International Journal of Industrial Engineering Research and Development, 2020, 11(1):8–15.
[14] Miao Y, Huo J, Liu Z, Gao Y, Wang C. Fast Rail Defect Inspection Based on Half-Cycle Power Demodulation Method and FPGA Implementation. Journal of Beijing Institute of Technology, 2022, 31(2):185–195.
[15] Du S, Yu B, Han F, Mao Y, Zhang H, Li J. Finite-difference time-domain to screen Au NPs as SERS active substrate for the sensitive determination of prohibited drugs in fish via solvent cleaning. Analytical Methods, 2022, 14(9):921–925.
[16] Yang C, Zhu F, Lu N, Yang Y. Analysis on Uncertainty of Field-to-Wire Coupling Model in Time Domain. IEEE Transactions on Power Delivery, 2022, 37(5):3771–3781.
[17] Liu G, Wei X, Zhang S. Analysis of Epileptic Seizure Detection Method Based on Improved Genetic Algorithm Optimization Back Propagation Neural Network. Journal of Biomedical Engineering, 2019, 36(1):24–32.
[18] Li Z, Li G, Wen G, Xu R, Li J, Huang Y. Intermittent Magnetic Field Monitoring System Based on Passive RFID Sensor Tags. IEEE Sensors Journal, 2022, 22(1):819–831.
[19] Liu X, Du J, Ye Z S. A Condition Monitoring and Fault Isolation System for Wind Turbine based on SCADA Data. IEEE Transactions on Industrial Informatics, 2021, 18(2):986–995.
[20] Pang J, Yu Z, Chen X. Research on thermal imaging fault detection system based on Weibull distributed electrical system. Journal of Physics: Conference Series, 2021, 1941(1):12037–12044.
[21] Yang Y, Wu H, Ma J. Electrical System Design and Fault Analysis of Machine Tool Based on Automatic Control. International Journal of Automation Technology, 2021, 15(4):547–552.
[22] Shi X. Research on fault diagnosis of B737 aircraft fuel system based on improved BP neural network. Mathematical Models in Engineering, 2019, 5(1):11–16.
Biographies

Jie Wang, Senior Engineer, graduated from Zhengzhou Electric Power Industry School in 1999; obtained a bachelor’s degree in Electrical Engineering and Automation from Zhengzhou University in January 2009. Currently employed at the Power Economy and Technology Research Institute of State Grid Nanyang Power Supply Company, where his research has been consistently focused on distribution network planning, design, operation, and maintenance. A recipient of the Nanyang City May Day Labor Medal, he has applied for multiple invention patents and authored several papers.

Zhiyong Hu graduated with a Bachelor’s degree in Electrical Engineering and Automation from the School of Electrical Engineering at Zhengzhou University in July 2003. He obtained a Master’s degree in Electrical Engineering from the same school in January 2013. Currently, he is employed at State Grid Nanyang Power Supply Company and also serves as a graduate mentor at Zhongyuan University of Technology. His main research directions are power grid planning and design, as well as power grid operation and maintenance.

Jianbo Zhang, Associate Senior Engineer and Technician. Graduated from Nanyang Institute of Technology with a major in Electrical Engineering and Automation. Currently employed at State Grid Nanyang Power Supply Company. In 2020, published the paper “Low Voltage Villagers Intend to Petition, Genuine Service Calms the Grid and Reassures the People” in *Construction Engineering and Electric Power*, “Development Technology of a Simple Electric Pole Loading, Unloading, and Transportation Device” in *Natural Science*, and “Management Methods and Innovative Strategies for Electricity Bill Copying, Verification, and Collection in Power Supply Enterprises” in *Charming China*. In 2021, authorized utility model patents for “Temperature Measurement Device for Optical Fiber Composite Phase Line”, “Guide Device for Electricity Distribution”, “Cable Trench Cover Plate Installation Equipment”, “A Type of Cable Branch Box”, and “A Constant-Tension Type Line Connection Device”. In 2022, authorized utility model patents for “A Transformer Winding Deformation Monitoring Device” and “A Distribution Cabinet with Arc Extinguishing Function”. In 2024, participated in “Design of a New Intelligent Integrated Terminal Based on Edge IoT Agent” and “Research and Application of Live Detection Technology for Transformer Winding Deformation Using Acoustic Vibration”, receiving the Second Prize in Science and Technology. Research directions include substation equipment processing, ultra-core collection, transmission devices, and power supply lines.

Feng Zheng, Bachelor’s degree, Senior Engineer, graduated from the Electrical Engineering and Automation major at Zhengzhou University in 2014. His main research directions include the optimization of electrical equipment operation and the monitoring of electrical equipment status. He has been the planning specialist at the Economic and Technological Research Institute of State Grid Nanyang Power Supply Company for 5 years, possessing advanced concepts for the operation and development of electrical equipment. Previously, he served as the technical head of the maintenance department at State Grid Nanyang Power Supply Company, engaging in electrical equipment installation and electrical commissioning tests for 8 years, and has extensive knowledge of equipment structure. He also worked as the head of the primary department at Feilong Design Co., Ltd. for 9 years, where he gained extensive experience in the application of electrical equipment.

Haijun Wang, Han ethnicity. Bachelor’s degree. Started working at Nanyang Power Supply Company in September 1996. From 2004 to 2020, he successively held the positions of team leader of the field service team and metering specialist at the Nanyang Power Supply Company’s Metering Center. From 2020 to 2024, he served as the deputy director of the Nanyang Power Supply Company’s Metering Center, and since 2024, he has been a level one expert at the Metering Center. He won first place in the Nanyang City Measurement Professional Competition, the Nanyang City May Day Labor Medal, and the Nanyang City Technical Expert. He is a member of the Electrical Measurement Instrumentation Committee of the Henan Provincial Electrical Engineering Society and has received the title of Advanced Worker multiple times at the city and provincial levels. His main expertise is in measurement technology management.

Jingang Yao obtained his bachelor’s degree in Electrical Engineering and Automation from NCWU (North China University of Water Resources and Electric Power) in 2009. Currently, he is working in the relay protection field at the State Grid Henan Nanyang Power Supply Company. His research interests include power system planning and operation, electricity markets, power system stability analysis, and power system relay protection.
Distributed Generation & Alternative Energy Journal, Vol. 40_5&6, 1101–1128.
doi: 10.13052/dgaej2156-3306.40568
© 2025 River Publishers