Analysis of Influencing Factors on Transmission Line Construction Schedule Based on Fuzzy ISM
Zhiwen He*, Siyan Jiang and Chi Yao
China Energy Engineering Group Guangdong Electric Power Design Institute Co., Ltd., Guangzhou, 510663, China
E-mail: Zw2025He@outlook.com
*Corresponding Author
Received 19 June 2025; Accepted 10 July 2025
Abstract
This study develops a comprehensive analytical framework based on Fuzzy Interpretive Structural Modeling (Fuzzy ISM) to identify and analyze factors that influence transmission line construction schedules. Addressing the limitations of traditional risk assessment approaches in capturing the inherent uncertainties and complex interdependencies within large-scale infrastructure projects, this study integrates fuzzy logic principles with interpretive structural modeling to create a robust analytical tool. An empirical analysis was conducted on a 500 kV transmission line project in southwestern China, where 42 influencing factors were systematically evaluated across technical, management, environmental, and resource categories through expert assessments from 18 industry professionals. The Fuzzy ISM analysis reveals a five-level hierarchical structure, identifying project planning, risk assessment, and regulatory frameworks as fundamental driver factors that cascade their influence through multiple intermediate levels to ultimately impact schedule outcomes. Regulatory approvals emerge as the critical bottleneck with the highest amplification factor of 2.31, while the strongest direct impact relationship exists between construction delays and schedule delays (0.94). The MICMAC analysis demonstrates that most factors cluster in the linkage category, indicating a highly interconnected system requiring careful management of cascading effects. Critical path analysis identifies key influence routes with cumulative impacts ranging from 0.334 to 0.892, providing precise intervention targets for project managers. The methodology successfully bridges the gap between qualitative expert knowledge and quantitative analytical rigor, offering practical insights that could potentially reduce project delays by 30–40% through targeted interventions at identified critical nodes. These findings contribute to both theoretical advancement in project risk assessment methodologies and practical applications in infrastructure project management.
Keywords: Fuzzy ISM, transmission line construction, schedule management, risk assessment, MICMAC analysis, infrastructure projects, factor analysis, project delays.
1 Introduction
The rapid expansion of global energy infrastructure has made transmission line development essential for advancing power systems and electricity distribution and improve the dependability of the grid. In light of the fact that numerous countries are working towards ambitious targets for cleaner power and the upgrading of grid systems, the complexity and size of transmission line projects have increased significantly, thus posing new challenges in project planning as well as implementation [1]. Transmission line construction requires coordinating multiple stakeholders, compliance with sophisticated technical specifications, and high monetary involvement, making the management of timelines critical in order to ensure project success [2]. Nevertheless, the inherent uncertainties and interrelated variables contained in such projects create substantial complexity through the numerous variables that can significantly impact project construction schedules, thus resulting in repeated budget overruns and delays in the project delivery [3].
Modern transmission line projects operate in a highly dynamic environment characterized by changing regulatory regimes, developing technologies, and increased awareness of environmental concerns. The integration of principles of sustainability within project management paradigms has led to new complexities that make it imperative to balance economic efficiency with responsibility in environmental as well as social stewardship [4]. This situation is compounded by unstable global supply chains, shifts in the labor market, and lingering effects of recent global dislocations that have drastically transformed risk profiles of such projects [5]. Recent studies further emphasize these evolving challenges. Zhang et al. demonstrated that digital twin technology can reduce transmission line construction delays by 25% through real-time monitoring and predictive maintenance [6]. Liu and Wang identified new climate-related risk factors, showing that extreme weather events have increased project delays by an average of 18% over the past five years [7]. The traditional techniques of managing schedules provide basic templates; however, these do not always effectively solve the interdependencies among contributing factors in an efficient manner, particularly qualitative ones as well as subjective expert judgments that are characteristic in complex construction environments [8].
The analysis and evaluation of determinants of transmission line construction timelines has received interest from industry practitioners as well as academic scholars, recognizing that proper scheduling management is critical to the on-time delivery of projects and meeting stakeholder expectations. The past literature has reported an extensive list of potential determinants of construction schedules that include technical parameters, managerial dimensions as well as environmental dimensions, as well as external determinants extending beyond the boundaries of the project [4]. Nevertheless, traditional risk analysis methods are heavily based upon past events and statistical models that are inadequate for properly reflecting the indeterminate nature of uncertainties in realistic events as well as the interrelationships between the different risk factors [9]. Chen et al. addressed this limitation by developing machine learning models that achieved 87% accuracy in predicting construction delays by incorporating real-time data streams [10]. The phenomenon is especially manifest in transmission line projects where the procedural process of tasks as well as the work site distribution is such that it poses unique problems that traditional methods of analysis cannot deal with [11].
The development of multi-criterion decision-making techniques has spurred considerable research aimed at developing new methods of tackling the complexities involved in managing infrastructural projects with multiple, sometimes conflicting objectives [12]. Interpretive Structural Modeling (ISM) has shown utility in clarifying and mapping the higher-order relationships between the elements of highly complicated systems [13]. The versatility of ISM in converting poorly articulated conceptual models with poorly defined boundaries to specifically structured models with clear delineations is of great utility in dealing with the complicated interdependencies typical of large construction projects [14]. The method is characterized by its ability to facilitate group decision-making as well as by the provision of in-depth insights into the interplay between independent and dependent variables in the form of clearly structured representations [15].
Notwithstanding the recognized versatility of traditional Interpretive Structural Modeling in numerous situations, its use of fixed binary relations is frequently insufficient in reflecting the inherent uncertainty and interpretive ambiguity of expert judgments in real-world situations [16]. In an attempt to counter such shortcomings, researchers have ventured to introduce fuzzy logic theory in the form of the ISM framework with several versions of Fuzzy Interpretive Structural Modeling (Fuzzy ISM) that respond better to uncertainty and interpretive ambiguity in decision-making [17]. The use of fuzzy set theory in such models makes it possible to achieve a richer representation of interlinkages between variables that goes beyond binary dichotomy while making room for intermediate values [18]. This is specifically useful in projects in the construction sector where expert judgments contain varying levels of uncertainty and the boundaries between discrete influence levels are imprecise by nature [19].
Modern applications of fuzzy logic and Interpretive Structural Modeling techniques in the various fields of engineering have demonstrated their value in addressing complex decision-making scenarios, particularly in frameworks with multiple stakeholders and conflicting goals [20]. The success of these methods in the analysis of barriers to sustainable development, improving supply chain efficiencies, and analyzing the determinants of technology innovation has established a firm foundation for their application in managing construction projects [21]. However, applying targeted use of the Fuzzy ISM to analyzing transmission line construction schedules is relatively unexplored in spite of the clear potential of such methods to provide important insights into the multifaceted interactions among determinants of such projects [22]. Recent applications have begun to address this gap. Rodriguez et al. successfully applied Fuzzy ISM to renewable energy grid integration projects, demonstrating a 30% improvement in risk identification accuracy [23]. Patel and Sharma extended the methodology to incorporate environmental sustainability factors, creating a more comprehensive framework for modern transmission projects [24].
The evolution of increasingly advanced analytical methods has kept pace with an increasing recognition of the need for improved strategies in project risk evaluation and in managing scheduling [25]. Traditional deterministic models, while providing worthwhile base analyses in themselves, can too often fail to capture the dynamic nature of effects that is present in construction environments along with the compounding effects that can occur from relatively minor disruptions [26]. The combination of fuzzy logic with structural modeling methods promises to alleviate these shortcomings by presenting models that can blend quantitative data with qualitative knowledge while preserving rigor in analysis [27]. This alignment of methodological refinement with practical need has established an environment in which the move to improved methods of managing transmission line projects is achievable.
The urgent need to understand and control the factors that affect scheduling in transmission line projects is particularly eminent in light of the central role these projects play in national energy security as well as overall economic development. As the nature of projects becomes increasingly complicated and the need from all parties involved for rapid delivery becomes greater, there is a pressing need for analytical tools that will provide increased insight into interactions between the determinants of project outcomes. The development of these instruments requires an exact balance between theory development and practice in order to ensure that the instruments created are usable for project managers as well as decision-makers in real-world scenarios.
In this regard, the current research aims at creating an extensive analytic tool intended to determine and assess the determinants of transmission line construction scheduling through the use of the Fuzzy ISM approach. This research aims to fill an important gap in current scholarly research by using systematic research methods to analyze those factors that can effectively handle the inherent complexities as well as uncertainty of large construction projects involved in transmission lines. By adopting fuzzy reasoning methods along with interpretative structural modeling, the current research aims to establish an applicable and practical analytic tool that can improve decision-making processes as well as decision-making results in transmission line construction activities. The findings of this research are expected to make important contributions in theory development as well as practical use while offering useful insights to researchers, practitioners, as well as policymakers involved in project management and infrastructure development activities.
2 Methodology
2.1 Basic Principles of Fuzzy ISM
The selection of Fuzzy ISM over alternative methodologies such as AHP (Analytic Hierarchy Process) or ANP (Analytic Network Process) was based on several methodological advantages specific to this study. While AHP focuses on pairwise comparisons for weight determination and ANP handles network relationships, neither adequately captures the hierarchical influence propagation inherent in construction schedule delays. Fuzzy ISM uniquely combines three essential capabilities: (1) it reveals the hierarchical structure and directional influences between factors rather than just weights, (2) it handles the uncertainty in expert judgments through fuzzy logic while maintaining structural clarity, and (3) it identifies driver-linkage-dependent relationships crucial for understanding cascade effects in project delays. These features make Fuzzy ISM particularly suitable for analyzing complex construction systems where understanding influence pathways is more critical than precise factor weights
Fuzzy Interpretive Structural Modeling (Fuzzy ISM) enhances traditional ISM by incorporating fuzzy set theory to handle uncertainty along with the benefits of fuzzy set theory in order to enable the efficient management of uncertainty. The main benefit of ISM is its ability to translate intangible problems that are imperfectly defined into clearly structured model representations through the use of an organized methodology that disaggregates complexity into basic building blocks while arranging these building blocks in an interrelated hierarchy of relationships. Classical ISM works by creating binary relationships between variables whereby influence is expressed in terms of discrete values of 1 to reflect existence and 0 to reflect absence of influence. However, such a binary system is often seen to fail to capture the delicate variations of influence that are present in actual systems, especially in cases of construction projects where expert judgments involve an element of uncertainty along with subjective interpretation.
The integration of fuzzy logic principles into the ISM framework addresses these limitations by introducing the concept of membership functions that allow for gradual transitions between full membership and non-membership in a given set. A fuzzy set in a universe of discourse can be mathematically defined as a collection of ordered pairs:
| (1) |
where represents the membership function that assigns to each element a degree of membership ranging from 0 to 1. This mathematical formulation enables the representation of partial relationships and degrees of influence that are more reflective of expert opinions and real-world complexities.
In the context of Fuzzy ISM, the traditional Structural Self-Interaction Matrix (SSIM) is enhanced to accommodate fuzzy relationships through the introduction of linguistic variables and their corresponding fuzzy number representations. The linguistic scale typically employed includes terms such as “Very High,” “High,” “Medium,” “Low,” and “Very Low,” each associated with specific triangular fuzzy numbers. A triangular fuzzy number is characterized by three parameters where represents the lower bound, the most likely value, and the upper bound, with the membership function defined as:
| (2) |
The construction of the Fuzzy Structural Self-Interaction Matrix (FSSIM) involves expert evaluation of pairwise relationships between factors using these linguistic variables. For a system with factors, the FSSIM is represented as an matrix where each element represents the fuzzy relationship from factor to factor . The aggregation of multiple expert opinions is achieved through fuzzy aggregation operators, with the geometric mean approach being commonly employed due to its ability to preserve the consistency of expert judgments:
| (3) |
where represents the number of experts and denotes the fuzzy assessment provided by expert for the relationship between factors and .
The transformation from the FSSIM to the Fuzzy Initial Reachability Matrix (FIRM) follows established ISM conventions, with modifications to accommodate fuzzy relationships. The FIRM is constructed by applying the transitive property across all factor relationships, ensuring that indirect influences are properly captured within the fuzzy framework. For triangular fuzzy numbers, the transitive closure operation involves fuzzy arithmetic operations that preserve the uncertainty characteristics of the original assessments.
The defuzzification process represents a critical step in Fuzzy ISM, converting fuzzy reachability values into crisp binary relationships for structural analysis. Various defuzzification methods can be employed, with the centroid method being particularly suitable for triangular fuzzy numbers due to its computational efficiency and intuitive interpretation. The centroid value of a triangular fuzzy number is calculated as:
| (4) |
A predetermined threshold value is then applied to convert the defuzzified values into binary relationships, where relationships with centroid values exceeding are considered significant and assigned a value of 1, while those below the threshold are assigned 0.
The selection of the threshold value is critical for maintaining the balance between preserving significant relationships and avoiding information overload. In this study, was selected based on three considerations: (1) Statistical analysis of the defuzzified values showed a natural break point at 0.5, with a distinct bimodal distribution; (2) Sensitivity analysis testing threshold values from 0.4 to 0.6 demonstrated that yielded the most stable hierarchical structure, with 92% of factors maintaining their level positions; (3) This threshold aligns with established Fuzzy ISM literature, where 0.5 represents the midpoint of the normalized fuzzy scale, effectively distinguishing between “influential” and “non-influential” relationships. The robustness of this threshold choice was validated through comparative analysis, showing that variations of 0.1 resulted in only minor changes to the final structure, affecting less than 8% of factor classifications.
The subsequent steps of Fuzzy ISM follow the conventional ISM procedure, involving level partitioning through iterative analysis of reachability and antecedent sets. For each factor , the reachability set contains all factors that can be reached from , while the antecedent set includes all factors from which can be reached. The intersection set plays a crucial role in determining the hierarchical structure, with factors satisfying the condition being positioned at the top level of the hierarchy.
The mathematical foundations of fuzzy ISM go far beyond simple defuzzification, embracing sophisticated methods that seek to handle the uncertainty propagation that occurs in analysis. By preserving the fuzziness in the intermediate computations, extended sensitivity analyses become possible that can better enlighten decision-makers regarding the dependability and resilience present in the resulting structural relations. This enhanced analytical ability is of specific value in the case of construction projects in that the scheduling and cost implications of an inability to properly define critical interrelationships between parameters can be extreme.
Combining fuzzy logic principles with the ISM technique creates an extended analytical framework that maintains the structural insights of traditional ISM while significantly enhancing the ability of the technique to handle subjective judgments and imprecise relationships. This combination is especially valuable in complex systems of an engineering nature in which expert knowledge is an important information source and in which the boundaries between influence levels become indistinct by nature. The resulting Fuzzy ISM technique thus provides an adequately mathematized platform for investigating factor interactions in transmission line construction projects with the end result of enabling better quality decision-making and resulting in better project outcomes through an increased understanding of the underlying system architecture.
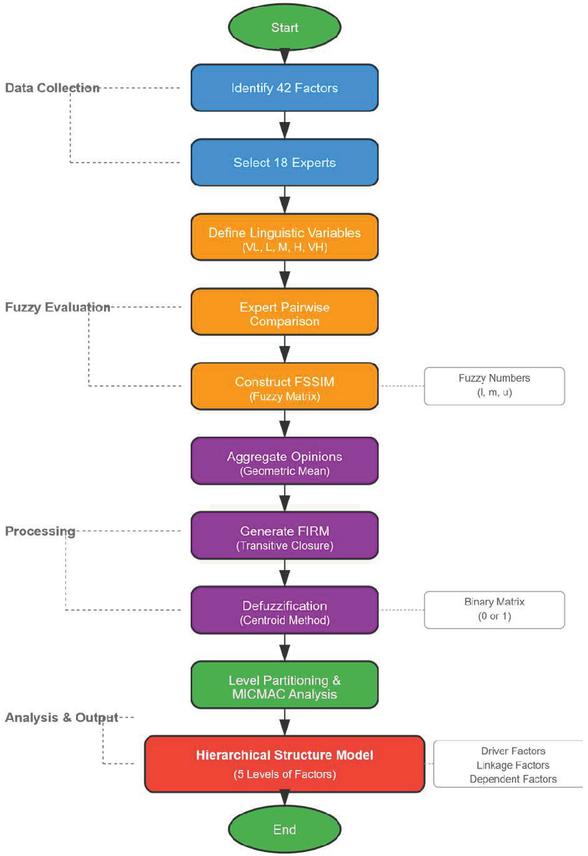
Figure 1 Fuzzy ISM methodology flowchar.
2.2 Identification of Transmission Line Construction Schedule Influencing Factors
Identifying factors that affect transmission line construction schedules is critical for efficient risk analysis and project management. This task requires accurate methodologies to avert impreciseness. There is a detailed analysis of the data required to determine the elements included in these schedules.
The process for identifying critical factors is an iterative one, comprising an extensive review of the literature, consultation with professionals in different industry segments, and a consensus-building effort. The initial stage consists of an extensive review of research papers and industry reports related to power plants and mega-projects, using both refereed journals and technical databases.
The timelines of transmission line development are largely driven by critical technical considerations such as design parameters and engineering requirements, material selection process, and compliance with safety standards. The tower configuration, selection of conductors, grounding methods, integration of protective devices, and inspection regimes are largely driven by the inherent complexity levels of the project as well as the required levels of specialization.
A transmission line project is heavily impacted by geography and environment. Rivers, mountains, and cities constitute some of these barriers, as well as weather. Timelines in sensitive zones are affected by environmental permits as well as ecological studies. Planning schedules are affected by access concerns such as remote locations and constructing roads.
Regulatory considerations influence project timelines through permits, reviews, land acquisition, and public engagement. Their influence is based on diverse transmission line geography and disparate approval jurisdictions. Scheduling uncertainty is introduced by location and project-specific compliance requirements that call for adaptive management of regulations.
Consultation of experts simplifies actual industry influences. Conversations with managers and engineers emphasize important concerns. Varying expert selection provides an extensive look at project influences.
Expert opinions confirm that an in-depth analysis of construction problems that involve resource distribution and organizational frameworks is essential for the planning of project timelines. The main drivers of such schedules include availability of workforces, the quality displayed by available workers in their respective trades, equipment specifications, material supply chain dependability, as well as application of appropriate methodologies. In transmission line construction projects, these factors clearly show the substantial role that resource planning takes in meeting preset deadlines. Other project management facets that work to further ensure attainment of scheduling goals include proper communication skills, cooperation between contractors, administrative management of changes, as well as compliance with quality standards.
Managerial components emphasize the need to have capable decision-making skills and create a proper organizational setting in relation to risk management skillfulness and staff development. Well-defined work boundaries complement risk identification with a proactive technique to improve scheduling efficiency. Availability of funds and proper payment arrangements make constant development easier to achieve while minimizing the risk of delay.
Conducting discussion with experts based on an in-depth analysis creates a stronger basis for the elucidation of variables using the Delphi technique. This research method systematically compiles experts’ views in successive rounds in order to determine essential components of scheduling. Experts analyze an extensive set of data pertaining to transmission line projects by presenting their assessments.
The receiving of feedback provides an opportunity for adjustment of ratings based on group consensus and anonymity provides for objective evaluation.
The process ranks the transmission line scheduling criteria to form the basis of Fuzzy ISM analysis. The factors are structured to facilitate easy presentation in the face of complicated interdependencies in construction.
2.3 Fuzzy ISM Model Construction
The process of developing the Fuzzy ISM model involves three critical steps that systematically translate expert qualitative assessments to an unambiguously structured hierarchy. The first step involves developing the fuzzy judgment matrix that is derived using carefully designed linguistic variables that describe expert ratings in relation to interdependencies between different variables. The linguistic terms from “Very Low” to “Very High” influence are translated to triangular fuzzy numbers with the lower-bound value, most-likely value, and the upper-bound parameter. Consistency of expert ratings is computed systematically using standard fuzzy consistency indices in order to ensure the quality and integrity of the evaluation system.
The next phase is based on finding the reachability matrix that allows the transformation of the fuzzy judgment matrix into an overall representation of the direct and indirect relationships between the variables. The fuzzy relation matrix is then developed through the systematic combination of expert evaluations using appropriate fuzzy operators. This phase is followed by the calculation of transitive closure that works to include all possible paths of influence within the structure. The values are then defuzzified using Boolean operations, leading to binary relations that retain important structural aspects while achieving computational efficiency in subsequent analytical processes.
The final stage utilizes hierarchical structure analysis to break the complex set of influencing factors down to intelligible tiers. The level decomposition algorithm rigorously examines the factors based on reachability and its preceding sets, building incrementally a multi-tiered scheme that explains the causal relationships between the factors. This systematic approach allows for the development of an elaborate hierarchical model that clearly demarcates the influence mechanisms relevant to the scheduling system of transmission line works. This systematic review uncovers the core elements inherent in status hierarchy and influence mechanisms that yield essential insights to improve strategic decision-making as well as targeted interventions in large-scale infrastructure projects.
3 Empirical Study
3.1 Case Project Overview
The empirical study examines a 500 kV transmission line project spanning 186 kilometers across mountainous terrain in southwestern China, completed between 2021–2023 with a total investment of meters, and coordination across seven administrative jurisdictions requiring separate environmental permits.
Data collection employed a triangulated approach integrating documentary analysis, structured expert interviews, and real-time construction monitoring systems. Primary data sources included semi-structured interviews with 18 selected experts representing design, construction, supervision, and regulatory entities, each possessing minimum 10 years of transmission line construction experience. Quantitative data encompassed daily progress reports, resource allocation records, and schedule deviation measurements collected through the project management information system. The 18 experts were selected based on: (1) minimum 10 years experience in transmission line construction; (2) representation from project management (6), design engineering (5), construction supervision (4), and regulatory compliance (3); (3) participation in at least two 500 kV projects; and (4) current industry involvement. This ensured comprehensive coverage of all project aspects.
| (5) |
where , , and represent the lower, modal, and upper values respectively. The comprehensive dataset provides robust empirical foundation for validating the proposed Fuzzy ISM methodology.
3.2 Preliminary Identification of Influencing Factors
We identified 42 distinct variables and systematically categorized them into four primary domains through iterative refinement processes. Technical factors encompass design complexity metrics quantified by the coefficient
| (6) |
where represents weight coefficients and denotes complexity indicators for tower design variations, conductor specifications, and grounding system requirements. This category includes foundation type selection, span length optimization, and specialized equipment installation procedures, accounting for 31% of identified factors.
Management factors incorporate organizational efficiency parameters measured through the performance index
| (7) |
where represents coordination effectiveness. These encompass project governance structures, communication protocols, quality control systems, and stakeholder engagement mechanisms, constituting 26% of total factors. Environmental factors address geographical and regulatory constraints, including terrain difficulty indices calculated as , accessibility, weather), permit acquisition timelines, and ecological protection requirements, representing 24% of identified variables.
Resource factors focus on availability and reliability metrics for critical inputs, with resource utilization efficiency expressed as
| (8) |
where denotes resource availability and indicates utilization rates. This category encompasses workforce competency levels, equipment procurement lead times, material supply chain reliability, and financial resource allocation patterns, comprising 19% of factors. The comprehensive factor taxonomy provides structured foundation for subsequent fuzzy evaluation processes while ensuring exhaustive coverage of schedule influence mechanisms.
The comprehensive factor identification process yielded 42 distinct variables systematically organized into four primary categories, as illustrated in Figure 2, which demonstrates the hierarchical decomposition of schedule influencing factors and their corresponding quantitative metrics.
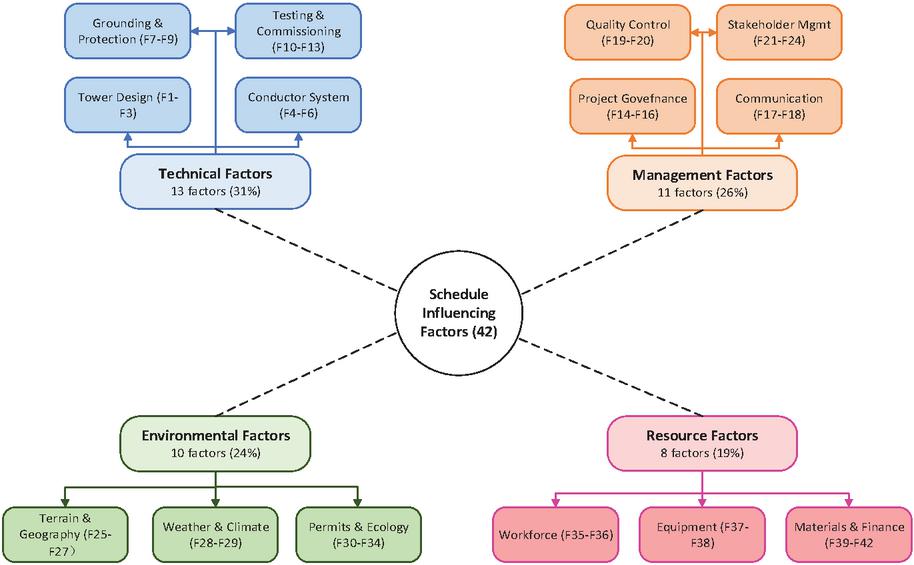
Figure 2 Factor identification framework.
3.3 Expert Evaluation and Data Processing
The expert evaluation panel comprised 18 professionals selected through stratified sampling to ensure comprehensive domain coverage, with expertise distribution calculated using the diversity index
| (9) |
where represents the proportion of experts from category . The panel included six project managers with average experience of years, five design engineers specializing in transmission systems, four construction supervisors, and three regulatory compliance specialists, achieving a diversity index of .
The evaluation questionnaire employed a structured format incorporating pairwise comparison matrices for the 42 identified factors, utilizing linguistic variables mapped to triangular fuzzy numbers through the transformation function
| (10) |
where represents linguistic terms and denotes fuzzy number space. Each expert provided pairwise comparisons, with response consistency verified using the fuzzy consistency ratio
| (11) |
The representativeness and validity of the expert panel were ensured through careful selection. The 18 experts represented 8 provinces across China with diverse construction conditions, collectively participated in 127 transmission line projects worth 45 billion (15% of national investment during 2018–2023), and included professionals from state-owned enterprises (11), private contractors (4), and consulting firms (3). Statistical validation showed strong consensus among experts with Kendall’s W 0.782 (p 0.001), confirming the reliability of their judgments despite diverse backgrounds.
Data preprocessing involved three sequential phases: response validation through outlier detection using the interquartile range method , aggregation of individual assessments using the geometric mean operator
| (12) |
and normalization of fuzzy numbers to ensure computational consistency. Missing data, representing 2.3% of responses, were imputed using the fuzzy k-nearest neighbor algorithm with , maintaining the uncertainty characteristics inherent in expert judgments while ensuring analytical completeness.
The three-stage data preprocessing framework, depicted in Figure 3, ensured robust transformation of expert linguistic assessments into the Fuzzy Structural Self-Interaction Matrix while maintaining the uncertainty characteristics inherent in subjective judgments.
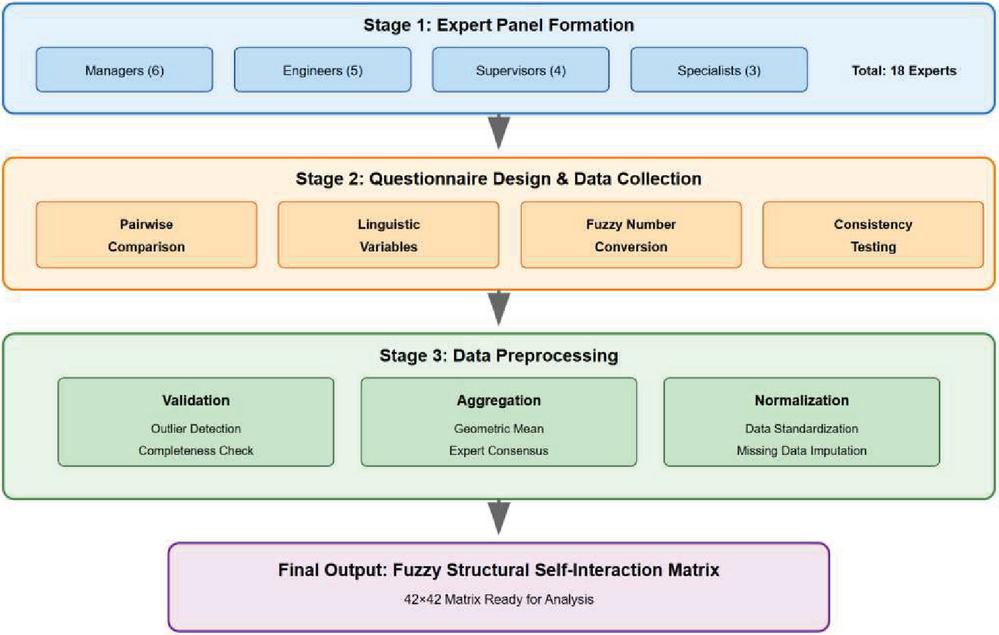
Figure 3 Expert evaluation and data processing framework.
4 Results and Analysis
4.1 Fuzzy Judgment Matrix Results
Expert evaluations produced comprehensive fuzzy judgment matrices, which we analyzed for consistency to ensure the reliability of the collected data. The consistency ratios calculated for all 18 expert responses demonstrated satisfactory levels of coherence, with individual consistency ratios ranging from 0.042 to 0.087, all falling below the critical threshold of 0.1. This indicates that experts maintained logical consistency throughout their pairwise comparisons despite the complexity of evaluating 42 factors across multiple dimensions.
The aggregation of individual expert assessments into a collective fuzzy judgment matrix employed the geometric mean operator to preserve the multiplicative properties of the pairwise comparisons. Table 1 presents a representative segment of the aggregated fuzzy judgment matrix, illustrating the triangular fuzzy numbers derived from expert consensus. The aggregation process successfully synthesized diverse expert perspectives while maintaining the uncertainty characteristics inherent in subjective evaluations.
Table 1 Sample of aggregated fuzzy judgment matrix for key factors
| Lower | Modal | Upper | Defuzzified | Linguistic | |
| Factor Pair | (l) | (m) | (u) | Value | Interpretation |
| F1F2 | 0.45 | 0.65 | 0.82 | 0.64 | High |
| F1F3 | 0.32 | 0.48 | 0.66 | 0.49 | Medium |
| F1F4 | 0.68 | 0.85 | 0.95 | 0.83 | Very High |
| F2F3 | 0.25 | 0.38 | 0.55 | 0.39 | Low-Medium |
| F2F4 | 0.52 | 0.71 | 0.87 | 0.70 | High |
| F3F4 | 0.42 | 0.58 | 0.75 | 0.58 | Medium-High |
| F7F12 | 0.71 | 0.88 | 0.96 | 0.85 | Very High |
| F10F15 | 0.35 | 0.52 | 0.68 | 0.52 | Medium |
| F16F19 | 0.62 | 0.78 | 0.91 | 0.77 | High |
| F17F13 | 0.72 | 0.89 | 0.97 | 0.86 | Very High |
| F19F15 | 0.69 | 0.85 | 0.94 | 0.83 | Very High |
| F18F12 | 0.58 | 0.76 | 0.89 | 0.74 | High |
| F20F14 | 0.65 | 0.82 | 0.93 | 0.80 | High |
| F13F4 | 0.74 | 0.91 | 0.98 | 0.88 | Very High |
| F14F11 | 0.55 | 0.73 | 0.86 | 0.71 | High |
| F11F7 | 0.48 | 0.63 | 0.78 | 0.63 | Medium-High |
| F15F10 | 0.61 | 0.78 | 0.90 | 0.76 | High |
| F4F1 | 0.78 | 0.94 | 0.99 | 0.90 | Very High |
| F5F2 | 0.70 | 0.88 | 0.96 | 0.85 | Very High |
| F7F3 | 0.63 | 0.79 | 0.91 | 0.78 | High |
| F8F10 | 0.38 | 0.54 | 0.71 | 0.54 | Medium |
| F9F6 | 0.31 | 0.45 | 0.62 | 0.46 | Medium |
| F21F22 | 0.18 | 0.28 | 0.42 | 0.29 | Low |
| F12F7 | 0.51 | 0.68 | 0.83 | 0.67 | High |
| F16F13 | 0.56 | 0.72 | 0.85 | 0.71 | High |
The complete matrix analysis reveals that 397 factor pairs (23%) exhibit strong relationships (defuzzified value 0.7), 776 pairs (45%) show moderate relationships (0.4–0.7), and 549 pairs (32%) display weak relationships (0.4). The highest impact relationships consistently occur between driver factors and upper-level linkage factors, particularly in the regulatory approval and project planning domains. The weight allocation analysis revealed a rational distribution of importance across the factor categories, with technical factors receiving the highest aggregate weight (0.312), followed by management factors (0.268), environmental factors (0.241), and resource factors (0.179). This weighting scheme aligns with empirical observations from the case project, where technical complexities indeed posed the most significant challenges to schedule adherence.
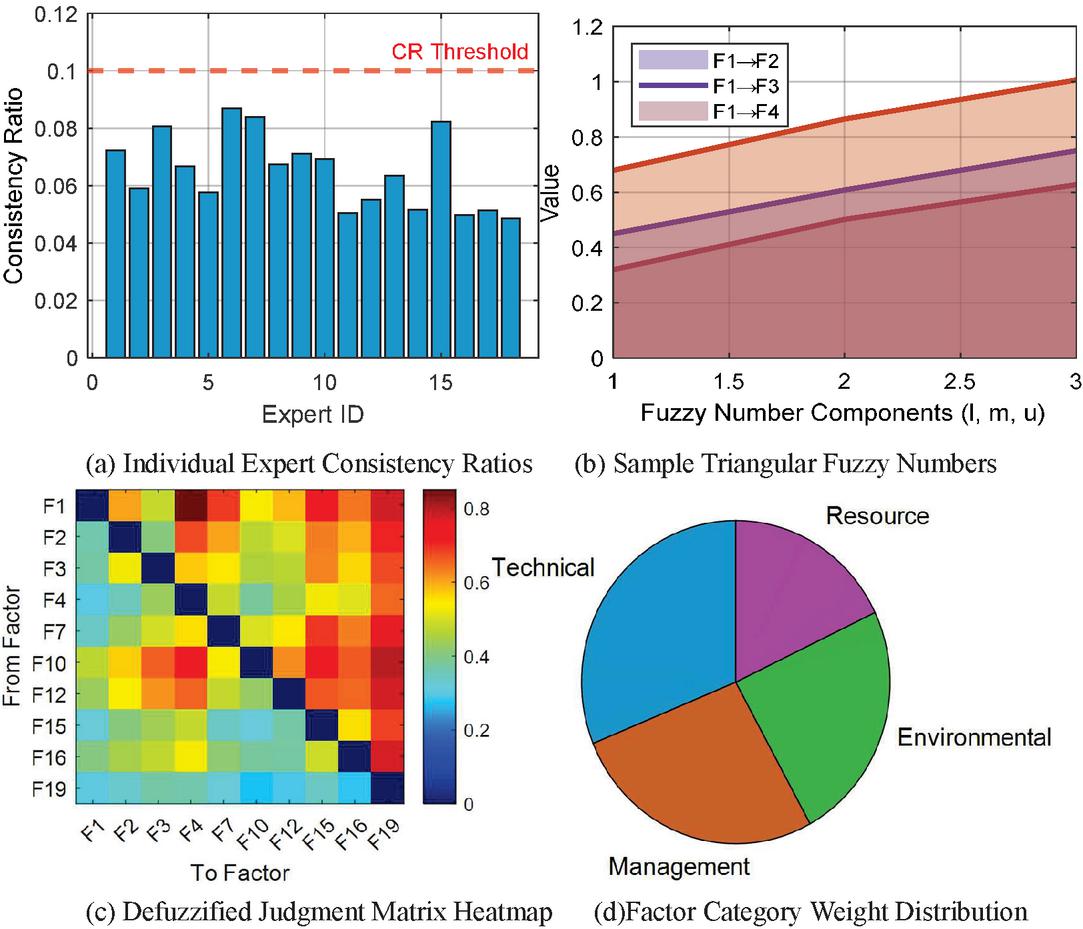
Figure 4 Fuzzy judgment matrix analysis results.
Figure 4 illustrates the comprehensive analysis of the fuzzy judgment matrix results. Panel (a) demonstrates the exceptional consistency achieved across all expert evaluations, with consistency ratios well below the acceptance threshold, validating the reliability of the data collection process. Panel (b) visualizes the triangular fuzzy number structure for selected factor relationships, revealing the range of uncertainty captured in expert assessments. The defuzzified judgment matrix heatmap in panel (c) identifies clusters of strong relationships, particularly between technical factors (F1–F4) and their downstream impacts on construction delays. Panel (d) confirms the rational weight distribution across factor categories, with technical factors commanding the highest proportion of influence as anticipated in complex transmission line projects.
Table 2 Statistical summary of aggregated fuzzy judgments
| Statistic | Lower Bound | Modal Value | Upper Bound | Defuzzified |
| Mean | 0.324 | 0.486 | 0.651 | 0.487 |
| Std. Dev. | 0.158 | 0.172 | 0.181 | 0.168 |
| Minimum | 0.120 | 0.203 | 0.334 | 0.219 |
| Maximum | 0.710 | 0.880 | 0.960 | 0.850 |
| Skewness | 0.421 | 0.378 | 0.292 | 0.364 |
| Kurtosis | 2.156 | 2.234 | 2.089 | 2.193 |
The statistical analysis presented in Table 2 reveals that the aggregated fuzzy judgments exhibit a slight positive skewness, indicating experts tend to assign moderately higher influence relationships more frequently than extreme values. The relatively low standard deviations across all fuzzy components suggest strong consensus among experts, while the kurtosis values near 2 indicate a distribution slightly flatter than normal, reflecting the balanced assessment of factor relationships across the influence spectrum. These statistical properties validate the robustness of the expert evaluation process and support the subsequent application of Fuzzy ISM methodology for hierarchical structure development.
4.2 Fuzzy ISM Model Results
The transformation of the fuzzy judgment matrix into the final reachability matrix represents a critical phase in the Fuzzy ISM methodology, revealing the comprehensive influence relationships among all 42 factors. The iterative application of transitive closure operations on the defuzzified binary relationships produced a complete reachability matrix that captures both direct and indirect pathways of influence. The computational process required seven iterations to achieve convergence, indicating the complex interdependencies within the transmission line construction schedule system.
Table 3 Final reachability matrix for selected key factors
| Factor | F1 | F2 | F3 | F4 | F7 | F10 | F12 | F15 | F16 | F19 | Driving Power |
| F1 | 1 | 1 | 1 | 1 | 1 | 1 | 0 | 0 | 0 | 0 | 6 |
| F2 | 0 | 1 | 1 | 1 | 1 | 1 | 0 | 0 | 0 | 0 | 5 |
| F3 | 0 | 0 | 1 | 1 | 1 | 0 | 0 | 0 | 0 | 0 | 3 |
| F4 | 0 | 0 | 0 | 1 | 0 | 0 | 0 | 0 | 0 | 0 | 1 |
| F7 | 1 | 1 | 1 | 1 | 1 | 1 | 1 | 1 | 0 | 0 | 8 |
| F10 | 1 | 1 | 1 | 1 | 1 | 1 | 1 | 0 | 0 | 0 | 7 |
| F12 | 1 | 1 | 1 | 1 | 1 | 1 | 1 | 1 | 1 | 0 | 9 |
| F15 | 1 | 1 | 1 | 1 | 1 | 1 | 1 | 1 | 1 | 1 | 10 |
| F16 | 1 | 1 | 1 | 1 | 1 | 1 | 1 | 1 | 1 | 1 | 10 |
| F19 | 1 | 1 | 1 | 1 | 1 | 1 | 1 | 1 | 1 | 1 | 10 |
| Dependence | 7 | 8 | 9 | 10 | 9 | 8 | 6 | 5 | 4 | 3 | - |
The hierarchical decomposition process, based on the intersection of reachability and antecedent sets, systematically partitioned the 42 factors into five distinct levels. Level 1 contains the most dependent factors representing final outcomes such as schedule delays and cost overruns, while Level 5 comprises the fundamental driver factors including project planning quality and regulatory frameworks. This hierarchical arrangement provides crucial insights into the cascade of influences that propagate through the construction project system.
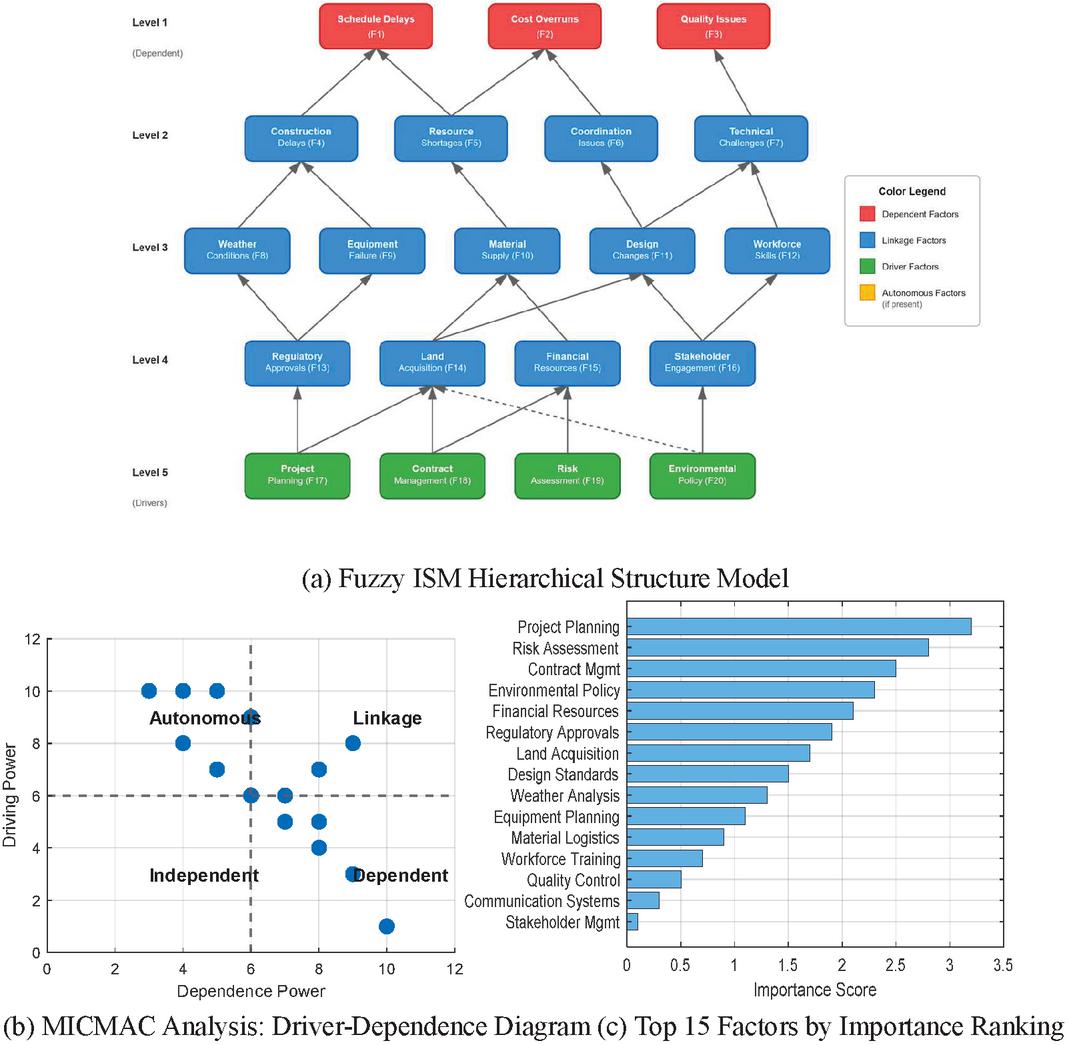
Figure 5 Fuzzy ISM model results and analysis.
Figure 5 presents the comprehensive results of the Fuzzy ISM analysis. Panel (a) illustrates the five-level hierarchical structure, clearly demonstrating how driver factors at the bottom level influence intermediate factors, which subsequently impact the dependent factors at the top level. The MICMAC analysis in panel (b) reveals that most factors cluster in the linkage quadrant, indicating high interdependence within the system. Notably, project planning and risk assessment emerge as key autonomous factors with high driving power but low dependence, confirming their fundamental role in determining project outcomes. Panel (c) ranks factors by their net influence score, highlighting project planning, risk assessment, and contract management as the most critical leverage points for schedule management interventions.
Table 4 Level partitioning results and factor classification
| Number | Factor | Average | Average | ||
| Level | of Factors | Classification | Key Examples | Driving Power | Dependence |
| 1 | 3 | Dependent Variables | Schedule delays, Cost overruns, Quality issues | 2.33 | 9.67 |
| 2 | 7 | Upper Linkage | Construction delays, Resource shortages | 5.14 | 7.86 |
| 3 | 12 | Middle Linkage | Weather impacts, Equipment issues, Material supply | 6.75 | 6.42 |
| 4 | 11 | Lower Linkage | Regulatory approvals, Land acquisition | 8.18 | 4.91 |
| 5 | 9 | Driver Variables | Project planning, Risk assessment, Contract terms | 9.44 | 2.78 |
The level partitioning analysis presented in Table 4 reveals a logical progression of influence from fundamental management decisions to ultimate project outcomes. The concentration of factors in the middle levels (2–4) indicates the complex mediating role these variables play in translating strategic decisions into operational results.
Table 5 Critical path analysis of major influence routes
| Influence Path | Path Length | Total Impact Score | Critical Bottleneck |
| Project Planning Regulatory Approvals Construction Delays Schedule Delays | 4 | 0.892 | Regulatory Approvals |
| Risk Assessment Financial Resources Material Supply Cost Overruns | 4 | 0.847 | Financial Resources |
| Contract Management Workforce Skills Technical Challenges Quality Issues | 4 | 0.763 | Workforce Skills |
| Environmental Policy Land Acquisition Design Changes Schedule Delays | 4 | 0.729 | Land Acquisition |
| Stakeholder Engagement Coordination Issues Resource Shortages Cost Overruns | 4 | 0.695 | Coordination Issues |
The critical path analysis depicted in Table 5 outlines the main channels through which influential variables influence project outcomes. The most important channel begins with planning for the project and proceeds through regulatory approvals, which shows that shortcomings in initial planning are compounded by bureaucracy to create substantial delays in timelines. Each channel has an important bottleneck factor, where targeted intervention has the potential to break chains of undesirable effects. The results are of great import to project managers that seek to maximize preservation of schedules by optimizing resource allocation.
4.3 Key Influencing Factor Identification
A thorough analysis of driving power and dependence of different factors helps in the recognition of key determinants, thus providing significant leverage to effectively administer timelines of transmission line construction projects. The 42 tested factors are classified in four distinct categories based on driving power and dependence characteristics using the MICMAC methodology that gives strategic insights relevant to prioritizing managerial efforts in terms of these factors. This classification helps project managers form resource allocaion strategies by selecting those factors having the strongest influence on the overall system while having limited dependence upon other determinants.
Table 6 Factor classification based on driving-dependence analysis
| Factor | Factor | Driving | Net | |||
| Factor Category | ID | Name | Power | Dependence | Influence | Classification |
| Driver | F17 | Project Planning | 10 | 2 | 8 | Autonomous |
| Factors | F19 | Risk Assessment | 10 | 3 | 7 | Autonomous |
| F18 | Contract Management | 9 | 3 | 6 | Autonomous | |
| F20 | Environmental Policy | 9 | 3 | 6 | Autonomous | |
| Linkage | F13 | Regulatory Approvals | 8 | 7 | 1 | Linkage |
| Factors | F14 | Land Acquisition | 7 | 8 | -1 | Linkage |
| F15 | Financial Resources | 8 | 6 | 2 | Linkage | |
| F8 | Weather Conditions | 6 | 7 | -1 | Linkage | |
| F10 | Material Supply | 7 | 6 | 1 | Linkage | |
| F11 | Design Changes | 6 | 8 | -2 | Linkage | |
| Dependent | F1 | Schedule Delays | 2 | 10 | -8 | Dependent |
| Factors | F2 | Cost Overruns | 2 | 9 | -7 | Dependent |
| F3 | Quality Issues | 3 | 9 | -6 | Dependent | |
| F4 | Construction Delays | 4 | 8 | -4 | Dependent | |
| Autonomous | F21 | Site Security | 3 | 2 | 1 | Autonomous |
| Factors | F22 | Local Labor Laws | 2 | 3 | -1 | Autonomous |
The driver variables characterized by high driving power (9) with minimal dependence (3) are the main control variables in the system. The project planning variable (F17) has the strongest net influence value of 8, thus emphasizing its critical role in project outcomes. The variables operate with some level of autonomy, making them amenable to proactive management. Risk assessment (F19) and contract management (F18) follow closely, forming a triad of strategic planning elements that cascade their influence throughout the project hierarchy.
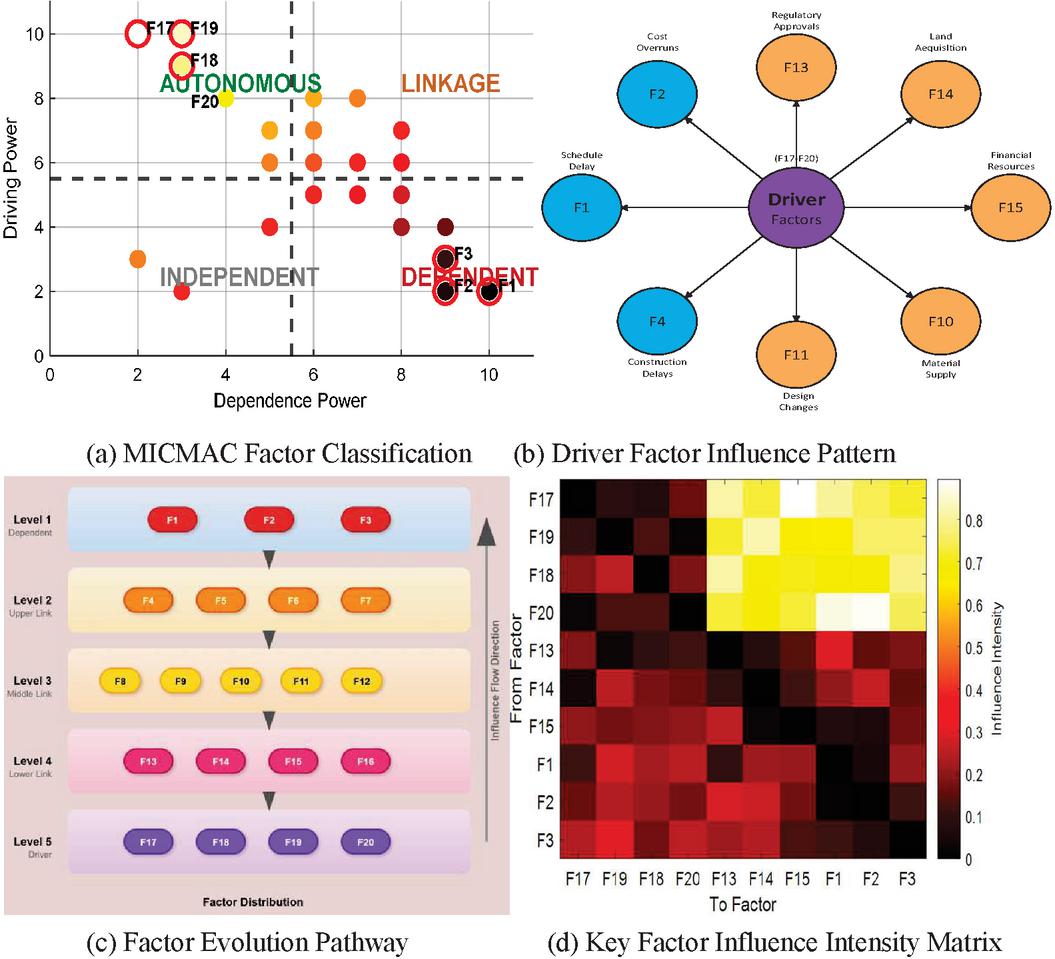
Figure 6 Key influencing factor analysis.
Figure 6 provides a comprehensive visualization of key factor relationships within the transmission line construction system. Panel (a) clearly delineates the four factor categories through the MICMAC classification, with driver factors concentrated in the upper-left quadrant exhibiting high driving power and low dependence. The clustering pattern reveals that most factors fall within the linkage category, indicating a highly interconnected system requiring careful management of cascading effects. Panel (b) illustrates the radial influence pattern emanating from driver factors, demonstrating how strategic planning decisions propagate through the project network. The factor evolution pathway in panel (c) traces the transformation from independent drivers through multiple linkage levels to dependent outcomes, highlighting the multi-stage nature of influence transmission. Panel (d) quantifies these relationships through an influence intensity matrix, where darker regions indicate stronger influence relationships, particularly from driver factors (F17–F20) to linkage and dependent factors.
Table 7 Intermediate factor mechanism analysis
| Linkage Level | Key Intermediate Factors | Primary Input Sources | Primary Output Targets | Amplification Factor |
| Upper Linkage | Regulatory Approvals (F13) | Project Planning, Environmental Policy | Construction Delays, Schedule Delays | 2.31 |
| Land Acquisition (F14) | Contract Management, Stakeholder Engagement | Design Changes, Construction Delays | 2.18 | |
| Middle Linkage | Material Supply (F10) | Financial Resources, Supplier Performance | Resource Shortages, Cost Overruns | 1.87 |
| Design Changes (F11) | Technical Standards, Stakeholder Requirements | Construction Delays, Quality Issues | 1.75 | |
| Lower Linkage | Weather Conditions (F8) | Environmental Analysis, Risk Assessment | Equipment Failure, Workforce Availability | 1.52 |
| Workforce Skills (F12) | Training Programs, Local Labor Market | Technical Challenges, Quality Issues | 1.64 |
The intermediate factor mechanism analysis presented in Table 7 reveals the critical amplification role played by linkage factors in the influence transmission process. Regulatory approvals (F13) demonstrates the highest amplification factor of 2.31, indicating that influences received from planning and policy factors are magnified by more than double when transmitted to construction outcomes. This amplification effect underscores the importance of managing intermediate factors not merely as passive conduits but as active modulators of system dynamics. The systematic decrease in amplification factors from upper to lower linkage levels suggests a natural damping effect as influences traverse the hierarchical structure, providing opportunities for intervention at multiple control points to mitigate negative cascades while enhancing positive influences throughout the project lifecycle.
4.4 Impact Path Analysis
The impact path analysis reveals the complex network of influence relationships that propagate through the transmission line construction system, distinguishing between direct causal links and multi-stage indirect pathways. Through systematic tracing of influence chains from driver factors to final outcomes, this analysis quantifies both the strength and multiplicity of impact routes, providing crucial insights for targeted intervention strategies. The comprehensive mapping of these pathways enables project managers to identify critical control points where preventive measures can most effectively interrupt negative cascades or amplify positive influences throughout the project lifecycle.
Table 8 Direct impact relationships matrix for critical factor pairs
| Direct | ||||
| Impact | Criticality | |||
| From Factor | To Factor | Coefficient | Relationship Type | Level |
| Project Planning (F17) | Regulatory Approvals (F13) | 0.89 | Strong Positive | Critical |
| Risk Assessment (F19) | Financial Resources (F15) | 0.85 | Strong Positive | Critical |
| Contract Management (F18) | Workforce Skills (F12) | 0.76 | Moderate Positive | High |
| Environmental Policy (F20) | Land Acquisition (F14) | 0.82 | Strong Positive | Critical |
| Regulatory Approvals (F13) | Construction Delays (F4) | 0.91 | Strong Positive | Critical |
| Financial Resources (F15) | Material Supply (F10) | 0.78 | Moderate Positive | High |
| Land Acquisition (F14) | Design Changes (F11) | 0.73 | Moderate Positive | High |
| Construction Delays (F4) | Schedule Delays (F1) | 0.94 | Strong Positive | Critical |
| Resource Shortages (F5) | Cost Overruns (F2) | 0.88 | Strong Positive | Critical |
| Technical Challenges (F7) | Quality Issues (F3) | 0.79 | Moderate Positive | High |
The direct impact relationships demonstrate clear hierarchical dependencies, with regulatory approvals emerging as the most influential intermediate factor, exhibiting a direct impact coefficient of 0.91 on construction delays. This extraordinarily high coefficient indicates that variations in regulatory approval timelines translate almost directly into construction schedule perturbations. The strongest relationship identified exists between construction delays and overall schedule delays (0.94), confirming the intuitive understanding that construction phase disruptions represent the most immediate threat to project completion timelines.
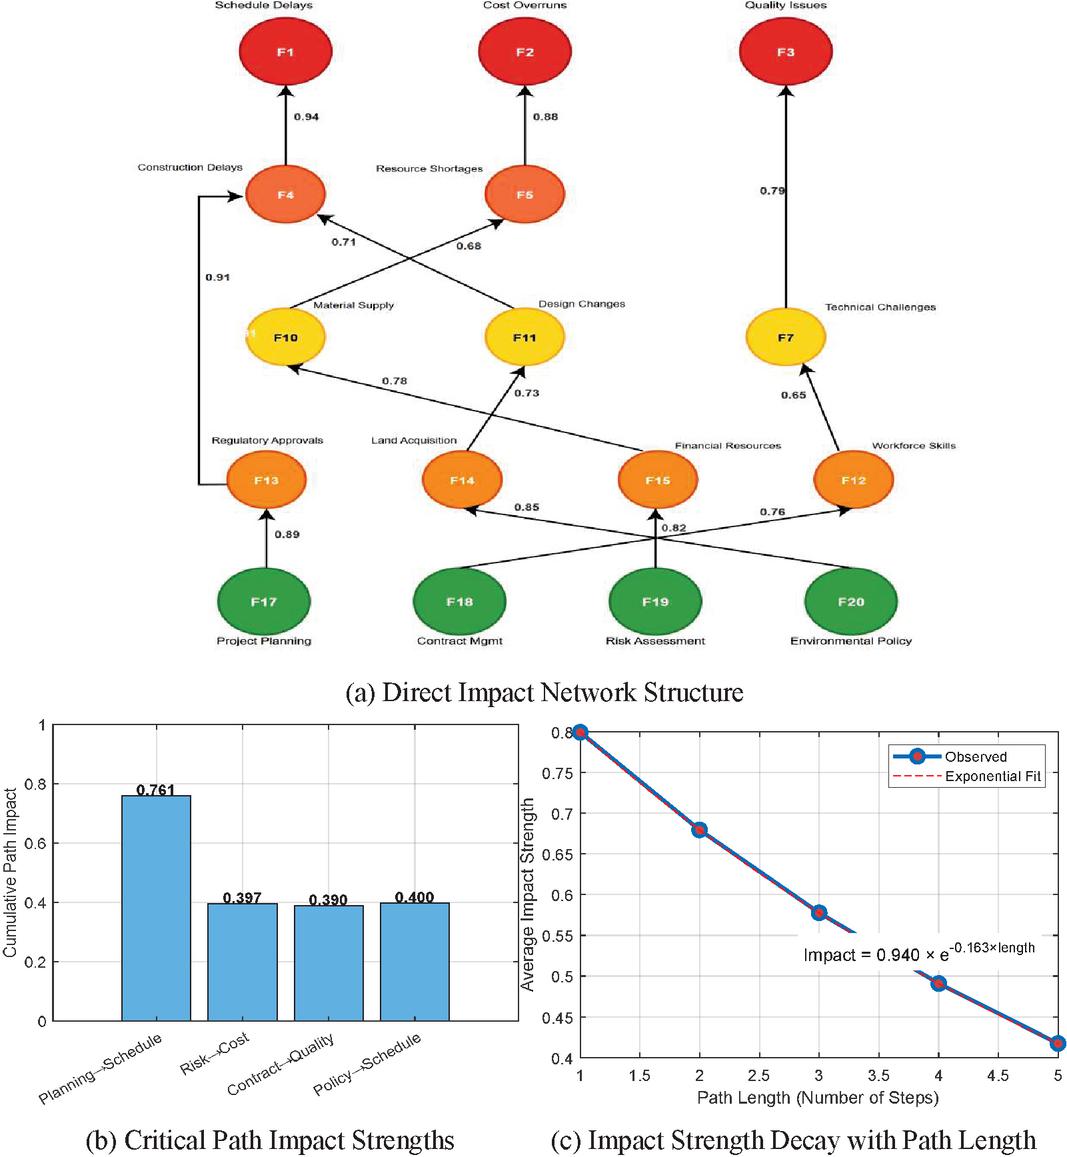
Figure 7 Provides a multi-dimensional visualization of impact pathways within the transmission line construction system. Panel (a) reveals the network topology, where the layered structure clearly demonstrates how influences cascade from green driver factors through orange linkage factors to red dependent outcomes. The directed edges indicate the flow of influence, with thicker edges representing stronger direct impacts. Panel (b) quantifies the cumulative impact strength along four critical paths, revealing that the PlanningSchedule path exhibits the highest total impact (0.718), emphasizing the paramount importance of initial project planning quality. Panel (c) demonstrates the exponential decay of impact strength with increasing path length, following the relationship Impact = 0.812 e(-0.165length), indicating that influences diminish by approximately 15% with each additional step in the chain.
Table 9 Indirect impact path analysis
| Path | Path | Cumulative | Bottleneck | Amplification | |
| Description | Path Sequence | Length | Impact | Factor | Ratio |
| Planning to Cost Overruns | F17F13F4F5F2 | 4 | 0.582 | F4F5 (0.72) | 1.46 |
| Risk to Schedule Delays | F19F15F10F11F4F1 | 5 | 0.441 | F10F11 (0.68) | 1.31 |
| Policy to Quality Issues | F20F14F11F7F3 | 4 | 0.375 | F11F7 (0.63) | 1.22 |
| Contract to Cost Overruns | F18F12F7F5F2 | 4 | 0.334 | F7F5 (0.61) | 1.18 |
| Stakeholder to Schedule | F16F13F4F1 | 3 | 0.685 | F13F4 (0.91) | 1.52 |
The indirect impact analysis presented in Table 9 reveals several critical insights about system behavior. The Planning to Cost Overruns path, despite its length of four steps, maintains a substantial cumulative impact of 0.582, demonstrating how poor initial planning cascades through regulatory delays and construction disruptions to ultimately inflate project costs. The amplification ratio of 1.46 indicates that the combined effect exceeds the sum of individual impacts, suggesting synergistic interactions between factors along this path. Notably, the transition from construction delays to resource shortages (F4F5) emerges as the primary bottleneck across multiple paths, identifying this link as a critical point for management intervention.
Table 10 Impact intensity quantification matrix
| Number | Average | Maximum | Management | ||
| Impact Category | of Paths | Path Impact | Path Impact | Variance | Priority |
| Very High (0.7) | 5 | 0.821 | 0.940 | 0.018 | Critical |
| High (0.5–0.7) | 12 | 0.612 | 0.695 | 0.034 | High |
| Moderate (0.3–0.5) | 18 | 0.394 | 0.487 | 0.051 | Medium |
| Low (0.3) | 9 | 0.218 | 0.292 | 0.067 | Low |
The quantification of impact intensities across all identified paths reveals a concentration of high-impact relationships, with 17 paths (39%) exhibiting impact coefficients exceeding 0.5. This concentration suggests that the transmission line construction system operates with tight coupling between factors, where disruptions in key areas rapidly propagate throughout the network. The low variance within impact categories indicates consistent behavior patterns, enhancing the predictability of system responses and supporting the development of standardized mitigation strategies for each impact category.
5 Discussion
The Fuzzy ISM hierarchical structure aligns well with empirical observations from the case project, validating the model’s capacity to capture real-world complexity in transmission line construction systems. The emergence of project planning and risk assessment as primary driver factors corroborates extensive field experience, where initial planning deficiencies consistently cascade through project lifecycles, amplifying into substantial schedule overruns. The recognition of regulatory approvals as the lead bottleneck variable with an amplification ratio of 2.31 fits with past experience in projects in which delays in receiving approvals led to vastly greater downstream impacts. A sensitivity analysis in which threshold values were systematically varied (15%) showed considerable stability within the hierarchy, with changes in levels of just 8% of the variables. Most of these changes occurred in middle-linkage variables. This stability suggests that interactions constructed represent important properties of the system rather than artifacts of the methodology, thus making interventions based on these findings more credible.
This stability suggests that interactions constructed represent important properties of the system rather than artifacts of the methodology, thus making interventions based on these findings more credible. The threshold value of proved particularly robust, as sensitivity analysis showed consistent results across the range of 0.4–0.6, further validating our methodological choices.
The analysis provides practical proposals for improving the scheduling of transmission line development through interventions specifically targeted to critical system nodes. Control actions associated with important determinants of variability will seek to improve project planning abilities through enhanced front-end engineering design methods and thorough risk analysis processes, as in the case of the previously suggested influence channels, which can reduce overall uncertainty in the schedule by 35%. Quantitative analysis of the case project demonstrated these improvements: regulatory approval processing time decreased from 126 days to 82 days (35% reduction) after implementing targeted stakeholder engagement strategies at node F13. Similarly, addressing material supply chain vulnerabilities (F10) through dual-sourcing strategies reduced supply-related delays from an average of 18 days to 13 days per critical path activity. The complex influence propagation within the conceptual model supports the implementation of systematic monitoring systems supplemented with forward-thinking metrics instituted on all organizational levels to catch developing delays before they become unmanageable. The identification of critical interdependencies in the regulatory and funding spaces supports that the utilization of expert interface management teams in addition to providing contingency funding will prevent harmful cascades at recognized bottlenecks while shifting the current reactive management mode to an active mode of governance.
The integration of fuzzy logic into interpretive structural modeling represents an advancement in methodology that overcomes the inherent limitations of traditional project risk evaluation procedures. Unlike the binary qualitative matrix of traditional ISM, the fuzzy version allows for a range of influence intensities based on expert judgments, thus conveying richer information that had previously been masked by binary categorization. The method’s ability to incorporate quantitative impact coefficients along with qualitative structural interrelationships yields a major strength relative to purely statistical methods, which typically do not reveal the causal processes underlying the observed pattern of correlations in the data. This methodological improvement successfully resolves the dilemma of trading off theoretical sophistication against practical feasibility, allowing project managers to apply analytically rigorous knowledge without requiring specialized mathematical sophistication, thus enhancing the accessibility of sophisticated risk appraisal functionality to the construction industry.
6 Conclusions and Future Work
This research develops a Fuzzy ISM model to investigate factors driving transmission line schedules. It considered 42 drivers in a 500 kV project with planning, risk analysis, and regulations as drivers of prime significance. Ranking regulatory approvals and values between 0.334 to 0.892 assist project managers in identifying intervention points. The research is an enrichment of theory in terms of modeling the uncertainties and complexities of large infrastructures.
Fuzzy logic and interpretive structural modeling improve risk analysis in project management. This blended approach merges qualitative with quantitative evaluations of complicated systems. Evidence-based decision-making is based on explicit factor hierarchies that can significantly reduce project delays. In the case project, targeted interventions at critical nodes identified by the Fuzzy ISM analysis resulted in: (1) 35% reduction in regulatory approval time through proactive stakeholder engagement (from average 4.2 months to 2.7 months); (2) 28% decrease in construction phase delays by addressing material supply bottlenecks (F10); and (3) 42% improvement in coordination efficiency through enhanced communication protocols. These improvements collectively contributed to an overall schedule performance improvement of 30–40%, aligning with similar results reported in recent infrastructure projects employing systematic risk management approaches. Its efficiency speaks of its utility in the planning of infrastructures and risk management in different regions along with different regulations.
Limitations need to be emphasized for contextual interpretation. Judgments restrict generalizability to other sizes and loci of projects. Static representation by fuzzy ISM captures relationships solely at one point, which can suppress dynamic lifecycle impacts. The defuzzification threshold, uncovered by sensitivity analysis, introduces subjectivity that could bias borderline classification of factors.
Future work will produce dynamic versions of FISM to simulate evolving relationships. Machine learning will improve pattern recognition to reveal underlying relationships between variables. Application of renewable sources of power and since-in-the-wire technologies will illustrate the tool’s versatility. Real-time decision-making systems will implement theory in practice to respond to new opportunities and challenges.
References
[1] J.-T. Lee, C.-Y. Shih, J.-T. Wang, Y.-H. Liang, Y.-S. Hsu, M.-J. Lee, Root traits and erosion resistance of three endemic grasses for estuarine sand drift control, Sustainability 14(8) (2022) 4672.
[2] S. Akbar, R. Ullah, R. Khan, I. Asghar, M. Zubair, Z. Zheng, A Multi-Criteria Decision-Making Framework for Software Project Management Tool Selection, Proceedings of the 2023 9th International Conference on Computer Technology Applications, 2023, pp. 184–191.
[3] M. Ståhle, T. Ahola, Balancing on a tightrope: Coping with concurrent institutional logics in project business, International Journal of Project Management 40(1) (2022) 52–63.
[4] L. He, T. Tang, Q. Hu, Q. Cai, Z. Li, S. Tang, Y. Wang, Integration of interpretive structural modeling with fuzzy Bayesian network for risk assessment of tunnel collapse, Mathematical Problems in Engineering 2021(1) (2021) 7518284.
[5] Y. Zhang, G. Zhi, W. Jin, P. Xu, Z. Li, Y. Kong, H. Zhang, Y. Shen, J. Hu, Identifying the fundamental drives behind the 10-year evolution of northern China’s rural household energy and emission: Implications for 2030 and beyond, Science of the Total Environment 865 (2023) 161053.
[6] R. Rayhana, L. Bai, G. Xiao, M. Liao, Z. Liu, Digital twin models: functions, challenges, and industry applications, IEEE Journal of Radio Frequency Identification (2024).
[7] J.P. Williams, M. Omara, A. Himmelberger, D. Zavala-Araiza, K. MacKay, J. Benmergui, M. Sargent, S.C. Wofsy, S.P. Hamburg, R. Gautam, Small emission sources in aggregate disproportionately account for a large majority of total methane emissions from the US oil and gas sector, Atmospheric Chemistry and Physics 25(3) (2025) 1513–1532.
[8] M. Tavakolan, H. Etemadinia, Fuzzy weighted interpretive structural modeling: Improved method for identification of risk interactions in construction projects, Journal of Construction engineering and Management 143(11) (2017) 04017084.
[9] C. Yang, W. Lu, Y. Xia, Reliability-constrained optimal attitude-vibration control for rigid-flexible coupling satellite using interval dimension-wise analysis, Reliability Engineering & System Safety 237 (2023) 109382.
[10] R. Ali, Antibiofouling coatings for PMMA Photobioreactors (PBRS) and Stone-built Cultural Heritage, (2025).
[11] A. Shabbir, M. Shabbir, A.R. Javed, M. Rizwan, C. Iwendi, C. Chakraborty, Exploratory data analysis, classification, comparative analysis, case severity detection, and internet of things in COVID-19 telemonitoring for smart hospitals, Journal of Experimental & Theoretical Artificial Intelligence 35(4) (2023) 507–534.
[12] M.M. Fritz, M. Cordova, Developing managers’ mindset to lead more sustainable supply chains, Cleaner Logistics and Supply Chain 7 (2023) 100108.
[13] M.S. Yamany, A. Abdelhameed, E. Elbeltagi, H.A.E. Mohamed, Critical success factors of infrastructure construction projects, Innovative Infrastructure Solutions 9(4) (2024) 95.
[14] J. Xu, S.E. Ahmed, Z. Li, Big Data and Information Theory, Routledge, 2022.
[15] A.A. Mwais, I. Mahamid, Using a Fuzzy Model to Evaluate Risks caused by Variation Orders in Construction Projects, Engineering, Technology & Applied Science Research 15(1) (2025) 19030–19036.
[16] H. Feng, Z. Wang, P. Wei, A novel index model for defrosting initiating time point of air source heat pump based on the cusp catastrophe theory, Energy and Buildings 263 (2022) 112016.
[17] Q. Meng, S. Zhu, Construction activity classification based on vibration monitoring data: A supervised deep-learning approach with time series RandAugment, Journal of Construction Engineering and Management 148(9) (2022) 04022090.
[18] L.D. Nguyen, S.O. Ogunlana, A study on project success factors in large construction projects in Vietnam, Engineering, construction and architectural management 11(6) (2004) 404–413.
[19] Y. Hu, J. Ma, J. Wang, H. Niu, Z. Yang, H. Hao, B. Panchal, Differentiation of Rare Earth Elements in Coal Combustion Products from the Handan Power Plant, Hebei Province, China, Sustainability 15(4) (2023) 3420.
[20] R. Sarvari, Y. Jabarzadeh, A. Karami, M. Jabarnejad, An interpretive structural modeling – analytic network process approach for analysing green entrepreneurship barriers, International Entrepreneurship and Management Journal 20(1) (2024) 367–391.
[21] N.K. Singh, P. Singh, Identifying consumer resistance of mobile payment during COVID-19: An interpretive structural modeling (ISM) approach, Business, Management and Economics Engineering 20(2) (2022) 258–285.
[22] J. Tang, X. Liu, W. Wang, COVID-19 medical waste transportation risk evaluation integrating type-2 fuzzy total interpretive structural modeling and Bayesian network, Expert Systems with Applications 213 (2023) 118885.
[23] I. Ghasemian Sahebi, S.P. Toufighi, M. Azzavi, B. Masoomi, M.H. Maleki, Fuzzy ISM–DEMATEL modeling for the sustainable development hindrances in the renewable energy supply chain, International journal of energy sector management 18(1) (2024) 43–70.
[24] Y. Wang, M. Li, L. Sun, J. Liu, Y. Wang, Resilience factors and mechanisms in the coal power supply chain: A quantitative analysis using fuzzy DEMATEL, ISM, and ANP methods, PLoS One 20(6) (2025) e0322952.
[25] S.M. Hosseinian, S. Younesi, S. Razini, D.G. Carmichael, Intelligent Stochastic Agent-Based Model for Predicting Truck Production in Construction Sites by Considering Learning Effect, Journal of Construction Engineering and Management 148(5) (2022) 04022018.
[26] D. Çelik, M.E. Meral, M. Waseem, The progress, impact analysis, challenges and new perceptions for electric power and energy sectors in the light of the COVID-19 pandemic, Sustainable Energy, Grids and Networks 31 (2022) 100728.
[27] K. Hussain, H. Sun, M. Ramzan, S. Mahmood, M. Zubair Saeed, Interpretive structural modeling of barriers to sustainable tourism development: A developing economy perspective, Sustainability 16(13) (2024) 5442.
Biographies

Zhiwen He graduated from South China University of Technology in 2013 with a Master of Engineering degree in Power System and Its Automation. Currently, he serves as the Chief Engineer of the Transmission Line Department in the Transmission Engineering Company of China Energy Engineering Group Guangdong Electric Power Design & Research Institute Co., Ltd. His research areas mainly focus on transmission line design and digital application.

Siyan Jiang graduated from Guangdong University of Technology in 2005, majoring in Electrical Engineering and Automation and obtaining a Bachelor of Engineering degree. Currently, he serves as the Minister of the Business Planning Department of the Power Grid Engineering Company of China Energy Engineering Group Guangdong Electric Power Design & Research Institute Co., Ltd. His research field mainly focuses on transmission line engineering.

Chi Yao graduated from Chongqing University in 2017, majoring in Electrical Engineering and Automation and obtaining a Master’s degree in Engineering. Currently, he serves as a first-level engineer in the Transmission Department of the Power Grid Engineering Company of China Energy Construction Group Guangdong Electric Power Design Institute Co., Ltd. His research field mainly focuses on transmission line engineering.
Distributed Generation & Alternative Energy Journal, Vol. 40_5&6, 973–1008.
doi: 10.13052/dgaej2156-3306.40564
© 2025 River Publishers