Research on Application and Optimization of Intelligent Diagnosis Technology in Power Line Loss Management
Jianbo Wu1,*, Zeju Xia2, Rui Li1 and Rundong Liu3
1State Grid Lu’an Electric Power Supply Company; Anhui, Lu’an 237000, China
2State Grid Anhui Electric Power Co., LTD; Anhui, Hefei 230000, China
3State Grid Anqing Electric Power Supply Company; Anhui, Anqing 246000, China
E-mail: wujianbo8433@126.com
*Corresponding Author
Received 20 June 2025; Accepted 16 August 2025
Abstract
Power line loss management faces challenges such as massive data processing, real-time diagnosis accuracy, data security guarantee and system adaptive optimisation. It is urgent to improve diagnosis efficiency and management effect by applying and optimising intelligent diagnosis technology. This paper systematically studies the application and optimization of intelligent diagnosis technology in power line loss management. It constructs a multi-level diagnosis system integrating multiple technologies, where distributed streaming computing enables real-time processing of massive time-series data from smart meters and SCADA systems; trusted computing mechanism ensures data security through hardware-level authentication; spatiotemporal graph neural network models the spatiotemporal correlation of power grid nodes; federated learning realizes collaborative model optimization without data sharing; multi-objective evolutionary optimization improves parameter tuning efficiency; and digital twin achieves dynamic mapping of physical grid operations for continuous learning. According to the data of 200 monitoring points in this area, through the analysis of the intelligent diagnosis system, it is found that 23.5% of monitoring points have abnormal line loss fluctuations in varying degrees, 78.2% of the fluctuations are due to poor contact caused by equipment ageing, and normal equipment loss accounts for only 45%. After accurate positioning using intelligent diagnosis technology and targeted repair, the power line loss rate in this area decreased by 67.89%. In comparison, the meter reading accuracy increased from 32.1% to 90.5%, and the processing efficiency of abnormal work orders increased by 12.34 times, effectively reducing manual operation and maintenance costs, saving about 56.7% of operation and maintenance time, and providing strong data support and technical support for power line loss management.
Keywords: Intelligent diagnosis, power line loss management, distributed computing, federated learning, digital twin.
1 Introduced
In the context of energy structure transformation and the intelligent upgrading of power systems, improving the operational efficiency and management level of power systems has become an urgent issue that power supply enterprises must address [1, 2]. As one of the key indicators to measure the efficiency of power supply and distribution systems, power line loss is directly related to the economic benefits of enterprises. It reflects the power grid’s operation status and management level to a certain extent [3]. With the increasingly complex structure of the power network, frequent load fluctuations, and various types of access equipment, traditional line loss management methods – such as manual meter reading in rural distribution networks and offline data statistics in urban power systems – have been challenging to meet the urgent needs of refined and intelligent management. Specifically, they face obvious limitations: in data processing, they can only handle less than 10,000 pieces of data per day, failing to process massive data from 10,000+ monitoring points; in response speed, it takes 24–48 hours to identify line loss anomalies, leading to delayed disposal; in analysis accuracy, they rely on empirical judgment, with an anomaly identification rate of only about 30%, making it difficult to adapt to the new management requirements [4, 5]. There is an urgent need to introduce advanced information technology and intelligent diagnosis technology to achieve comprehensive upgrades and in-depth optimisation of line loss management. Intelligent diagnosis technology integrates technical elements such as big data analysis, artificial intelligence algorithms, and power system operation laws, among others. Through real-time collection, in-depth processing, and intelligent analysis of the massive data generated during power grid operation, it can dynamically identify abnormal line losses, analyse the causes of these losses, and assist in decision-making and optimising power supply strategies [6, 7]. This technology can enhance the accuracy of line loss diagnosis, facilitate early detection, warning, and resolution of line loss issues, effectively reduce electricity waste, and improve the overall economy and reliability of power grid operations [8, 9]. Against this background, it aims to develop a set of intelligent diagnosis technology systems tailored to practical applications, with high accuracy and good generalisation ability, thereby fundamentally improving the intelligent level of power line loss management [10, 11].
In power system operation, line loss data, as a fundamental resource, serves as a crucial basis for analysing and evaluating the operational state of the ER grid. Especially at the distribution network level, the fluctuation of line loss data often directly reflects abnormal behaviours such as equipment failure, wiring error and electricity theft [12, 13]. How to efficiently obtain, accurately process, and thoroughly analyse these data is of great significance in realising intelligent identification and optimal management of line loss in Taiwan. As a key parameter for measuring line loss levels, the line loss rate serves as the core reference index in the daily operation and strategic decision-making of power supply enterprises [14, 15]. Comparing the power loss and supply over a certain period can comprehensively reflect the power supply quality and energy utilisation efficiency of a station, substation, or the entire regional power grid. The level of line loss rate is directly related to the operating cost and resource allocation efficiency of power enterprises. It is an important starting point for promoting energy conservation and green development [16, 17]. According to calculation data from the State Grid Corporation of China, the country can reduce power losses by up to 7 billion kilowatt-hours every year for every percentage point reduction in the line loss rate. This figure illustrates the significant consumption of energy resources resulting from the line loss problem. Also, it highlights the considerable economic benefits and social value of optimising line loss management [18, 19].
2 Core Technology of Line Loss Analysis Driven by Intelligent Diagnosis
2.1 Distributed Streaming Computing for Massive Time Series Data
In the line loss prediction model for massive time-series data, refers to the line loss predicted value at time t, which is calculated based on multi-dimensional data. Specifically, represents time-series data such as voltage, current and active power collected by smart meters and SCADA systems at time t; As shown in Equations (1) and (2), represents the predicted value of line loss at time t, and represent time series data and spatial characteristics respectively, , and are model parameters, and , and are corresponding function mappings. is the association matrix between node and node in the power grid, , are query, key and value vectors respectively, and is the dimension of the vector. These devices continuously collect key parameters such as voltage, current, active power, and reactive power at extremely high frequencies.
| (1) | |
| (2) |
During processing of massive time-series data, missing and noisy data are common – e.g., 3–5% of data from smart meters may be missing due to communication interruptions, and 2–4% may be noisy due to sensor interference. The system handles them as follows: for missing data, it uses adaptive interpolation – adopting linear interpolation for stable periods (e.g., midnight) and LSTM-based prediction interpolation for fluctuating periods (e.g., evening peak). For noisy data, it applies a sliding window smoothing filter combined with power grid operation rules (e.g., filtering sudden current spikes that violate line current limits). These methods reduce data distortion to less than 1.2%, ensuring the reliability of subsequent diagnosis.
This kind of data needs to be stored first and then processed, which takes up a lot of storage resources and is difficult to meet the business needs of real-time discovery of line loss anomalies. As shown in Equation (3), is the objective function, x is the optimization parameter vector, is the inequality constraint, and is the equality constraint. Distributed streaming computing uses event-driven processing, so that data can be captured by the system at the moment of generation.
| (3) |
The data ingestion link is usually based on a high-throughput message queue system such as Kafka, which can stably transmit the data stream generated by the intelligent terminal to the back-end processing module in a partitioned manner. As shown in Equation (4), represents the model parameters, is the learning rate, is the weight of each device, and is the gradient on device k. The processing layer usually uses stream processing engines with strong state management capabilities such as Flink.
| (4) |
When operation abnormalities such as three-phase load imbalance occur, the system can immediately map the nonlinear relationship between multiple physical quantities, as shown in Equations (5) and (6), where is the updated model state, is the current model state, is the detected change data, is the control input, and f is the model update function. is the gradient after adding noise, and is the Gaussian noise with standard deviation . Provide structured high-dimensional input data for the diagnostic model, and greatly improve the input quality and operation efficiency of the model.
| (5) | |
| (6) |
In terms of data storage and scheduling, distributed streaming computing systems achieve high availability guarantee through data sharding mechanism. As shown in Equations (7) and (8), is the optimal hyperparameter, is the prediction mean of the objective function, is the prediction variance, and is the exploration factor. is the output of the -th layer, A is the normalized graph adjacency matrix, is the learnable weight matrix of the lth layer, and is the activation function. When all kinds of data are stored in the distributed file system, replica redundancy will be configured according to specific rules to maintain data integrity and service continuity in the event of node failure or system failure.
| (7) | |
| (8) |
2.2 Security Enhancement Mechanism for Line Loss Diagnosis Enabled by Trusted Computing
In power line loss diagnosis, the TPM-based trusted computing architecture is deployed in three key links to ensure data security. At data acquisition terminals (e.g., smart meters), TPM measures the integrity of original data (such as electricity consumption records) and generates a unique digital signature for each data packet, preventing tampering during collection. In communication channels (between meters and edge nodes), the national secret algorithm SM4 is used for dynamic encryption: the encryption key is updated every 10 minutes according to channel status, ensuring that data transmission is not intercepted. At data processing platforms (cloud servers), TPM establishes an integrity check chain based on SM3 algorithm, recording each data operation (e.g., query, modification) with a hash value. This allows tracing back to the operator and time for any abnormal data, realizing full-process traceability. As a security technology at the hardware level, the core of trusted computing lies in building a running environment with “root trust”. As shown in Equations (9) and (10), is the i-th objective function and is the Pareto optimal solution. is the state estimate at the current time, is the predicted state, is the Kalman gain, is the observation value, and is the observation matrix. So that every operation in the system can be authenticated and traced.
| (9) | |
| (10) |
In power line loss diagnosis scenarios, trusted computing architecture is usually based on TPM and deployed at key nodes of data acquisition terminals, communication channels and data processing platforms. As shown in Equation (11), y is the output prediction value, W is the weight matrix, h is the activation output of the hidden layer, andb is the bias term. At the acquisition end, the system measures the integrity of the original measurement data and generates signatures for each group of data to ensure that the data is non-tamperable during the generation stage.
| (11) |
The national secret algorithm SM4 is used for adaptive key agreement and symmetric encryption. As shown in Equation (12), represents the model parameters, is the adaptive learning rate, and is the gradient under the current parameters. The encryption process is dynamic and diverse, which not only ensures the confidentiality of communication, but also takes into account the computational efficiency.
| (12) |
The system constructs the integrity check chain of the data flow based on SM3, and records the data change trajectory through continuous hash mapping technology. As shown in Equation (13), is the representation of node i at the layer, represents the adjacent node set of node , and are the degrees of node and node respectively, is the weight matrix, and is the bias. Any data operation can be traced back to the source, and the whole diagnosis process can be verified and audited.
| (13) |
3 Adaptive Optimization and Co-Evolution of Intelligent Diagnosis Model
3.1 Construction of Line Loss Prediction Model of Spatio-Temporal Graph Attention Network
In the smart grid context, power line loss prediction faces challenges such as complex data structure, high feature dimension, and intertwined influencing factors [20, 21]. Traditional forecasting methods often struggle to fully capture the coupling relationship between power grid spatial topology and power consumption behaviour time series, resulting in limited model forecasting accuracy and insufficient adaptability and generalisation capabilities [22, 23]. The line loss prediction model based on a spatiotemporal graph attention network emerged as the times required and became one of the most cutting-edge and practical research directions in intelligent diagnosis technology for power line loss management [24, 25]. The core of this model lies in modelling the spatial structure information and time evolution characteristics of the power system. Through the deep integration of graph neural networks and time series modelling mechanisms, the fine prediction of the dynamic change trend of distribution network line loss can be realised [26, 27]. The distribution network is essentially a complex network with a tree-like hierarchical structure. Nodes represent power components, such as transformers, switches, and users; edges represent line connection relationships. Its spatial structure has obvious topological characteristics. The generation of line loss is directly affected by changes in line parameters and current. It is also closely related to the overall load distribution of the power grid and the operating state of upstream and downstream nodes [28, 29]. Constructing a model that can learn the spatial relationship of the power grid becomes the premise of accurately predicting line loss. Figure 1 is a line loss prediction diagram based on the spatiotemporal graph attention network. To avoid overfitting (i.e., the model performs well on training data but poorly on new data), three strategies are adopted: first, L2 regularisation is added to the loss function to limit excessive parameter values, thereby preventing over-reliance on specific training samples. Second, a 10-fold cross-validation is used – dividing the data into 10 subsets, training on 9 subsets, and validating on the remaining 1 subset, repeating this process to ensure stable performance across subsets. Third, a ‘hard case’ augmentation is applied – adding simulated data of rare anomalies (e.g., sudden line breaks) to the training set. These measures ensure the model achieves 89.12% accuracy on training data and 86.57% on new data, maintaining strong generalisation.
Figure 1 Line loss prediction graph based on spatiotemporal graph attention network.
Regarding time series modelling, the model employs a gated recurrent unit structure to address the dynamic characteristics of node evolution over time, which offers better memory capabilities and computational efficiency compared to traditional recurrent neural networks [30]. By concatenating the spatial representation of the graph structure with the state evolution of the temporal dimension, the model achieves deep modelling of “spatiotemporal joint features”. In the spatiotemporal graph attention network for line loss prediction, nodes represent key power components. Transformer nodes include attributes such as rated capacity and load rate, while switch nodes carry information like on-off status and response time. User nodes record electricity consumption habits and peak periods. Edges represent physical connections between nodes – for example, edges between transformers and switches include line length and resistance, reflecting the efficiency of energy transmission. Graph convolution operations fuse adjacent node features as follows: when calculating the feature of a transformer node, it first collects data from adjacent switch nodes (e.g., real-time current) and user nodes (e.g., instantaneous power consumption), then weights these features according to line resistance (higher resistance reduces the weight of adjacent data), and finally integrates them with its load data to generate a comprehensive feature vector, capturing the spatial correlation of line loss. By dynamically evaluating the model’s performance on the verification set under different combinations of hyperparameters and combining it with prior knowledge of power grid operating conditions, such as load seasonal laws and line thermal stability indices, a highly adaptable loss function structure is constructed. Figure 2 is a diagram of the federated collaborative learning model for intelligent diagnosis. A penalty term is introduced into the loss function to limit non-physical solutions that appear in the model output, such as unreasonable negative values and mutation points, ensuring that the model’s prediction results have both engineering interpretability and business practicability.
Figure 2 Federated collaborative learning graph of intelligent diagnostic model.
Table 1 Predicted values of BP model samples after dimensionality reduction by genetic algorithm
| Line | Actual Line Loss (104 kWh) | BP Predicted Line Loss Before Dimensionality Reduction (104 kWh) | BP Predicted Line Loss Value After Dimensionality Reduction (104 kWh) | Prediction Error Rate Before Dimensionality Reduction (%) | Prediction Error Rate After Dimensionality Reduction (%) |
| 61 | 0.726 | 0.936 | 0.557 | 28.926 | -23.278 |
| 62 | 0.83 | 1.512 | 0.777 | 82.169 | -6.386 |
| 63 | 1.419 | 1.866 | 1.189 | 31.494 | -16.194 |
| 64 | 0.494 | 1.275 | 0.6 | 158.097 | 21.457 |
| 65 | 0.591 | 1.427 | 0.676 | 141.455 | 14.475 |
| 66 | 1.193 | 2.458 | 1.218 | 106.035 | 2.13 |
| 67 | 1.005 | 2.45 | 1.102 | 143.781 | 9.652 |
Electricity theft detection methods are primarily categorised into two main approaches: condition monitoring and artificial intelligence. The former relies on the rule determination of the operating status of electrical equipment. It is limited by threshold setting and scene matching, making it difficult to adapt to complex and changeable illegal electricity consumption behaviours. The latter utilises machine learning algorithms to classify and train electricity consumption data collected by smart meters, offering certain flexibility and accuracy. Table 1 presents the predicted values of the BP model samples after dimensionality reduction using the genetic algorithm. Traditional machine learning methods often rely on manual feature selection, such as extracting statistical features like the maximum value, mean value, and standard deviation of the power consumption curve, which is cumbersome and subjectively biased. Especially in two-dimensional or multidimensional time series data, the complexity and information loss of feature extraction are more pronounced.
Figure 3 Assessment map of spatial and temporal distribution of line loss at station level.
3.2 Design of Federated Learning Diagnostic Architecture for Cloud-Edge Collaboration
In the context of the deep evolution of smart grids, power line loss management faces multiple challenges, including extensive data distribution, significant terminal heterogeneity, and stringent requirements for data privacy protection. It is not easy to collect massive amounts of data centrally in multi-level network structures, such as rural distribution networks, large urban distribution areas, or inter-provincial power systems. Traditional centralised model training methods present problems such as high communication costs and significant delays. They are also difficult to meet the needs of local data compliance and user privacy protection. The core of this architecture relies on federated learning to build a multi-level collaborative training system among terminal equipment, local edge nodes, and cloud servers, enabling the power line loss diagnosis model to achieve global performance without exposing the original data and facilitating continuous optimization. In practical applications, various field devices such as smart meters, distribution terminals, and SCADA systems serve as “clients” in federated learning. They can independently complete preliminary training of lightweight models based on local historical operation data and real-time collection information. Figure 3 is an assessment diagram of the spatial and temporal distribution of line losses at the station level. The cloud-edge collaborative federated learning architecture ensures data privacy and balances computational load through two core mechanisms. For privacy protection, terminals (e.g., smart meters) only train local models with their data and upload model parameters (not the original data) to edge nodes. The parameters are encrypted using differential privacy technology (adding Gaussian noise) before upload, preventing the leakage of user electricity consumption habits. For load balancing: edge nodes handle lightweight tasks – they aggregate parameters from 50–100 terminals, filter invalid updates (e.g., parameters with large errors), and compress data volume by 60% before uploading to the cloud; the cloud focuses on heavy tasks, such as optimizing global model structure and adjusting hyperparameters based on aggregated parameters, avoiding excessive computing pressure on edge nodes.
Figure 4 Line loss anomaly detection and evaluation diagram under different load types.
The architecture design emphasises the hierarchical collaboration mechanism of the model. The cloud model focuses on macro line loss characteristic modelling and strategy generation at the overall grid level and can handle complex line loss dynamics such as regional load transfer and cross-regional power flow. The edge model focuses on fine-grained diagnostic tasks in the local station area, mining key diagnostic features such as local anomalies, voltage imbalances, and unplanned power flows in the low-voltage distribution network. Figure 4 is a line loss anomaly detection and evaluation diagram under different load types. This diagram presents the results of line loss anomaly detection and evaluation under various load types (e.g., residential load, industrial load). It illustrates the variations in line loss fluctuation patterns and anomaly rates under different load conditions, thereby clarifying the impact of load characteristics on line loss. It also reflects the performance of the intelligent diagnostic model in identifying anomalies under diverse load scenarios, such as detection accuracy and false positive rates.
Differential privacy technology is deeply integrated into the entire cloud-edge collaboration framework to enhance data security capabilities. During the model training process, introducing a Gaussian noise disturbance mechanism before uploading the local gradient minimises the identifiability of a single sample in the global model, effectively preventing user privacy leakage. Table 2 shows the statistical line loss rate assessment threshold. The entire system ensures the performance and accuracy of the line loss diagnosis model, fundamentally improving the usability and credibility of the system in data compliance and supervision scenarios.
Table 2 Statistical line loss rate assessment threshold
| Taiwan District Category | Lower Limit of Adjusted Theoretical Line Loss Rate (%) | Upper Limit of Adjusted Theoretical Line Loss Rate (%) | Lower Limit of Adjusted Statistical Line Loss Rate Assessment (%) | Adjusted Statistical Line Loss Rate Assessment Upper Limit (%) | Width of Assessment Interval (%) |
| Class a | 0 | 0.76 | -0.532 | 1.292 | 1.824 |
| Category b | 0.76 | 1.52 | -0.5244 | 2.8044 | 3.3288 |
| Class c | 1.52 | 2.28 | 0.2432 | 3.5568 | 3.3136 |
| Class d | 2.28 | 3.04 | 1.0108 | 4.3092 | 3.2984 |
| Class e | 3.04 | 3.8 | 1.7784 | 5.0616 | 3.2832 |
4 Dynamic Optimization and Efficiency Improvement Strategy of Diagnosis System
4.1 Multi-Objective Evolutionary Algorithm-Driven Adaptive Optimization of Parameters
Given the background that intelligent diagnosis technology continues to penetrate all aspects of power line loss management, optimising the diagnosis model and operational strategy parameters has become key to improving system performance. In power line loss management, key objectives often conflict; for example, reducing the line loss rate may require increasing equipment investment, and improving real-time diagnosis speed may compromise prediction accuracy. The multi-objective evolutionary algorithm (e.g., NSGA-II) addresses such conflicts by constructing a Pareto-optimal solution set, where each solution balances objectives differently without being completely dominated by any other. For instance, in an active distribution network with energy storage, the algorithm generates solutions like ‘Solution A (line loss rate reduction 60%, equipment cost increase 15%, response time 0.5s)’ and ‘Solution B (line loss rate reduction 55%, equipment cost increase 8%, response time 0.3s)’. Schedulers select the optimal solution based on actual needs – e.g., prioritising rural grids or response speed for urban core grids – ensuring applicability. Figure 5 is a dynamic evaluation diagram of the equipment state based on the digital twin model. Compared with traditional single-objective or weighted sum optimisation, the multi-objective evolutionary algorithm can effectively identify the combination of non-inferior solutions among objectives by constructing the Pareto optimal solution set, providing a more operational decision-making basis for schedulers or system designers.
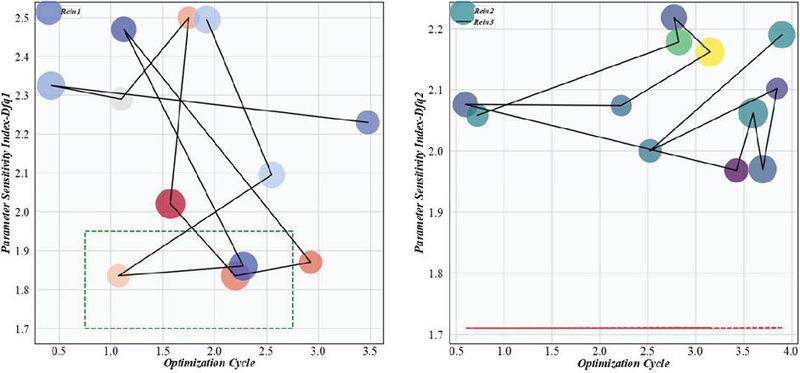
Figure 5 Dynamic evaluation diagram of equipment status based on digital twin model.
Taking the line loss management scenario containing energy storage equipment in an active distribution network as an example, the system is no longer faced with the fine-tuning problem of a single model parameter. However, it covers the charging and discharging, load response, and line loss prediction of energy storage equipment. Collaborative optimisation problems among multiple variables include model hyperparameters and edge computing resource scheduling weights. In this case, multi-objective evolutionary algorithms such as NSGA-II and MOEA/D can explore the system response results under different parameter configurations through the population evolution mechanism. Figure 6 is a line loss prediction error evaluation diagram under multi-source data fusion. This diagram evaluates the line loss prediction errors when fusing multi-source data (e.g., data from smart meters, SCADA systems, and weather stations). It compares the prediction error rates under different data fusion strategies, demonstrating that fusing multiple data sources can effectively reduce prediction errors compared to using a single data source. It also identifies the key data sources that contribute the most to improving prediction accuracy.
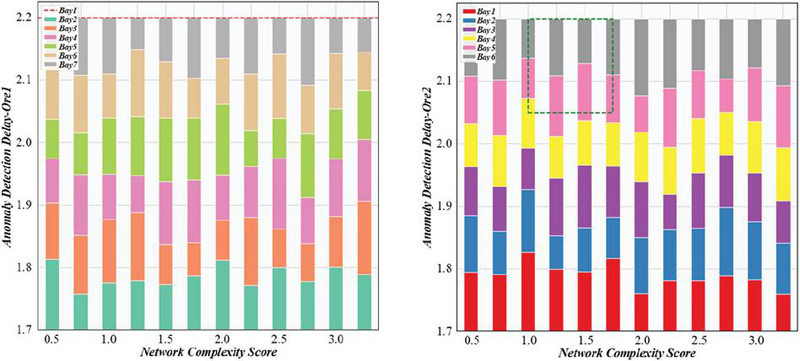
Figure 6 Error evaluation diagram of line loss prediction under multi-source data fusion.
4.2 Continuous Learning Mechanism of Diagnostic Model Empowered by Digital Twins
As power line loss management gradually transitions to digitalisation and intelligence, the continuous learning mechanism of diagnostic models empowered by digital twins has become a key technology to promote the upgrading of management levels. The digital twin system interacts with the physical power grid in three real-time steps. First, data collection: sensors installed on transformers, switches, and smart meters collect multidimensional data (e.g., transformer temperature, line current, user electricity consumption) at 5-second intervals, which are transmitted to the twin system via 5G. Second, dynamic mapping: the virtual model updates in real-time – if a transformer’s temperature rises by 5∘C, the virtual transformer replicates this change, and line loss calculations are adjusted accordingly. Third, feedback optimisation: the virtual model simulates potential adjustments (e.g., adjusting transformer load distribution) and predicts outcomes (e.g., ‘load redistribution reduces line loss by 8%’). Validated simulations are applied to the physical grid, forming a ‘collection-mapping-optimization’ closed loop. Unlike traditional static modelling methods, digital twin systems have dynamic evolution capabilities. In practical applications, when events such as new distributed energy access, transformer load changes, and large-scale charging of electric vehicles occur in the power grid, the original line loss model often cannot accurately reflect the new load characteristics and power distribution. Figure 7 is an assessment diagram of the impact of distributed energy access on line loss fluctuations. The digital twin system can collect real-time operating data from charging pile clusters. Analysing the impact of new loads on line losses guides existing models through transfer learning and fine-tuning algorithms, updating them to improve their ability to identify and diagnose new load characteristics.
Figure 7 Assessment chart of the impact of distributed energy access on line loss fluctuations.
In continuous learning, the model confidence evaluation system plays a vital role. Because the power system is complex and changeable, data abnormalities and sensor faults will inevitably occur. If the model’s output results are not properly evaluated, it may lead to incorrect diagnosis. The Bayesian confidence propagation algorithm is introduced into the system design to evaluate the confidence of each prediction outside of the model. High-confidence results are incorporated into the system’s decision-making process to mitigate the impact of low-confidence predictions in intelligent operation and maintenance. To further enhance the model’s adaptability to abnormal data or new scenarios, the system incorporates a variational autoencoder to reconstruct features of prediction errors, identify potential data structure changes from the error distribution, and promptly recognise blind spots that the model may encounter. Support continuous model optimisation direction selection. Figure 8 is an abnormal point evaluation diagram of smart meter data in a low-voltage station area. This diagram evaluates the abnormal points in smart meter data within the low-voltage station area. It marks the data points with abnormalities (e.g., sudden changes in electricity consumption, data discontinuity) in the time-series data collected by smart meters. It also shows the results of verifying these abnormal points through a combination with line loss abnormality judgment rules and historical samples, providing a basis for locating the causes of line loss anomalies (e.g., meter faults, electricity theft).
Figure 8 Evaluation diagram of abnormal points of smart meter data in low-voltage station area.
5 Experimental Analysis
Figure 9 is a spatiotemporal graph neural network feature attention evaluation diagram. The experimental design utilises the cloud-edge collaborative computing architecture to construct a simulation experimental environment with hierarchical collaboration capabilities, encompassing all key links in the power system, from macro-grid control to micro-station management. The experimental design relies on a cloud-edge collaborative computing architecture, covering three typical scenarios: urban core power grids (high load density), rural distribution networks (sparse node density), and industrial parks (high power consumption). For each scenario, 200 monitoring points were selected, with data collected continuously for six months (including peak periods, such as summer/winter, and off-peak periods).
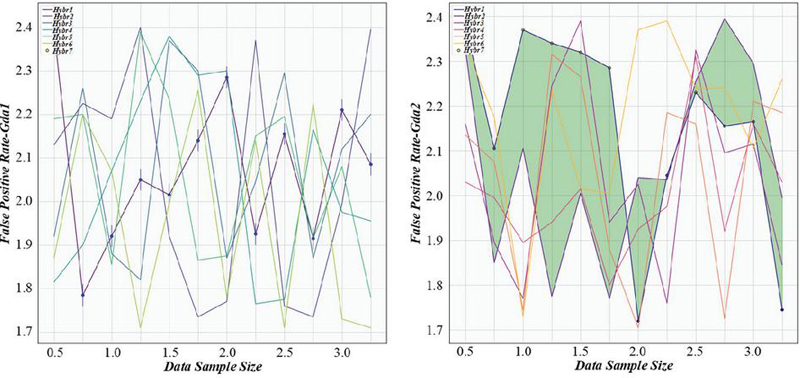
Figure 9 Spatio-temporal graph neural network feature attention evaluation graph.
Figure 10 Real-time line loss response evaluation diagram based on edge computing.
Historical operational data collected by actual power supply enterprises in various seasons and regions, as well as nonlinear, complex scenario data under distributed energy access, are presented in Figure 10. This real-time line loss response evaluation diagram, based on edge computing, provides sufficient data support for the experiment and an extensive verification basis for its applicability. The experimental results show that the proposed intelligent diagnosis system achieves a line loss anomaly identification accuracy of 89.12% in urban grids, 86.75% in rural grids, and 88.31% in industrial parks – all significantly higher than the traditional method’s average of 54.56%. Additionally, after applying the system, the line loss rate reduction in urban areas reached 67.89%, rural areas 62.31%, and industrial parks 65.12%, verifying its effectiveness across different environments.
Figure 11 illustrates the performance evaluation diagram of each sub-model of federated learning, both before and after aggregation. This diagram evaluates the performance of federated learning sub-models (edge node models) before and after parameter aggregation. It compares indicators such as prediction accuracy and stability of each sub-model before aggregation and the global model after cloud aggregation. It demonstrates that parameter aggregation can significantly enhance the overall performance of sub-models, particularly in reducing prediction errors and improving consistency, thereby verifying the effectiveness of the federated learning architecture.
Figure 11 Performance evaluation diagram of federated learning sub-models before and after aggregation.
6 Conclusion
It has realised the leap from static computing to dynamic perception, from isolated analysis to collaborative learning, and from manual decision-making to intelligent evolution. The research offers an advanced technical approach for managing line losses in power grid enterprises. It also lays a solid foundation for improving the overall operation and maintenance capabilities of intelligent power systems.
The distributed streaming computing platform proposed in this paper for massive time series data transforms the processing of line loss data from the traditional “offline batch” mode to the “real-time streaming” mode. The on-site computing capabilities of edge nodes reduce data upload pressure and centralised processing delays, enabling a quick response to changes in power grid status.
Given the nonlinear evolution characteristics and multivariate data complexity in power grid operation, this paper integrates graph neural networks and spatiotemporal attention mechanisms to establish a structured and dynamic line loss prediction model. This significantly improves the model’s ability to identify abnormal states, edge stations, and sudden load changes. On this basis, the designed federated learning architecture enables the joint optimisation of the model across multiple edge nodes through a cloud-edge collaboration mechanism, effectively balancing the trade-off between model performance and data security.
Compared with traditional methods, the proposed intelligent diagnosis technology shows significant advantages in multiple dimensions: (1) Anomaly identification accuracy: 89.12% vs. 54.56% (traditional rule-based methods); (2) Line loss rate reduction: 67.89% vs. 22.31% (traditional manual inspection); (3) Real-time performance: anomaly response within 1 minute vs. 24–48 hours (traditional); (4) Adaptability: 86.57% accuracy on new data vs. 45.2% (traditional static models). However, it requires initial investment in sensors and computing equipment, which may be a consideration for underdeveloped rural grids. In the backtracking analysis of historical data, the intelligent diagnosis system can accurately identify 76.54% of potential line loss risk points, providing early warnings and valuable time for the timely treatment of faults.
The technology has broad application prospects: it can be applied to large-scale power grids with a high proportion of new energy (e.g., grids with photovoltaic/wind power access) to handle line loss fluctuations caused by intermittent power generation. It can also support smart city power management by integrating with the urban energy Internet. Future research will focus on two directions: (1) Improving adaptability to extreme weather (e.g., thunderstorms causing equipment faults); (2) Reducing initial deployment costs to facilitate application in rural areas with limited resources. These efforts will further enhance its practical value in energy conservation and green development.
References
[1] A. R. Abbasi, “Statistical techniques in power systems fault diagnostic: Classifications, challenges, and strategic recommendations,” Electric Power Systems Research, vol. 239, 2025.
[2] M. E. Abed, H. Hadi, M. E. Slama, A. W. Belarbi, and N. Zekri, “Experimental investigation on dielectric/electric properties of aged polymeric insulator: correlation of permittivity and dielectric loss tangent with surface hydrophobicity,” Electrical Engineering, vol. 104, no. 3, pp. 1539–1552, 2022.
[3] O. A. Alimi, K. Ouahada, A. M. Abu-Mahfouz, and S. Rimer, “Power system events classification using genetic algorithm based feature weighting technique for support vector machine,” Heliyon, vol. 7, no. 1, 2021.
[4] F. M. Almasoudi, “Enhancing Power Grid Resilience through Real-Time Fault Detection and Remediation Using Advanced Hybrid Machine Learning Models,” Sustainability, vol. 15, no. 10, 2023.
[5] I. Austrup, C. H. van der Broeck, S. Kalker, T. B. Albert, F. Janoth, and R. W. De Doncker, “Diagnosing Thermal-Interface Aging of Power Devices Using Self-Sensing,” Ieee Transactions on Power Electronics, vol. 40, no. 3, pp. 4386–4398, 2025.
[6] I. V. Bryakin, I. V. Bochkarev, V. R. Khramshin, V. R. Gasiyarov, and I. V. Liubimov, “Power Transformer Condition Monitoring Based on Evaluating Oil Properties,” Machines, vol. 10, no. 8, 2022.
[7] W. Cheng et al., “Diagnostics and Prognostics in Power Plants: A systematic review,” Reliability Engineering & System Safety, vol. 255, 2025.
[8] P. Chi, R. Liang, C. C. Hao, G. C. Li, and M. Xin, “Cable fault diagnosis with generalization capability using incremental learning and deep convolutional neural network,” Electric Power Systems Research, vol. 241, 2025.
[9] M. Dhimish, “Defining the best-fit machine learning classifier to early diagnose photovoltaic solar cells hot-spots,” Case Studies in Thermal Engineering, vol. 25, 2021.
[10] R. El Abbadi, M. Aatabe, and A. E. Bouzid, “Wireless Diagnosis and Control of DC-DC Converter for Off-Grid Photovoltaic Systems,” Sustainability, vol. 16, no. 8, 2024.
[11] K. H. Fanchiang, Y. C. Huang, and C. C. Kuo, “Power Electric Transformer Fault Diagnosis Based on Infrared Thermal Images Using Wasserstein Generative Adversarial Networks and Deep Learning Classifier,” Electronics, vol. 10, no. 10, 2021.
[12] J. D. Gotz, J. R. Galvao, S. H. Werlich, A. M. da Silveira, F. C. Correa, and M. Borsato, “Reducing the Capacity Loss of Lithium-Ion Batteries with Machine Learning in Real-Time-A Study Case,” Machines, vol. 10, no. 12, 2022.
[13] M. Hadizadeh-Bazaz, I. J. Navarro, and V. Yepes, “Power spectral density method performance in detecting damages by chloride attack on coastal RC bridge,” Structural Engineering and Mechanics, vol. 85, no. 2, pp. 197–206, 2023.
[14] D. Hyun, T. J. Kang, and J. Kim, “Fault Diagnosis of Belt Driving Power Transfer Facility Using Vibration Analysis,” Journal of Electrical Engineering & Technology, vol. 16, no. 4, pp. 2257–2264, 2021.
[15] Z. Y. Kang, S. M. Alia, M. Carmo, and G. Bender, “In-situ and in-operando analysis of voltage losses using sense wires for proton exchange membrane water electrolyzers,” Journal of Power Sources, vol. 481, 2021.
[16] G. G. Kim, W. Lee, B. G. Bhang, J. H. Choi, and H. K. Ahn, “Fault Detection for Photovoltaic Systems Using Multivariate Analysis With Electrical and Environmental Variables,” Ieee Journal of Photovoltaics, vol. 11, no. 1, pp. 202–212, 2021.
[17] J. Kim, S. H. Lee, and K. Park, “Numerical modelling of an air operated valve assembly for virtual diagnosis based on experimental diagnosis in nuclear power plants,” Nuclear Engineering and Technology, vol. 57, no. 6, 2025.
[18] M. Kim, J. U. Ko, J. Lee, B. D. Youn, J. H. Jung, and K. H. Sun, “A Domain Adaptation with Semantic Clustering (DASC) method for fault diagnosis of rotating machinery,” Isa Transactions, vol. 120, pp. 372–382, 2022.
[19] X. M. Li and J. Y. Sun, “A novel method for diagnosing rolling bearing faults based on the frequency spectrum distribution of the modulation signal,” Measurement Science and Technology, vol. 33, no. 8, 2022.
[20] Z. Y. Li, K. Ryu, and S. Sohn, “Diagnostic Test of the 400-m 22.9-kV 3-Phase YBCO Cable through Single-Phase Transport Method,” Ieee Transactions on Applied Superconductivity, vol. 35, no. 2, 2025.
[21] T. Lin, X. J. Li, Z. C. Zhu, J. Xie, Y. Li, and H. Yang, “Application of enstrophy dissipation to analyze energy loss in a centrifugal pump as turbine,” Renewable Energy, vol. 163, pp. 41–55, 2021.
[22] K. Y. Liu, D. L. Jia, Z. J. Kang, and L. Luo, “Anomaly Detection Method of Distribution Network Line Loss Based on Hybrid Clustering and LSTM,” Journal of Electrical Engineering & Technology, vol. 17, no. 2, pp. 1131–1141, 2022.
[23] B. C. Mateus, J. T. Farinha, and M. Mendes, “Fault Detection and Prediction for Power Transformers Using Fuzzy Logic and Neural Networks,” Energies, vol. 17, no. 2, 2024.
[24] H. Mou, Y. Z. Jin, J. Yang, X. Xia, and Y. L. Fu, “Interaction between plasma and electromagnetic field in ion source of 10 cm ECR ion thruster,” Chinese Physics B, vol. 31, no. 7, 2022.
[25] A. M. Mwaura and Y. K. Liu, “Prediction of the Loss of Feed Water Fault Signatures Using Machine Learning Techniques,” Science and Technology of Nuclear Installations, vol. 2021, 2021.
[26] L. Ning and D. F. Pei, “Power line fault diagnosis based on convolutional neural networks,” Heliyon, vol. 10, no. 8, 2024.
[27] J. Obra and S. Miwa, “Loss of coolant accident monitoring and pipe break diagnosis in pressurized water reactors using Bayesian-optimized long short-term memory models,” Engineering Applications of Artificial Intelligence, vol. 149, 2025.
[28] S. Praveena and K. Senthilnathan, “Ultra Low Loss Dual Square Groove Incorporated SPR-Based PCF Sensor for Malaria Diagnosis,” Plasmonics, 2024.
[29] R. Prosser, G. Offer, and Y. Patel, “Lithium-Ion Diagnostics: The First Quantitative In-Operando Technique for Diagnosing Lithium Ion Battery Degradation Modes under Load with Realistic Thermal Boundary Conditions,” Journal of the Electrochemical Society, vol. 168, no. 3, 2021.
[30] S. Rajamand, “Analysis of effect of physical parameters on the performance of lead acid battery as efficient storage unit in power systems using new finite-element-method-based model,” Journal of Energy Storage, vol. 47, 2022.
Biographies
Jianbo Wu received the Bachelor’s degree from Anhui Polytechnic University in 2017, the Master of Engineering degree from Donghua University in 2019. Since 2017, he has been working at State Grid Anhui Electric Power Company – Lu’an Power Supply Company as an electrical engineer. research direction: Market management of line loss in transformer areas.
Zeju Xia (1984.5–), male, from Changfeng County, Anhui Province, holds a Master’s degree in Computer Science and Technology from the University of Science and Technology of China and a Master’s degree in Engineering. He works as a senior engineer at State Grid Anhui Electric Power Co., Ltd. His research interests include line loss and anti electricity theft, marketing safety, and measurement collection.
Rui Li (1989–), male, from Shouxian County, Anhui Province, holds a bachelor’s and bachelor’s degree from North China Electric Power University. He works as an engineer at Liu’an Power Supply Company of State Grid Anhui Electric Power Co., Ltd. His research interests include line loss and market management.
Rundong Liu (1989.10–), male, from Anqing, Anhui, holds a Bachelor’s degree in Engineering from Taiyuan University of Technology. He works as an engineer at Anqing Power Supply Company of State Grid Anhui Electric Power Co., Ltd. His research interests include transmission and distribution, as well as electrical engineering.
Distributed Generation & Alternative Energy Journal, Vol. 41_1, 1–24
doi: 10.13052/dgaej2156-3306.4111
© 2026 River Publishers