Online Monitoring of State and Leakage in Spliced OPPC Cables
Bing Hu1, Fangya Li1,*, Wanyi Huang2 and Bin Huang1
1State Grid Hubei Electric Power Co., Ltd. Xiaogan Power Supply Company, Xiaogan, 432000, China
2School of Electrical and Electronic Engineering, Hubei University of Technology, Xiaogan, 432000, China
E-mail: lifang7ya@outlook.com
*Corresponding Author
Received 07 July 2025; Accepted 20 August 2025
Abstract
With the rapid development of communication networks, the optical phase conductor (OPPC) is now widely used in power communication systems. However, their complex operating conditions make existing monitoring methods less effective for fault and leakage detection. This paper proposes an online monitoring method using Brillouin optical time domain analysis (BOTDA) and geographic information system (GIS) technology. A mathematical model of cable temperature changes is built, and BOTDA captures distributed temperature data. GIS helps locate faults, while the random forest algorithm classifies fault types. Simulation results show that under a 4C/h temperature change and wind speed up to 9.32 m/s, the method performs well. Prediction errors for ice thickness stabilize as ice accumulates. The random forest algorithm achieves 95.56% average accuracy within 9.65 seconds. This approach enables real-time, accurate monitoring, supporting efficient maintenance of power communication networks.
Keywords: Optical phase conductor, environmental temperature and status monitoring, distributed sensors, fault location identification.
1 Introduction
The optical phase conductor (OPPC) is a special type of photoelectric composite cable primarily used in power systems where no ground wire is available, serving as an alternative telecommunication solution to Optical Ground Wire (OPGW) [1]. OPPC shares a similar basic structure with OPGW but is specifically designed to mimic the mechanical and electrical characteristics of the phase conductor it replaces, ensuring compatibility with existing power transmission lines. Unlike OPGW, which is not energized, OPPC operates under high-voltage power lines, presenting unique design and installation challenges. Since OPPC must function stably in an energized environment, it differs significantly from OPGW in splicing technology and insulation protection [2]. For instance, OPPC requires specially designed splice boxes and insulators to accommodate high-voltage line conditions while ensuring reliable optical signal transmission [3]. Furthermore, as OPPC is an integral part of the phase conductor, it must meet stringent mechanical load, thermal resistance, and electromagnetic compatibility standards to ensure safe operation within the power transmission system. Therefore, real-time status monitoring and fault diagnosis for OPPC lines are of critical importance. In recent years, scholars at home and abroad have conducted a lot of research on monitoring technology and performance testing of fiber optic networks. Reference [4] addressed the structural state monitoring of OPPC on high-voltage transmission lines and proposed a distributed structural vibration monitoring method based on Chirped-Pulse Phase-Sensitive Optical Time-Domain Reflectometry (CP-OTDR). This approach enables real-time sensing of cable vibrations, sag variations, and external intrusions over transmission lines up to 40 km in length. The study represents the first field deployment of OPPC monitoring in an actual overhead transmission environment, validating the feasibility and application value of distributed optical fiber sensing technology in such scenarios.
Regarding the vibration problem of overhead power lines, reference [5] proposed a phase sensitive optical time domain reflectometer to monitor the vibration state of composite optical fibers in accelerated transmission lines, providing technical reference for vibration monitoring of optical fiber composite overhead power lines.
Regarding the issue of monitoring the status of high-voltage equipment in power transmission networks, reference [6] proposed the use of fiber Bragg grating sensor technology for on-site status monitoring of equipment, thus demonstrating the superiority of their technology. Regarding the monitoring of fiber state and transmission state, reference [7] used Brillouin optical time domain reflectometry to monitor the strain of the composite fiber in the transmission line, and demonstrated the effectiveness of their technology through spectral fitting calculations.
There is also testing and application of sensor technology in the monitoring of cable equipment. Regarding the application research of cables and Gas insulated substations (GIS), reference [8] proposed to connect the cables of substations with GIS to ensure optimal protection configuration and improve the safety of related equipment. Regarding the issue of sensor detection of power equipment, reference [9] proposed frequency response of cable and sensor systems, and found through experiments that their system had superior detection performance. Regarding the issue of fiber optic sensing signals, reference [10] proposed using a Support Vector Machine (SVM) classifier to classify the processed dataset, to verify the effectiveness of multi-dimensional feature extraction of sensing signals.
Although existing studies have made progress in monitoring OPPC cable vibrations, fiber strain, and sensing signal recognition, several limitations remain. Firstly, most current methods focus on structural responses (such as vibration or strain), while insufficient attention has been paid to the thermal behavior of OPPC cables and the modeling of temperature field evolution. Secondly, although some approaches exhibit strong local detection capabilities, they lack effective integration between fault sensing and spatial localization, making it difficult to achieve comprehensive monitoring in complex transmission scenarios. To address these gaps, this study proposes a BOTDA-based distributed temperature sensing model, which establishes a thermal characteristic mathematical framework coupled with real-world operating conditions to better characterize the cable’s thermal evolution. In addition, a GIS platform is integrated to enable spatial localization and visualization of cable routing, while a random forest algorithm is employed to identify fault types, forming a closed-loop “sensing–localization–diagnosis” system. This research achieves a practical and innovative fusion of OPPC state modeling, spatial data management, and intelligent fault analysis, offering strong applicability in engineering contexts.
The contribution of this research lies in the development of an OPPC optical-electrical composite cable status monitoring and fault detection method based on BOTDA distributed sensing technology, GIS monitoring systems, and machine learning algorithms. This method utilizes BOTDA technology to achieve high-precision distributed measurement of cable temperature and strain, enhancing state perception capabilities in complex environments. Additionally, it integrates a GIS system for fault localization and remote management, improving the intelligence and visualization of cable monitoring. Furthermore, a machine learning-based fault identification model is constructed to optimize fault classification methods and enhance automated diagnostics. This research provides a novel technical solution for real-time monitoring and intelligent operation of power communication networks, advancing the application of fiber optic sensing and intelligent monitoring technologies in power systems.
The paper is divided into five sections. The first section provides an introduction to the topic. The second section provides a detailed description of the physical structure of the OPPC cable, environmental temperature modeling, and the working principle of the BOTDA sensing system, as well as an introduction to the GIS remote monitoring system and machine learning algorithms for cable fault detection. The third section analyzes the temperature variation characteristics of OPPC cables, the effectiveness of GIS fault monitoring, and the performance of different machine learning algorithms in fault classification through simulation experiments. The fourth section conducts an in-depth analysis of the research results, comparing them with related studies to further verify the effectiveness of the proposed method. The fifth section summarizes the main research findings, identifies the limitations of the study, and proposes future research directions.
2 Methods and Materials
This study monitored the signal variations in OPPC spliced optoelectronic composite cables by analyzing temperature changes in the cable environment. By integrating BOTDA distributed sensing technology with GIS-based data collection and processing, the system can effectively locate and identify line leakage faults, enabling real-time monitoring and automated fault detection.
2.1 The Structure and Temperature Change Status of OPPC
The optical fibers inside OPPCs can achieve the transmission of line data and sensing information in power network operation. However, in the structure of OPPC, the technology of synchronously meeting communication services and fault supervision continues to develop, and OPPC technology is one of the more advanced methods. At the same time, the power grid system needs to meet the requirements of real-time and long-term monitoring of line status during operation.
The unique structure, materials, and tools of OPPC spliced optoelectronic composite cables are used to provide a foundation for the online monitoring system of the power system. The result is shown in Figure 1.
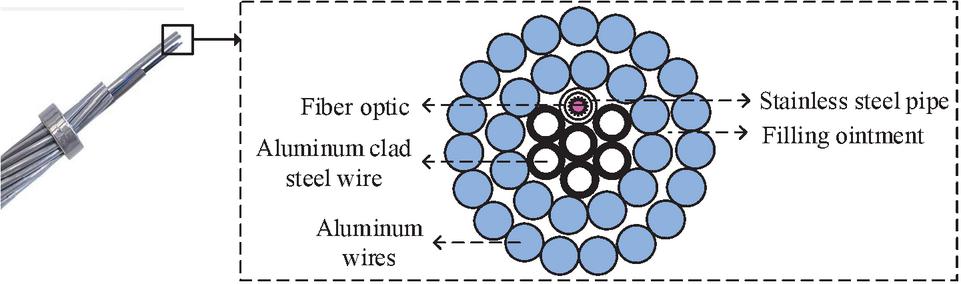
Figure 1 Schematic diagram of OPPC structure.
From Figure 1, the OPPC consists of stainless-steel pipes, fiber optic units, aluminum clad steel wires, and aluminum wires. A certain number of fiber optic devices are located in the oil-filled stainlesssteel pipes, and there is excess length inside the steel pipes. In addition, in the cross-sectional structural diagram, its mechanical properties, electrical functions, and thermal conductivity play an important role in the operation status of the optical cable. Among them, aluminum clad steel wire acts on the tensile strength of the optical fiber, while aluminum wire can provide the current carrying capacity of the transmission line and enhance some mechanical strength [11].
To design a high-performance online monitoring scheme for optical cables, temperature changes in a frozen environment are studied to analyze the status of the optical cables. The temperature changes of optical cables, along with solar radiation, line temperature, and other environmental factors, can directly affect the monitoring of cable status [12, 13]. The thermal balance expression of the optical cable under solar radiation is shown in Equation (1).
| (1) |
In Equation (1), , , and represent solar radiation, convective heat dissipation, and radiative heat dissipation, respectively. The expression for solar radiation is shown in Equation (2).
| (2) |
In Equation (2), represents the heat absorption coefficient and is the solar radiation rate. is the diameter size of OPPC lines. Convection heat dissipation is shown in Equation (3).
| (3) |
In Equation (3), represents the coefficient of convective heat transfer, and represent the line temperature and ambient temperature, respectively, and Re is the Reynolds number. The expression for radiative heat dissipation is shown in Equation (4).
| (4) |
In Equation (4), represents the thermal conductivity of the aluminum wire, and is the Boltzmann constant. In the temperature changes of the line caused by icing, there are differences in the temperature changes of the optical fiber structure at different times, and the thermal balance of the line after icing is shown in Equation (5).
| (5) |
In Equation (5), represents the solar radiation energy under ice sheet conditions, represents the radiative heat dissipation under ice sheet conditions. The two are respectively the correction quantities after adding the influence of ice sheets on the basis of the corresponding quantities in the ice-free state. represents the thickness of the ice sheet. is the radiation coefficient of ice, which is used to calculate the net radiative heat dissipation on the surface of ice sheets. In addition, the environmental factors that affect the temperature of the line are expressed as heat conduction in Equation (2.1) when not covered with ice.
| (6) |
In Equation (2.1), , , and represent the densities of optical fiber, steel wire, and aluminum wire, respectively, and their specific heat capacity and thermal conductivity are and , respectively. Additionally, is the wind speed vector and is the product of quantities. Only in the case of icing can the heat conduction of the circuit be obtained, as shown in Equation (7).
| (7) |
In Equation (7), , , and represent the density, specific heat capacity, and thermal conductivity of ice, while represents convective heat dissipation under ice cover. In addition, temperature calculation of optical cable lines during temperature changes can improve the accuracy and feasibility of online monitoring of OPPC status. The average ambient temperature plays an important role in the temperature of optical cable lines under different conditions, and its heat transfer effect is relatively short, as shown in Equation (8).
| (8) |
In Equation (8), represents the sinusoidal variation of ambient temperature in C, where represents time in h. represents the amplitude of temperature fluctuations, while represents the average temperature value. However, there are different characteristics in the machine curve of the temperature change of the optical cable during the icing stage, so the hysteresis duration and hysteresis phase are used to derive the temperature change of the optical cable [14], as shown in Equation (9).
| (9) |
In Equation (9), represents the lag time, is the time for the maximum cable temperature in the ice-covered section, and is the time for the maximum environmental stability. The lag phase is shown in Equation (10).
| (10) |
In Equation (10), represents the temperature hysteresis phase of the ice-covered section of the optical cable, in (C). To describe the thermodynamic behavior of OPPC cables under conditions of icing, wind speed, and ambient temperature variation, a mathematical model of temperature variation was established based on the principle of thermal equilibrium. The model comprehensively incorporates the effects of solar radiation input, convective and radiative heat dissipation, heat conduction through the ice layer, and periodic environmental temperature disturbances, corresponding to Equations (1) through (10). During the modeling process, it is assumed that the ambient temperature varies sinusoidally over short periods, wind speed and ice thickness remain constant, and the thermal conductivity and specific heat capacity of aluminum wires, steel wires, and the ice layer do not change with temperature. Additionally, variations in solar angle and radiation direction are not considered. This model provides the theoretical basis for subsequent analysis of distributed temperature sensing data and thermal field evolution, and is consistent with the simulation setup, facilitating comparative validation in later sections.
Therefore, to accurately obtain temperature information and its variation characteristics of optical cable lines, BOTDA distributed sensing technology is studied to transmit temperature and sensing information of optical fibers, so as to measure and detect scattered signals in a distributed manner [15, 16]. The system structure is shown in Figure 2.
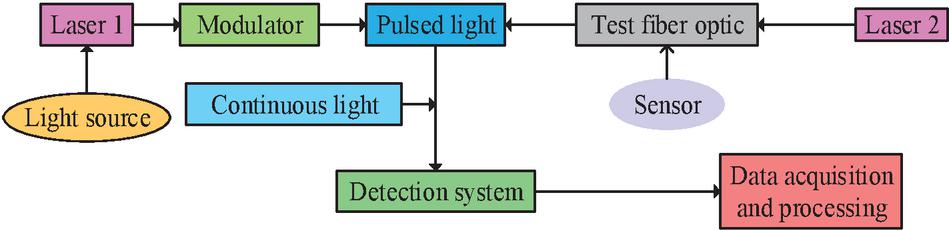
Figure 2 Schematic diagram of the structure of the BOTDA sensing system.
From Figure 2, BOTDA distributed sensing technology utilizes the intensity ratio of its backscattered light and performs incident pulse light and probe light on both sides of the sensing fiber. When the frequency difference between two light sources is equal to the frequency shift of BOTDA, energy transfer of the light source occurs in the model field of BOTDA, thereby obtaining temperature information on the sensing fiber and its system. The sensing signal in BOTDA can be directly detected, and the detection accuracy is good. Considering that OPPC is often deployed on high-voltage transmission lines of 110 kV, where strong electromagnetic interference (EMI) is prevalent, this study integrates differential detection technology into the BOTDA signal acquisition module. This method suppresses common-mode noise by processing the difference between two complementary optical signals, significantly enhancing the signal-to-noise ratio (SNR) of the Brillouin gain spectrum. In addition, optical isolation is implemented between the sensing fiber and metallic conductors, and narrowband optical filters along with time-domain averaging mechanisms are configured at the front end of the system to reduce power frequency interference and pulse disturbances. The integration of these anti-interference strategies effectively ensures the stability and reliability of temperature sensing using BOTDA in strong electromagnetic environments.
2.2 Design of OPPC Leakage and Fault Monitoring System
To monitor the real-time and stable status of OPPC spliced optoelectronic composite cables, the monitoring system not only needs to consider extreme temperature changes, but also needs to locate and identify faults in the optical cable lines. To ensure remote control and real-time management of the optical cable detection area, GIS servers and their data storage devices are used to collect and locate data on the optical cable lines within the area, thereby achieving remote distributed online monitoring and precise control of optical cables. Therefore, the design of the automatic monitoring system for optical cables is shown in Figure 3.
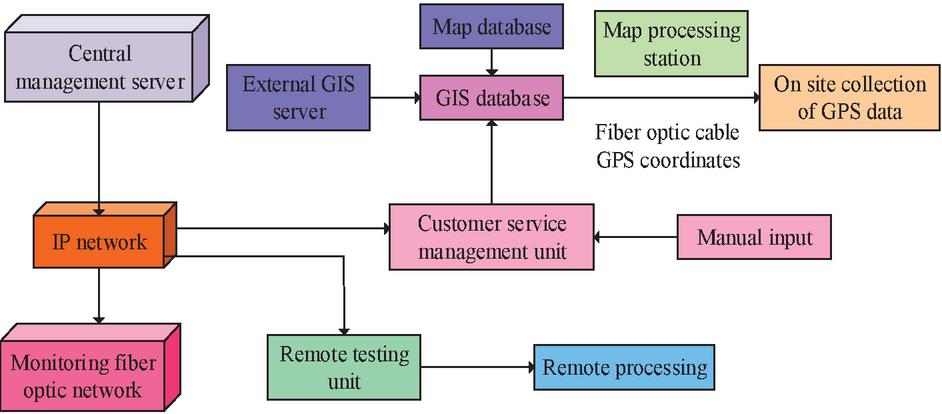
Figure 3 Structure diagram of the design of the automatic monitoring system for optical fiber network.
As shown in Figure 3, the optical cable network automatic monitoring system consists of a central management server, client management unit, and remote testing unit. The central management server serves as the core module, responsible for the unified scheduling and management of fault status, sensing data, and equipment configurations across the cable network. The system integrates a GIS server and map processing unit, enabling spatial modeling, localization, and visualization of cable layout information. During fault monitoring, the system utilizes GIS positioning services to standardize the encoding and management of OPPC cable routes and node coordinates. It then combines this with temperature variations or signal anomalies obtained from the BOTDA distributed sensing system to realize remote fault detection. Specifically, the system measures the signal transmission delay between the sensor node and the central station, and calculates the physical distance between the monitoring point and the fault location based on the optical signal propagation speed and fiber refractive index. This distance is then mapped onto the established spatial path data in the GIS database, enabling precise localization of the fault point, with a practical positioning error controlled within 3 meters. In addition, the GIS platform supports functions such as map layer overlay, historical fault trajectory analysis, and alarm region highlighting, significantly enhancing the visualization capabilities and operational efficiency of remote cable monitoring. The system also enables joint analysis of fault types and spatial distribution, providing spatial decision support for subsequent maintenance. The calculation of the physical distance between the monitoring point and the fault point is shown in Equation (11).
| (11) |
In Equation (11), represents the distance between the monitoring point and the testing point, represents the propagation speed of light in a vacuum environment, is the time between transmitting and receiving signals, and is the refractive index of the detection fiber [17]. The management and operation of the entire system are achieved through the joint operation of servers and units, and the collection, management, and warning of optical cable monitoring points are carried out in network connections and application software modules, providing a basic management mode for fault analysis of optical cable lines. The fault types and abnormal traffic of optical cable lines are extracted in the network, to strengthen the monitoring of abnormal situations in OPPCs. In network collection and data storage, fiber optic line faults are mainly caused by various factors such as interruption, damage, and leakage. Research is being conducted on using machine learning systems to classify and identify fiber optic line faults in order to achieve real-time online detection. The process of the optical cable line management system is shown in Figure 4.
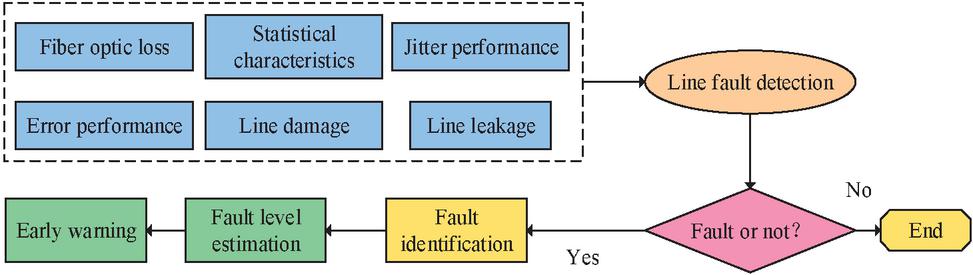
Figure 4 Automatic monitoring system and management process for optical cable line faults.
From Figure 4, the fiber optic network detection system and fault management system use fault recognition classifiers to detect and estimate the located line faults after obtaining network characteristic parameters of line losses or interruptions. Under the training of machine learning algorithms and neural networks, the identification of line faults mainly focuses on fiber optic losses, line faults, etc., and analyzes the status of OPPC lines. Test requests are sent to remote control units with automatic monitoring systems to complete real-time monitoring and target positioning.
In machine learning algorithms, the representation of linear SVMs in hyperplanes can be viewed as a multi class problem with multiple data points [18]. The specific expression form and its classifier are shown in Equation (12).
| (12) |
In Equation (12), represents the normal vector of the hyperplane, represents the data point position of the hyperplane, where is the dimensional real vector, represents the intercept value of the hyperplane, and is the linear classifier. In addition, the feedforward neural network of Multi-Layer Perceptron (MLP) can be trained using backpropagation method, and the spatial function expression is shown in Equation (13).
| (13) |
In Equation (13), represents the dimensional instance eigenvector, and is the intercept of the function. After obtaining the weighted sum result, the activation function used is shown in Equation (14).
| (14) |
In Equation (14), represents the type of activation function, and is an exponential function. In addition, the expression of a single perceptron is shown in Equation (15).
| (15) |
In Equation (15), represents the output value of the input spatial point, and . MLPs can obtain deeper and more complex input-output relationship models, providing a good application foundation for fault classification and automatic monitoring systems.
In the GIS fault location system, data from electronic maps and fiber optic cable networks are combined and stored in the system’s data center. Then, 3D modeling is used to input measurement points of fiber optic cable lines, to organize and store models of positioning monitoring points. In addition, by combining the analysis of the impact and curve characteristics of extreme temperature changes on optical cable lines, the status and leakage fault process of OPPC lines can be effectively monitored, which can also improve the accuracy and feasibility of monitoring performance to a certain extent.
3 Results
Based on the OPPC fiber optic cable results and the construction of an online monitoring system, monitoring and analysis of environmental temperature changes, line status, and fault modes were conducted to verify the feasibility of the proposed research method.
3.1 Analysis of Temperature Influencing Factors of OPPC Spliced Optoelectronic Composite Cable
According to the application requirements of OPPC spliced optoelectronic composite cables in power systems, and combined with the structure of optical cables and their relationship with temperature, the temperature field of the ice-covered section of OPPCs was studied. Meteorological environment parameters were set in the simulation experiment, where the length and thickness of the ice-covered section were 1 m and 10 mm respectively, and the working time of OPPC was 5 h. To reduce external intervention and eliminate the influence of wind speed, the initial temperature during the rising period was 7.5 C, while the initial temperature during the falling period was 0C, and it continued to rise or fall at a rate of 1.5C/h. In addition, the current conduction heat generated by OPPCs could also affect their temperature changes. In the temperature field simulation, the current of 552 A connected to the optical cable was set to obtain the change in unit temperature difference of the optical fiber, as shown in Figure 5.
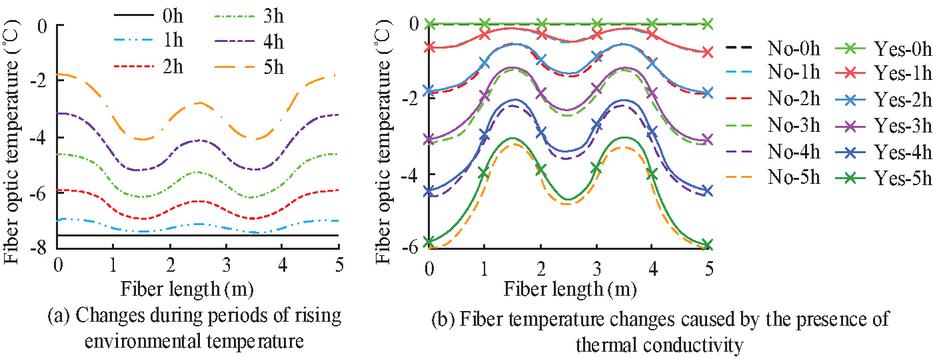
Figure 5 Results of temperature changes in fiber optic conductors during the period of environmental temperature rise.
Figure 5 illustrates the temperature response characteristics of the OPPC cable under different environmental conditions. As shown in Figure 5(a), the overall cable temperature increases with rising ambient temperature, with the most significant temperature rise observed between 2 m and 3.5 m. At the third hour, the temperature in this section increased by up to 3.8C, indicating a strong influence from conductive heating. Figure 5(b) compares temperature distributions with and without thermal conductivity (where “No-xh” represents the condition without thermal conduction and “Yes-xh” represents the condition with thermal conduction). The results show that all Yes-xh curves are higher than their corresponding No-xh curves in the middle section, with a maximum temperature difference of 3.1C at the fifth hour and approximately 2.7C at the third hour. This difference is concentrated in the middle region, which is defined in this study as the “current conduction temperature field.” As time progresses, the effect of cumulative conductive heating becomes increasingly evident, with a more pronounced temperature peak in the midsection. Together, Figures 5(a) and 5(b) confirm the significant impact of thermal conduction on local cable temperature fields, providing a basis for subsequent state sensing and fault localization.
Afterwards, considering the influence of wind speed on the temperature changes of OPPCs, the study used an initial ambient temperature of 0C and gradually decreased it at 1.5C/h. In the simulation, six wind speed values were selected for real-time monitoring of the temperature status of OPPCs. The result is shown in Figure 6.
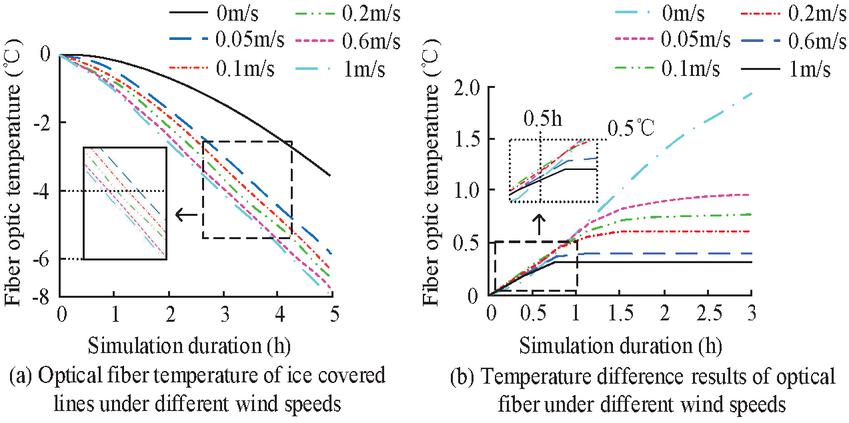
Figure 6 Results of the relationship between different wind speeds and fiber temperature.
From Figure 6(a), as the wind speed increased, the temperature of the optical fiber in the ice-covered section rapidly decreased, and the temperature dropped rapidly in the simulation after the third hour. In Figure 6(b), the temperature difference between the ice-covered line section and other line sections was statistically analyzed. When the wind speed exceeded 0.05 m/s0.6 m/s, the temperature difference of the optical fiber remained stable after 3 hours. Before stabilizing, as the wind speed increased, the temperature difference gradually expanded, indicating that the influence of wind speed on the temperature state of OPPCs was more significant.
3.2 Monitoring and Analysis of the State of OPPC Spliced Optoelectronic Composite Cable Line
Based on the analysis of OPPC fiber optic cable temperature and wind speed conditions, the study simulated and analyzed the environmental temperature, wind speed, and ice thickness simultaneously, and concluded that OPPC fiber optic cable lines meet the conditions of thermal equilibrium. The results are shown in Figure 7.
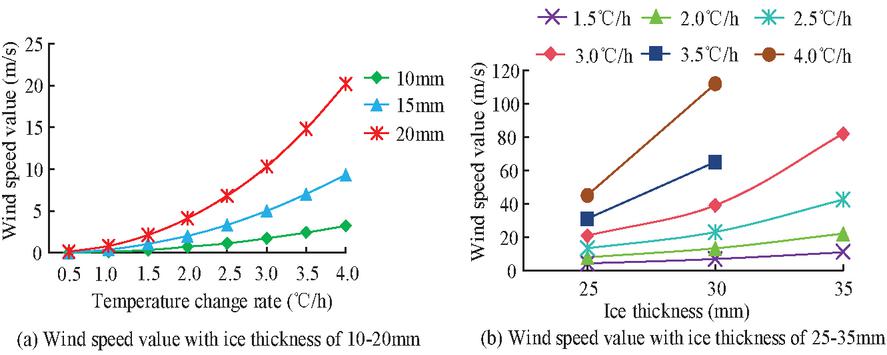
Figure 7 Wind speed results with different temperature change rates and ice thickness.
From Figure 7(a), as the temperature gradually increased, the wind speed value also continuously increased, and the larger the ice thickness, the higher the wind speed value. Wind speeds above 20 m/s had strong destructive power. When the ice thickness was 15 mm, the maximum wind speed value for a temperature change rate of 4C/h was 9.32 m/s. In Figure 7(b), at a temperature change rate of 2.5C/h, the wind speed value for a 30 mm ice thickness was 23.01 m/s, while at a temperature change rate of 3.0C/h, the wind speed value for a 25 mm ice thickness was 20.82 m/s. The comprehensive results indicated that temperature changes, ice thickness, and wind speed had a significant impact on the thermal balance of OPPC lines. Online monitoring of their status required calculation of the influencing factors to obtain the status results of OPPC spliced optoelectronic composite cables.
In the analysis of factors affecting the temperature state of OPPCs, the study combined the simulation state of optical cable operation to test the amplitude of environmental temperature fluctuations, to obtain the lag phase and expected error of temperature changes in optical cable lines. The results are shown in Figure 8.
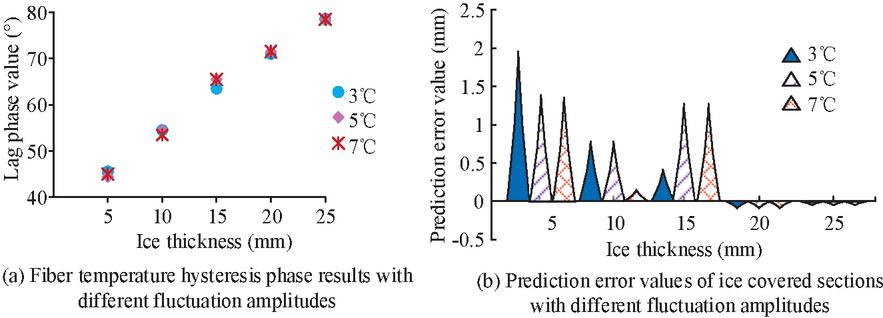
Figure 8 Prediction results of optical cable state under different environmental temperature fluctuation amplitudes.
From Figure 8(a), the hysteresis phase difference of different environmental temperature fluctuation amplitudes was relatively small at the same thickness. Among them, the temperature hysteresis phases of the three fluctuation amplitudes at a thickness of 20 mm were 71C, 71.5C, and 71.5C, respectively. The temperature hysteresis phase results at a thickness of 15 mm were 63.5C, 65.5C, and 65.5C, with a maximum difference of 2C. In Figure 8(b), it is found that the prediction error for thicknesses ranging from 5 mm to 15 mm was relatively high. But when the ice thickness was 5 mm, the thickness prediction errors under the three fluctuation amplitudes were 1.9409 mm, 1.3849 mm, and 1.3849 mm, respectively, with a maximum value not exceeding 2 mm. Therefore, it indicated that the prediction error accuracy was high, proving the feasibility and practicality of monitoring the status of OPPC lines.
3.3 Monitoring and Analysis of Leakage Faults in OPPC Spliced Optoelectronic Composite Cables
In the process of building the OPPC line fault identification and location system, the GIS module and map processing station input the location and abnormal data of monitoring points to achieve remote monitoring and fault analysis. The three-dimensional geographic information modeling of the fiber optic cable network provided a more accurate display of the location of line faults. The input of optical cable information in GIS servers and their data storage helped to improve the attribute display and accuracy of subsequent 3D modeling, as shown in Table 1.
Table 1 Attribute information of OPPC
| Name | Column Identification | Data Type | Explanation |
| Fiber optic cable ID | ID | Int | Unique identifier for each fiber optic cable |
| Fiber optic cable name | Name | Varchar | Name assigned to the fiber optic cable |
| Number of fiber cores | FiberNum | Int | Default: 0 (not specified) |
| Refractive index | Reflectance | Float | Default: 0.0, defines the optical reflectance index |
| Starting point ID | StartDotID | Int | Based on point graph structure |
| Termination point ID | EndDotID | ||
| Starting point type | StartDotType | 0 Unknown (default), 1 Bureau, 2 Person well, 3 Standard stones | |
| Termination point type | EndDotType |
Table 1 defines the identification information, physical characteristics, and connection attributes of OPPC photoelectric composite cables, which are used for data management of GIS monitoring system. The ID and name of the optical fiber cable identify each optical cable. The number of cores and refractive index of the fiber record its optical characteristics. The ID of the start point and the end point determine the connection position of the optical cable. The start and end point types are classified 0–3, representing different installation environments (unknown, substation, well, standard stone) to support remote monitoring and fault detection.
From Table 1, the OPPC information, after 3D modeling, was used for data entry and system analysis. The information was identified by columns and data storage types to obtain the attribute information of the experimental optical cable. Afterwards, by combining the information input from the server and power station, corresponding error correction values were set to improve the positioning accuracy of fault monitoring points. At the same time, the fault monitoring system had different degrees of prediction models and algorithm training for fault types, identification, and localization. The algorithms widely used for fault recognition and localization models currently included SVM, MLP, and Random Forest (RF) classification algorithms. Before the experiment of simulating online monitoring of optical cable status, an 80-node topology network was used to simulate the operation of the optical cable network, and 300000 data were collected to train a fault classifier for optical cable line interruption, in order to evaluate the performance of different algorithms. Therefore, testing was conducted on the lightweight network simulation platform, Mininet, and the results are shown in Figure 9.
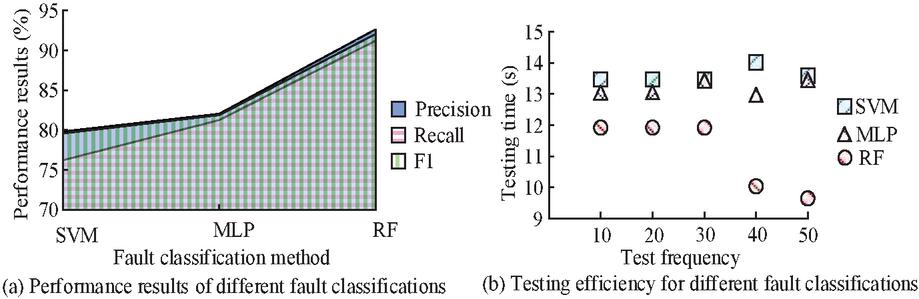
Figure 9 Comparison results of fault classification using different algorithms.
From Figure 9(a), the performance of the SVN algorithm was significantly lower than that of other algorithms, with MLP having an accuracy of 82.03% and a recall rate of 81.26%. The accuracy of the RF algorithm was 10.61% higher than that of the MLP algorithm. In Figure 9(b), the time experienced by different algorithms in the process of fault location and recognition was obtained. Among them, the MLP algorithm obtained a time of 13.43 s after 30 tests, while the SVM algorithm obtained a time of 13.46 s. During 50 tests, the running efficiencies of the three algorithms were 13.58 s, 13.46 s, and 9.65 s, respectively. Therefore, it demonstrated the superiority of RF algorithm in fault location and recognition, and provided better application effects for online monitoring.
Afterwards, in the leakage fault monitoring system of OPPC spliced composite optical cables, the remote operation platform displayed the environmental location and signal frequency, providing intuitive monitoring results for the detection system client. According to the fault simulation platform, the frequency diagram of OPPC signal at the time of fault occurrence is shown in Figure 10.
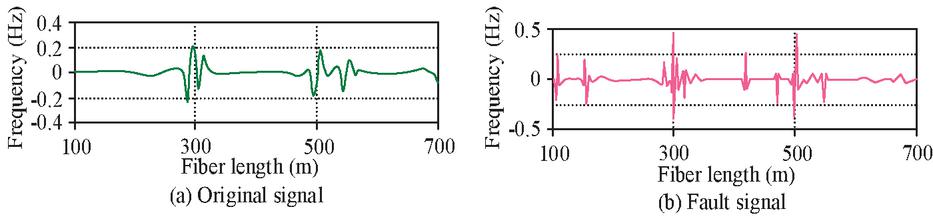
Figure 10 Comparison results of OPPC fiber optic cable simulated signals.
From Figure 10(a), the GIS-based fault monitoring system had a relatively smooth simulation curve for normal signals, and the frequency fluctuated between 0.2 Hz and 0.2 Hz, with relatively low fluctuation frequency. In Figure 10(b), the simulated fault signal fluctuated greatly on the monitoring platform, with a higher frequency than the normal signal. The frequency range of the fault signal occurrence was between 0.5 Hz and 0.5 Hz. Therefore, it proved that the monitoring of signal frequency by the system was feasible and accurate. However, in the leakage circuit of fault types, the results of the system’s simulation platform testing are shown in Table 2.
Table 2 Online monitoring results of OPPC leakage
| Test Frequency (Hz) | Detection Accuracy (%) | Test Time (s) | Positioning Error (m) |
| 10 | 92.76 | 0.12 | 2.4 |
| 15 | 92.53 | 0.13 | 2.2 |
| 20 | 94.31 | 0.26 | 4.3 |
| 25 | 95.42 | 0.34 | 5.4 |
| 30 | 96.49 | 0.15 | 4.6 |
| 35 | 98.56 | 0.19 | 3.4 |
| 40 | 98.87 | 0.07 | 1.1 |
According to Table 2, the platform test of the online monitoring system for OPPC lines in fixed areas showed an accuracy of over 92% for monitoring leakage faults, with an average reaching 95.56%. Moreover, the time for monitoring abnormal fault signals was less than 1 second, and the positioning error of the faulty line was basically below 5 meters, indicating the superiority and feasibility of the proposed online monitoring system for line leakage testing. To validate the stability and adaptability of the proposed OPPC cable monitoring system under extreme environmental conditions, an environmental simulation experiment was designed and conducted. A programmable environmental test chamber was used to simulate three typical extreme conditions: high temperature (70C, 40% relative humidity), low temperature (30C, 40% relative humidity), and high humidity (25C, 95% relative humidity). Each condition was maintained continuously for 48 hours. An OPPC cable segment equipped with a complete sensing system was placed inside the chamber and connected to the central server and client platform to simulate a real-world deployment scenario. The experimental results are shown in Table 3.
Table 3 System performance under extreme conditions
| Data | Max | Temperature | Model | |
| Integrity | Communication | Measurement | Misjudgment | |
| Condition | (%) | Delay (ms) | Error (C) | Rate (%) |
| G1 (High Temperature) | 99.83 | 87.2 | 0.48 | 1.1 |
| G2 (Low Temperature) | 99.91 | 72.6 | 0.39 | 0.9 |
| G3 (High Humidity) | 98.67 | 101.4 | 0.61 | 1.4 |
As shown in Table 3, the monitoring system demonstrated stable performance under the three typical extreme environmental conditions. The data integrity rate remained above 98%, and the maximum communication delay was below 110 ms, with no occurrences of continuous disconnection or system reboot. In the high-temperature condition (G1), slight temperature drift was observed in some sensors, but the measurement error was controlled within 0.5C, with a misjudgment rate of 1.1%. Under the low-temperature condition (G2), the system maintained high accuracy with minimal performance fluctuations. The high-humidity environment (G3) had a more noticeable impact on communication stability and temperature acquisition, resulting in a slightly lower data integrity rate and an increased misjudgment rate of 1.4%, though still within an acceptable range. These results indicate that the OPPC cable monitoring system exhibits good environmental adaptability and is capable of long-term operation under complex outdoor climate conditions.
4 Discussion
This study was proposed to analyze the characteristics of the structure and fiber applications of OPPCs for monitoring the status of OPPPC spliced optoelectronic composite cables. Moreover, the environmental temperature changes of OPPC fiber optic cables were used to express the information transmission of the fiber optic network. BOTDA distributed sensing technology was used to measure and transmit signal information of the environmental temperature information under icing conditions, providing data information of OPPC fiber optic cables uploaded sensing fibers for online monitoring systems to achieve temperature information and sensing signal detection. In addition, in the fault analysis of OPPPC spliced optoelectronic composite cables, GIS servers and their related management units were used to classify and identify the types of faults in Guanlan, which was used for precise positioning and remote control of Xi’an fault monitoring points in map processing stations and 3D coordinate modeling. Therefore, based on the analysis of the above structure and factors, research was conducted on the status and leakage faults of OPPPC spliced optoelectronic composite cables, and an online monitoring system was constructed. In the simulation experiment analysis, machine learning algorithms showed good performance in fault classification. Compared with reference [19], the convolutional neural network used had a classification accuracy of 98.55% for experimental data quality. The RF algorithm and GIS module used in the fault monitoring system in the study achieved the highest testing accuracy of 98.87%, indicating that the online monitoring system proposed by the proposed research was better.
Although this study established a thermodynamic modeling system for OPPC optical cables and integrated a fault identification algorithm based on random forests, achieving good performance under typical working conditions, there are still two limitations. Firstly, this paper does not analyze the performance degradation of optical cables under extreme weather conditions such as long-term high-load operation or repeated ice melting. The main reason lies in the fact that the current experimental platform and data acquisition cycle are limited, making it difficult to construct a real long-term time series operation scenario. In the future, it can be expanded by combining historical monitoring data or building a time-varying performance degradation model. Secondly, the random forest algorithm adopted in this paper has only been trained and tested on the simulation data of a single region and a single type of optical cable, and the generalization ability assessment under multi-region and multi-type optical cable conditions has not yet been carried out. At the current stage, due to the limitations of data acquisition channels and actual deployment, the adaptability of the algorithm in different environments and application scenarios can be enhanced by introducing methods such as transfer learning and federated learning in the future.
5 Conclusion
Due to the improvement of communication technology, research was conducted on the optical fiber application of OPPC spliced optoelectronic composite cables, utilizing their structure, temperature state changes, and sensing technology to transmit optical fiber signal information. Using GIS servers and regional fiber optic cable data collection, a fault online monitoring system was constructed. Through performance analysis and system testing of optical cables, it was found that in the simulation analysis of environmental temperature and line monitoring of OPPPC optical cables, the temperature change rate of 3.0C/h and the wind speed value of 25 mm ice thickness were 20.82 m/s. The temperature hysteresis phases of the three fluctuation amplitudes at a thickness of 20 mm were 71C, 71.5C, and 71.5C, respectively. The prediction errors at a thickness of 5 mm were all less than 2 mm, indicating the feasibility of monitoring the status of OPPC lines. In the fault classification simulation test, the accuracy of the SVM algorithm was 79.84%, the accuracy of the MLP was 82.03%, and the accuracy of the RF algorithm was 92.64% at the highest. Finally, based on the design of the fault classification algorithm and the monitoring system, the maximum monitoring accuracy of the leakage line was 98.87%, and the minimum positioning error was 1.1 m. This proved that the online monitoring method proposed in the study was progressiveness.
References
[1] Zhang L, Lei Y, Luo Y, Tan C, Wen Z., “Application Research of Optical Fiber Sensing Technology in Power Optical Fiber Communication Systems”, Journal of Physics: Conference Series, IOP Publishing, 2023, 2503(1): 12046–12051.
[2] Liu X, Mei X, Luo Y, Lin Y, Lin S, Yang L, Guo D, Liu G., “Structure Optimization for Downlead Cable of 110-kV Insulated Optical-Unit Phase Conductor”, Electrical Engineering, 2024, 21(7): 1–16.
[3] Amiri I S, Rashed A N Z, Yupapin P., “High-Speed Light Sources in High-Speed Optical Passive Local Area Communication Networks”, Journal of Optical Communications, 2023, 44(1): 61–67.
[4] Canudo J, Sevillano P, Iranzo A, Kwik S, Preciado-Garbayo J, Subías J. Simultaneous Structural Monitoring over Optical Ground Wire and Optical Phase Conductor via Chirped-Pulse Phase-Sensitive Optical Time-Domain Reflectometry. Sensors, 2024, 24(22): 7388–7389.
[5] Liu X, Bao Z, Luo H, Chen J, Zhang Z., “Vibration Monitoring of Optical Fiber Composited in Overhead Transmission Line Using -OTDR”, Journal of Physics: Conference Series, IOP Publishing, 2023, 2503(1): 12051–12056.
[6] Ramnarine V, Peesapati V, Djurović S., “Fibre Bragg Grating Sensors for Condition Monitoring of High-Voltage Assets: A Review”, Energies, 2023, 16(18): 6709–6735.
[7] Ouyang X, Zou X, Chen L, Wei Z, Yang L., “Strain Monitoring of Overhead Transmission Line Based on Brillouin Scattering”, Journal of Physics: Conference Series, IOP Publishing, 2023, 2503(1): 12032–12037.
[8] Filipovi-Gri B, Milardi V, Boji S, Jurii B., “Specific Aspects of Overvoltage Protection in Hydro Power Plant Considering AIS and GIS Connection to the Transmission Network”, Electric Power Systems Research, 2023, 218(5): 1–7.
[9] Chen Y, Heredia L C, Smit J, Niasar M, Ross R., “Partial Discharge Detection on Power Equipment Using a Magneto-Resistive Sensor”, International Journal of Electrical Power & Energy Systems, 2023, 152(10): 109270–109280.
[10] Zhan Y, Xu L, Han M, Zhang W, Lin G, Cui X, Li Z, Yang Y., “Multi-Dimensional Feature Extraction Method for Distributed Optical Fiber Sensing Signals”, Journal of Optics, 2023, 53(1): 662–675.
[11] Taheri M R, Mohammadi R, Ghotbi-Maleki M., “Optimal Cable Size Selection in Distribution Network Considering Damage Curve with Variable Fault Clearing Time of Overcurrent Relay”, Electric Power Systems Research, 2023, 225(12): 109812–109824.
[12] Wang F, Dai G, Liu H R H., “Investigation of the Temperature Actions of Bridge Cables Based on Long-Term Measurement and the Gradient Boosted Regression Trees Method”, Sensors (Basel, Switzerland), 2023, 23(12): 5675–5702.
[13] Dawson L, Knight A M., “Investigating the Impact of a Dynamic Thermal Rating on Wind Farm Integration”, IET Generation, Transmission & Distribution, 2023, 17(10): 2449–2457.
[14] Kwon Y S, Oh S G, Seo D C, Min Y J, Kwon I B., “Investigation of Hysteresis in the Temperature Response of Metal-Coated Optical Fibers”, IEEE Sensors Journal, 2023, 23(23): 28954–28959.
[15] Xia M, Tang X, Wang Y, Li C, Zhang Y, Jiang J, Dong T, Zhang Y., “OPGW Positioning and Early Warning Method Based on a Brillouin Distributed Optical Fiber Sensor and Machine Learning”, Applied Optics, 2023, 62(6): 1557–1566.
[16] Vallifuoco R, Catalano E, Zeni L M A., “Hotspot Detection by Phase-Modulated Pump-Based Brillouin Scattering”, IEEE Photonics Technology Letters, 2024, 36(1): 95–98.
[17] Garamaleki S M, Makouei S., “Study of Vector Bending Sensor in Various Configurations”, Archives of Advanced Engineering Science, 2024, 2(4): 1–7.
[18] Ganaie M A, Anuradha K, Malik A K T M., “EEG Signal Classification Using Improved Intuitionistic Fuzzy Twin Support Vector Machines”, Neural Computing & Applications, 2024, 36(1): 163–179.
[19] Zhirnov A A, Chesnokov G Y, Stepanov K V, Gritsenko T V, Khan R I, Koshelev K I, Chernutsky A O, Svelto C, Pnev A B, Valba O., “Fiber-Optic Telecommunication Network Wells Monitoring by Phase-Sensitive Optical Time-Domain Reflectometer with Disturbance Recognition”, Sensors, 2023, 23(10): 4978–4993.
Biographies

Bing Hu, February 1978, native of Xiaogan, Hubei Province. He graduated from in Computer Science and Technology from The Open University of China (2021). 1997–Present Employed at State Grid Xiaogan Power Supply Company, specializing in power communication operation/maintenance and R&D, with 28 years of industry experience. Research Fields: Optical fiber communication technology for power systems, innovation in power communication operation and maintenance. He has published 5 academic papers; Obtained 6 Chinese Utility Model Patents as primary inventor. Led QC (Quality Control) achievements: 3 national awards, 5 provincial awards. Certified as Municipal-Level Technical Expert by Xiaogan Power Supply Company (2016).

Fangya Li, October 1972, Female, Ye County, Henan Province, Han; 2001: Major in Computer Science, Wuhan University; 1989–1992: Served in the army, 1993–Present: Deputy Director of Key Laboratory (Level 3 Staff), Xiaogan Power Supply Company, State Grid Hubei Electric Power Co., Ltd. Current her research direction is communication innovation and scientific and technological management. She has Published academic papers 12 articles, Participated in compiling and issuing group standards 2 items, Scientific research projects 15 projects, Authorized patents 55 patents, Academic awards 12 awards.

Wanyi Huang, May 8, 2000, Female, Xiaogan, Hubei Province, Han. 2022 Bachelor’s Degree in Power Engineering and Its Automation, Hubei University of Technology, 2025 Master’s Degree in Electrical Engineering and Its Automation, Hubei University of Technology; Research Direction is Power System. She has published 2 papers published in Peking University Core Journals.

Bin Huang, November 1971, Male, Hanchuan, Hubei Province, Han. 1993 Bachelor’s Degree in Electrical Technology, Gezhouba Hydropower Engineering College, 2002 Degree in Computer Information Management, Zhongnan University of Economics and Law; 1993–2006: Director of Transmission and Transformation Work Area, Section Chief of Production Technology Section, Xiaogan Xiaochang County Power Supply Company, 2006–2018: Deputy Director, Director of Office, State Grid Xiaogan Power Supply Company, 2018–2023: General Manager, State Grid Xiaonan District Power Supply Company, Xiaogan, 2023–2024: Director, General Manager of Digital Work Department (Information and Communication Branch, Data Center), State Grid Xiaogan Power Supply Company, 2024–Present: Safety Director, Deputy Chief Engineer, State Grid Xiaogan Power Supply Company.
Distributed Generation & Alternative Energy Journal, Vol. 40_5&6, 1157–1182.
doi: 10.13052/dgaej2156-3306.405610
© 2025 River Publishers