Economic Load Forecasting of Power System Based on Hybrid Neural Network and Multi-objective Evolutionary Algorithm
Zhixin Wang, Yougang Ren*, Yuting Liang, Chong Wang and Cuizhi Tong
State Grid Jibei Electric Power Company Limited Smart Distribution Network Center, Qinhuangdao, 066100, China
E-mail: YougangRen@outlook.com
*Corresponding Author
Received 08 July 2025; Accepted 10 September 2025
Abstract
The accuracy and efficiency of power load forecasting are essential to the power grid’s stability and economic operation due to the ongoing growth of the power system scale and the widespread use of renewable energy. Traditional load forecasting methods are often difficult to balance the forecasting accuracy, economy, and environmental protection. Therefore, the study first combines wide deep neural network with temporal convolutional network to better extract the spatial features and temporal dependencies of load power data. Subsequently, the economic dispatch function under multi-objective is constructed and the function model is solved taking into account the generation cost, pollution emission and voltage deviation. The results indicate that the hybrid neural network has good convergence and loss results, with its loss value approaching 0 in the later stages of iteration. K-means clustering-support vector machines (K-means-SVM) and Improved Whale Optimization Algorithm-Long Short-Term Memory (IWOA-LSTM) are significantly affected by the number of sample points, and their minimum load power prediction error is greater than 0.5%. The training time of the hybrid model is always less than 0.2 seconds, and the maximum prediction accuracy exceeds 95%. The multi-objective evolutionary algorithm proposed in the study exhibits good solution set diversity and convergence. The average running time of the improved Multi-objective Evolutionary Algorithm based on Decomposition (MOEA/D) algorithm does not exceed 105 seconds, and the maximum electricity cost does not exceed 2.5 10 yuan. The research method provides a new solution for economic load forecasting of the power system, which provides a guarantee for its safe and stable operation.
Keywords: Wind energy, power systems, economic dispatch, neural networks, forecasting models, multi-objective evolutionary algorithms, distributional diversity.
1 Introduction
The percentage of intermittent power sources, such as wind power, in the power system (PS) has been rising as a result of the global energy structure changing and the quick development of renewable energy (RE). Maintaining the sustainable development of energy has become the primary concern goal of current national development [1]. However, wind power generation has a large degree of randomness and volatility, and wind energy resources are affected by a variety of factors and the performance of the uncertainty is more obvious. As a result, it poses significant difficulties for the PS’s reliable and safe operation following grid connection. Wind turbines cannot provide inertia response like synchronous generators, making it easier to lead to system inertia reduction, increasing the system peak pressure, triggering voltage stability problems. Therefore, a crucial component of ensuring the PS operates safely and economically is precise power load prediction. It is crucial for increasing wind power consumption capacity, allocating resources as efficiently as possible, and delivering the PS’s economic cost [2, 3]. Regarding the problem of power load forecasting and scheduling, many scholars have also put forward their own opinions. Among them, Jing J et al. proposed a power load forecasting model based on residual connection bidirectional long short-term memory attention mechanism (RBiLSTM AM), and proposed using particle swarm optimization for scheduling optimization. This model utilizes Bidirectional Long Short-Term Memory (BiLSTM) to capture temporal dependencies and enhances the weights of critical time steps through attention mechanisms. The results showed that the prediction accuracy of this method reached 96.68%, and the error index was significantly better than the comparison model, effectively reducing economic costs [4]. Osgonbaatar et al. proposed a power consumption prediction method based on rank coefficient and decision tree set, and applied it to node load management in the central power system. By integrating meteorological, calendar, and historical load data, the model achieved a prediction error probability of 1.25% [5]. Saglam et al. found that artificial neural networks and gold rush optimizers exhibit small statistical errors and can effectively predict peak loads for the problem of instantaneous power peak load prediction [6]. Zhang X et al. designed a hybrid sequence convolutional neural network and long short-term memory model for long-term monthly peak load prediction. The results showed that this method exhibited better prediction accuracy on data than existing methods, providing more reliable decision support for power grid expansion strategies [7]. Currently, domestic scholars mainly focus on the synergy between short-term load forecasting and economic dispatch in power forecasting and dispatch, such as using particle swarm optimization algorithm, long short-term memory network, etc. to achieve dispatch forecasting. However, its multi-objective collaborative optimization ability still needs to be improved, and there is no in-depth exploration of how the prediction results can be dynamically fed back to dispatch decisions. Foreign scholars tend to prefer multi-objective dynamic scheduling and high-dimensional data fusion, but they have not considered the integrated scheduling strategy of power systems, and the scheduling objectives involved are relatively few.
There is still insufficient coupling between prediction and scheduling in current research. Most studies treat prediction and scheduling as independent modules connected in series, lacking real-time feedback mechanisms and making it difficult to cope with the instantaneous fluctuations of high proportion renewable energy. Moreover, there are limitations in multi-objective collaborative optimization capabilities and uncertainty management, which rely heavily on scenario generation and robust optimization, have high computational complexity, and have weak modeling capabilities for uncertain factors. Economic Load Forecasting (ELF) is a joint optimization method that integrates load curve forecasting and economic dispatch planning. Its core content includes extracting the spatiotemporal characteristics of load data, generating high-precision short-term/long-term load curves to quantify the impact of uncertain factors, and guiding based on certain dispatch strategies. There are many output objectives included in economic load forecasting, including economic objectives (such as optimizing fuel costs, energy storage charging and discharging strategies), environmental objectives (reducing carbon emissions), and safety objectives (ensuring system inertia support and voltage stability, reducing wind power fluctuations). Traditional PS load forecasting mostly relies on historical data and empirical models, which cannot cope with the uncertainty caused by the fluctuation of wind power output. The static economic dispatch (ED) method and the single time period problem solving idea are no longer applicable to the complex and changing grid load dispatch scenarios [8]. Statistical-based prediction models have limited ability to fit nonlinear relationships, while artificial intelligence-based prediction models face problems such as poor handling of multi-objective problems. Thus, to balance the prediction accuracy (PA) and model complexity, the study proposes a combination of hybrid neural networks and multi-objective evolutionary (MODE) algorithms for ELF ideas of PSs. This study uses hybrid neural network to obtain multi-feature information of load data and improve the PA. It also designs a multi-objective optimization model based on the consideration of generation cost as well as multi-dimensional ED problem. Moreover, an attempt is made to solve it with the help of improved MODE algorithm for better realization of dynamic ED study of PS. This study combines hybrid neural network and MODE algorithm, which improves the adaptability to wind power output fluctuation. Additionally, it successfully enhances the PA and model generalization capabilities, which can offer substantial assistance for the PS’s safe and cost-effective operation. The innovation of the research is reflected in two aspects. One is the combination of neural network and multi-objective solving algorithm, which takes into account the lack of distribution of the dispatch model while improving the PA. The second is the setting of an ED model under multi-objective, which takes into account the effects of generation cost, gas emission and voltage deviation on the function.
1.1 Related Works
Power load forecasting is related to the efficiency of grid demand-side management and the stability of the power market, and is a key link that affects the safe operation of the PS. Dong X et al. suggested using support vector machines and the k-mean clustering approach to achieve short-term power load forecasting. According to the data, the method significantly reduced the operating time and increased the PA by over 35% when compared to the traditional method [9]. Zhuang Z et al. on the other hand, proposed to decompose and reconstruct the power load signal in consideration of the short-term load prediction error problem. The PA of the long short-term memory model was also improved with the help of improved whale optimization algorithm-long short-term memory (IWOA-LSTM). The results indicated that the method had better PA and anti-interference [10]. Guo Y et al. proposed the joint bidirectional long and short-term memory and multi-task learning idea to realize load prediction. The outcomes demonstrated that the load prediction model had a high PA and could share the coupling information [11]. Facing the problem of multi-energy load forecasting, Zhuang W et al. proposed to realize feature information extraction by multi-scale spatio-temporal graph neural network. The results indicated that the method had better generalization ability and robustness [12]. Wang Y et al. attempted to reconstruct electric power features with the help of time-series convolutional network, and also introduced optical gradient lifter to realize industrial load forecasting. The method’s effectiveness in composite prediction across several datasets was demonstrated by the results [13]. Wind turbine output power (OP) is the key to ensure the stable operation of power generation system. Therefore, Yang H et al. realized the processing of power data series with the help of integrated decomposition idea and adaptive noise reduction, and jointly predicted the OP by Temporal Convolutional Network (TCN). The results indicated that the prediction error of the composite model was reduced by more than 10% [14]. Wang L et al. proposed integrated design ideas to achieve power load forecasting, including mapping through meteorological data, power composite decomposition, optimization of key parameters, and component prediction. The results indicated that the model exhibited higher PA and could effectively consider the load constraints [15].
The uncontrollability of renewable power output and the volatility of power demand puts great pressure on the power balance and frequency stabilization of the PS, which further increases the operational difficulty of the PS. Ajagekar A et al. proposed to realize power day-ahead dispatch with the help of deep reinforcement method. The outcomes demonstrated how well this strategy worked to lower operational and load penalty costs [16]. Conversely, Hassan M. H. attempted to use the White Shark Optimizer to address PS’s aggressive load dispatch issue. According to the results, the approach was more effective than existing meta-heuristic algorithms and used less gasoline [17]. Wang L et al. designed an ED model for power under the dual objectives of considering minimum economic cost and pollution emission and solved it with the help of multi-objective artificial bee colony algorithm. The results showed that the model exhibited low economic cost in PSs [18]. Khan M et al. proposed to solve the economic load dispatch (ELD) problem for wind turbines with the help of genetic algorithm. The results showed that the method could minimize the fuel cost while meeting the power supply requirements [19]. Shafiee M et al. proposed to solve the uncertain ELD problem of PS with the help of dynamic differential annealing optimization (DDAO) algorithm. The outcomes showed that the method improved the dispatch accuracy and convergence speed over the conventional optimization algorithm [20]. Hao W K et al. solved the generation ELD problem with the help of improved arithmetic optimization algorithm. The findings demonstrated that the technique was successful in lowering transmission losses and improving the global search capabilities [21]. Acharya S et al. proposed ED of PS with the help of multi-objective multivariate optimization (MOMO) considering energy cost and emission problems. The findings demonstrated that this approach was successful in lowering both the economic and overall cost of generation [22].
In summary, for the power load forecasting problem, most scholars try to combine traditional machine learning with optimization algorithms, or with the help of deep learning models, multi-objective optimization, decomposition techniques and so on. These techniques produce superior prediction results, but they have drawbacks like significant computer resource consumption and evident data reliance, as well as challenges in striking a balance between model complexity and computational efficiency. Moreover, when most scholars solve the ED problem of PS with the help of multi-objective optimization, it is difficult to comprehensively consider multiple constraints such as economy, environmental protection and stability. Therefore, the study proposes to combine hybrid neural network and MODE algorithm to improve the above deficiencies. It can accomplish multi-objective global optimization and efficiently extract the spatiotemporal features of the load data. This provides a more efficient and comprehensive solution for the stable operation of PSs.
2 Hybrid Neural Network Combined with Multi-objective Algorithm for Economic Load Design of PSs
2.1 Electric Power Data Processing and Load Forecasting Based on Hybrid Neural Modeling
Power prediction is an important content of grid optimization dispatch. The fluctuation of power output can cause impacts on the frequency and voltage of the PS. Among them, wind power is more obviously affected by wind speed, air density, topography, barometric pressure, seasonal time and other factors, which leads to a greater difficulty in its prediction. Disregarding the traditional method of selecting data with the help of manual selection, the study tries to introduce wide deep neural network (WDNN) for power prediction in order to better learn the linear and nonlinear relationships between features and to improve the feature extraction ability and generalization ability. WDNN is a linear function model jointly constructed by width neural network and deep neural network (DNN). Its structural model is shown in Figure 1.
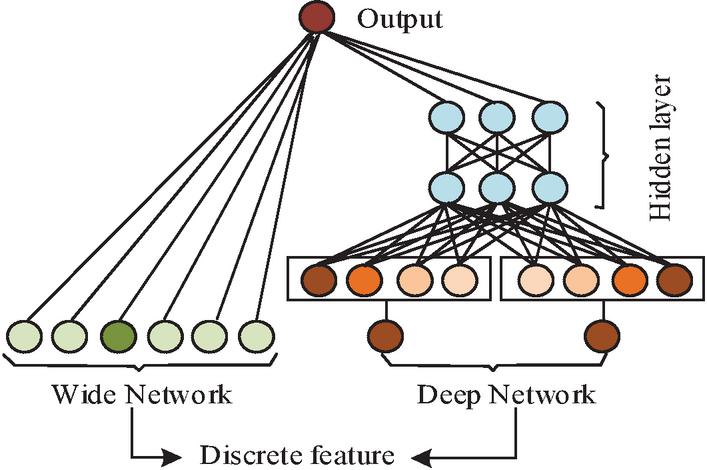
Figure 1 WDNN structure model.
In Figure 1, the width neural network part allows the combination of existing shallow low-order features, raw invariant features, etc. The DNN part performs the embedding process and vector mapping of the input discrete features and computes the features with the help of an intermediate hidden layer [23]. The outputs of the two parts of the network are combined and processed by a single neuron to get the final result. Equation (1) shows the final output of WDNN.
| (1) |
In Equation (1), is the total output of the network; is the sigmoid activation function (AF); is the output result of width network; is the output result of the deep network and is the linear deviation of the joint part of ; is the weight matrix of the joint part. The WDNN is able to learn the complex relationship between wind power and various influencing factors, but may not be able to capture the time series characteristics well. Therefore, to enhance the power data characteristics under different time periods, the study introduces TCN into WDNN. Moreover, its storage space as well as consumption time problem is solved with the help of parallel computing idea. TCN can capture long-term dependencies of time series through causal convolution and dilated convolution. It has the characteristics of causality, parallelism, and dilated convolution, and can effectively learn the periodicity and fluctuation patterns of load/power, capture multi-scale temporal features, and improve prediction accuracy [24]. To avoid the problem of gradient vanishing due to the increase of network depth in TCN, the residual block is designed. Its mathematical expression is shown in Equation (2).
| (2) |
In Equation (2), is the output result of the residual block; is the quantity of layers. denotes represents the input value of the -th identity mapping; denotes the convolution operation; denotes the weight parameter of the convolutional layer in the residual block. The study proposes a hybrid prediction model (Wide deep neural network-temporal convolutional network, WDNN-TCN) to achieve the improvement of the PA and model generalization ability of the electric power data by considering the characteristics of the wind power data. The WDNN-TCN prediction structure schematic diagram is displayed in Figure 2.
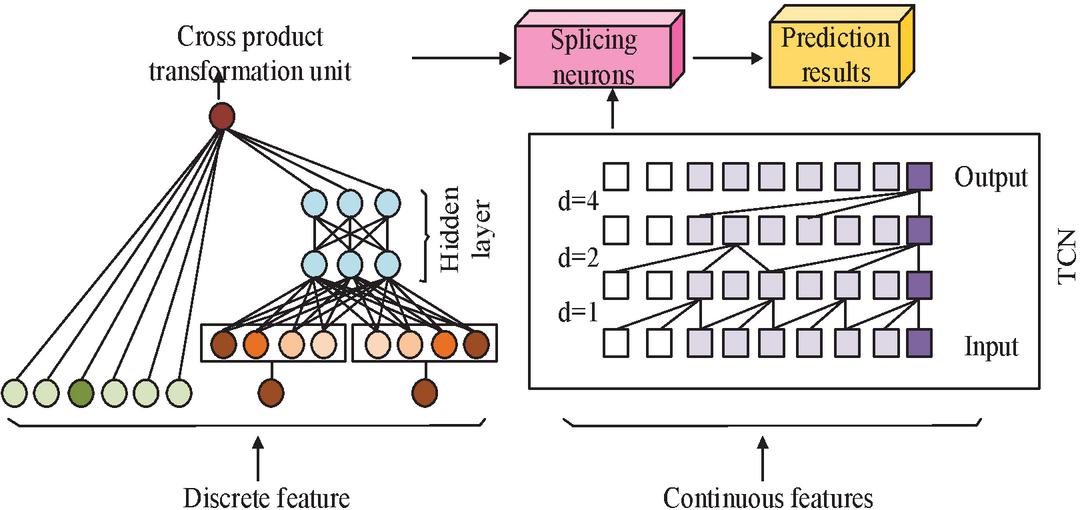
Figure 2 Schematic diagram of the prediction structure of WDNN-TCN.
The WDNN-TCN model can realize the feature extraction capability of remembering long-term historical information, and its features of the processed data are divided into discrete and continuous processing. Among them, WDNN can process the discrete features by cross product transform and TCN processes the continuous features. Finally, splicing neurons are used to output the final prediction findings.
2.2 Dynamic ED of PS Based on Multi-objective Function
The ED of a PS is the allocation of output with the objective of minimizing the generation cost while satisfying its safe operation. The ED model under single objective only considers the minimum fuel cost when designing the objective function (OF). Moreover, the constraints involved in it are relatively simple, which is difficult to meet the increasingly complex operational requirements of modern PSs. The integration of RE into the grid system increases the uncertainty of its operation, and the demand for electricity varies among multiple interests. Therefore, this study designs a multi-OF model considering generation cost, error standby cost, and pollution emission. It is employed to deal with the unpredictability in the PS’s functioning and to achieve its dynamic and ED. Equation (3) is the constructed OF.
| (3) |
In Equation (3), the economic cost consists of the total cost of fuel under the valve point effect , the late cost (including machine maintenance and finance cost) is , and the power error standby cost is . Among them, is the quantity of WTGs. is the first WTG. is the generation cycle. is the moment. is the output forecast. is the late cost factor. is the number of thermal units. is the error standby cost factor. is the amount of thermal unit rising spinning reserve (SR). is the weight of pollutant emission gas. Among them, is the OP of the th thermal power unit (TPU); denotes the emission of thermal unit at zero output, which mainly comes from the starting and stopping process of the generating unit; denotes the linear coefficient of variation of emissions with OP for TPU ; denotes the quadratic coefficient of the variation of the emissions of thermal unit with the output, reflecting the non-linear growth trend of the emissions with the increase of the output; denotes the exponential term coefficient of the variation of the emissions of thermal unit with output, which is usually used to characterize the emissions under high load conditions. It should also be noted that when the input power of the PS is deviated, the voltage of the nodes will also be deviated. Therefore, when designing the OF, the voltage deviation function should also be considered, so that the voltage deviation of the system during operation is as small as possible. Meanwhile, the constraints of the OF are set, including power balance constraints, generating unit output constraints, and load capacity constraints. Specifically, the sum of TPU OP and turbine OP prediction should be equal to the load of the PS. The generating unit output constraint is to be located between the upper and lower ranges of its OP. Equation (4) shows the load capacity constraint case.
| (4) |
In Equation (4), the first column indicates the total positive SR of the thermal unit. The second column represents the total amount of negative rotating reserve of TPUs. Among them, is the positive rotating reserve. is the integrated electricity load. is the positive SR capacity adjustment value under the guaranteed load fluctuation response. is the electric power size of the wind turbine. and are the positive SR capacity adjustment value and negative SR capacity adjustment value in response to wind power fluctuations. is the negative SR capacity. is the maximum generation capacity of the wind farm.
2.3 MODE Algorithm Solution Algorithm Design
In the function solving process, the PS ED problem is studied with the help of MODE algorithm. MODE algorithm can select individuals with the help of enhancement metrics, which calculates and ranks the contribution of individuals at each level. The reference point adaptive strategy can better adaptively adjust the reference points. Considering the problem of insufficient diversity of the solution set of MODE algorithm, the study iteratively processes the non-contributing solutions in the external archive set to obtain the improved MODE algorithm. Figure 3 shows the flow schematic of the improved MODE.
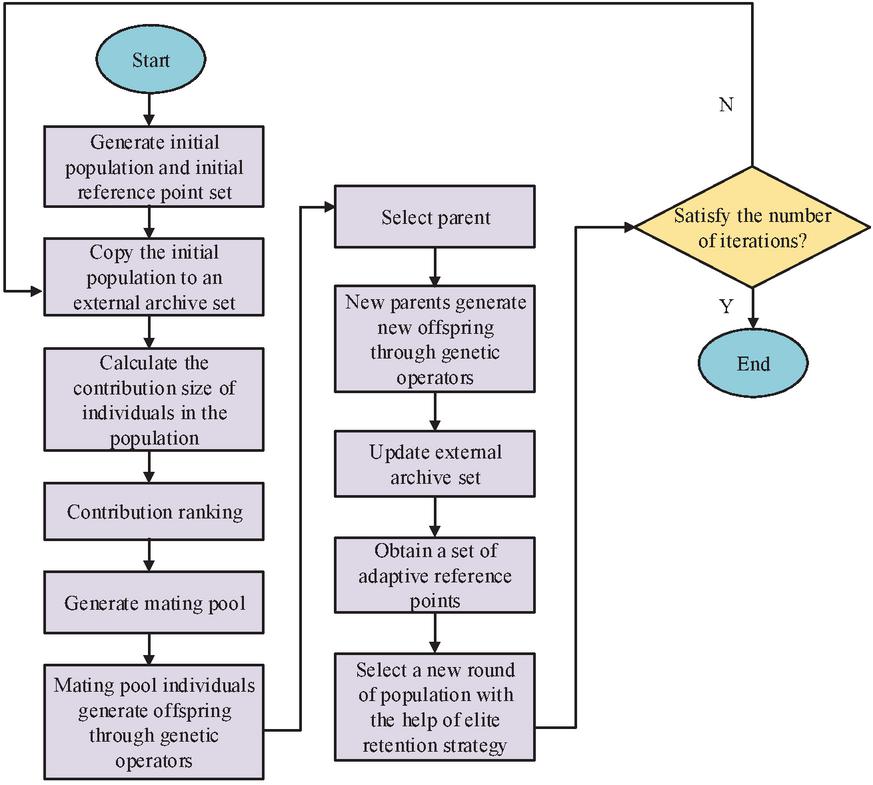
Figure 3 Schematic diagram of the process of improving multi-objective optimization algorithm.
In Figure 3, the improvement of MODE’s updating of the ensemble population and the design of the adaptive reference point set can realize the population stratification by eliminating the solution with the smallest contribution, including the most optimal population individuals. Equation (5) is the constraint processing function of the I-MODE algorithm.
| (5) |
In Equation (5), is the number; denotes the inequality constraint; is the equality constraint; and denote the number of corresponding constraints actively present; , represents the number of inequalities and equations. The improvement step in the I-MODE algorithm is reflected in two ways. The first is the generation of offspring with the help of mating pool population and individual selection with the help of Multi-objective Evolutionary Algorithm (MOEA) algorithm. Two genetic operations allow for population updating. In addition, to address the problem that the basic binary league selection operation in the mating pool selection strategy leads to the same probability of individual selection, the study adopts a selection strategy based on sorting. This strategy sorts and numbers the initial population by contribution and assigns different selection probabilities to each individual to optimize the selection effect. Equation (6) is the formula for assigning probabilities to individuals.
| (6) |
In Equation (6), represents the probability of the individual; represents the ordinal number; represents the probability of the worst individual; represents the probability of the best individual.
3 Effectiveness of ELF for PSs Under Hybrid Algorithms
3.1 Power Load Forecast Results
The experiment used the actual operating data of a wind farm in northern China for the whole year of 2022 as the dataset, which includes meteorological data (wind speed, wind direction, temperature, humidity, air pressure, etc., collected at a frequency of 15 minutes), power data (wind turbine output power, synchronously collected, a total of 9268 sets), and grid load data (real-time load demand of regional power grid). The study used the Siemens S7-1200 PLC system to achieve data synchronization acquisition, equipped with an anemometer (accuracy 0.1 m/s) and a power sensor (accuracy 0.2%). The IEEE 1588 Precision Time Protocol (PTP) was used to ensure a clock synchronization error of less than 1ms for a 15-minute sampling period. Afterwards, the data in the dataset was preprocessed by using wavelet transform to remove high-frequency noise and outliers. Afterwards, normalization method is used to scale the data to the [0, 1] interval, and interpolation is used to compensate for the timing deviation caused by sensor delay. The CPU in the setup experimental hardware environment is IntelXeonGold6248R with 3.0GHz, 24 cores and 48 threads. The GPU is NVIDIATeslaV100 with 32GB video memory and CUDA acceleration. The memory is 128GB DDR4. The software environment is: Ubuntu20.04LTS operating system, PyTorch1.10 deep learning framework. 1TB NVMe SSD is used for high-speed data read and write, and Intel MKL accelerates numerical computation. Simultaneously using NVIDIA NCCL to achieve All Reduce communication for multiple V100 GPUs, with 128GB DDR4 and 1TB Intel Optane persistent memory for intermediate result caching. Use RAPL (Running Average Power Limit) technology to control single node power consumption within 450 W. The number of neurons in the fully connected layer of the research design WDNN-TCN model is set to 64. The hidden layer of the TCN model is three layers, and the quantity of neurons in each layer is 64, 128, and 256. The AF is the ReLU function, the initial expansion coefficients are [1, 2, 4, 8], the learning rate is 0.001, the batch size is 64, the quantity of iterations is 100, and the optimizer is Adam. First, the hybrid prediction model is compared with the DNN and Back Propagation Neural Network (BPNN) for convergence comparison. The results are shown in Figure 4.
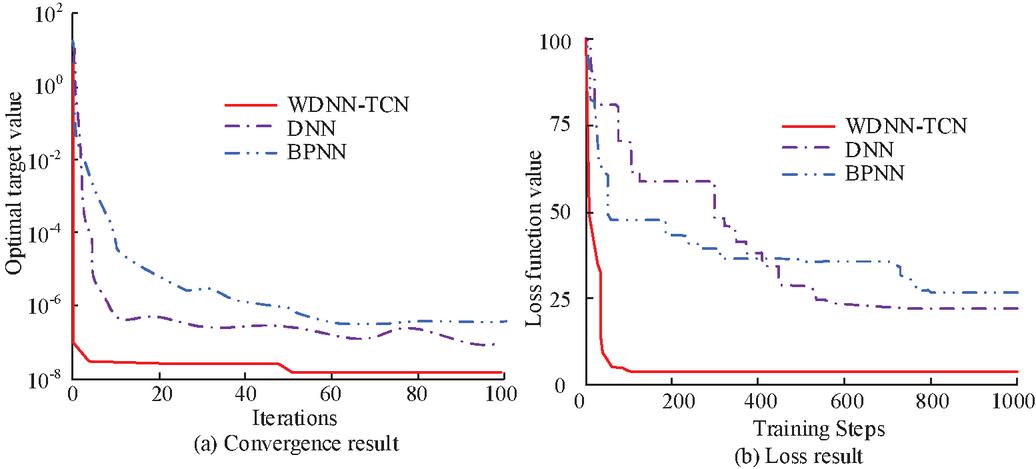
Figure 4 Convergence and loss curves of different algorithms.
In Figure 4(a), the WDNN-TCN algorithm exhibits a smoother convergence curve on the test function, with relatively few turning nodes overall. Its optimal objective value reaches 102.5, while the DNN algorithm and the BPNN algorithm show poorer stability in the late iteration. In Figure 4(b), the loss profile of the WDNN-TCN algorithm is significantly smaller than the other two comparative models. Its value tends to be close to 0 in the late stage and the node fluctuation is small, while the minimum loss value of DNN algorithm and BPNN algorithm is still larger than 25, and the loss performance is poor. After that, the proposed WDNN-TCN algorithm of the study is analyzed for predicting the results. It is also compared with the methods of K-means clustering-support vector machines (K-means-SVM), IWOA-LSTM, and integrated decomposition-temporal convolutional network (ID-TCN). The results are shown in Figure 5.
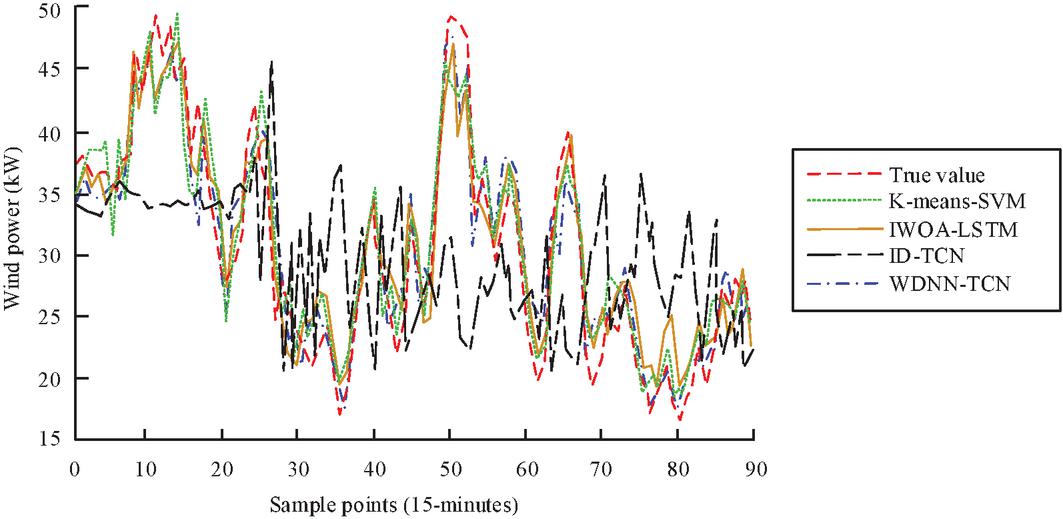
Figure 5 Load power prediction results of different models.
In Figure 5, the WDNN-TCN model has roughly the same curve direction as the true value, with fewer cases of node deviation. In contrast, K-means-SVM and IWOA-LSTM are more significantly affected by the number of sample points, with at least 0.5% node deviation. The nodal ups and downs between the predicted and true values of load power for K-means-SVM and IWOA-LSTM are more obvious. The maximum deviation of the predicted values from the true values of ID-TCN is at least more than 5% and is more obviously disturbed by the sampling situation. Several combination models are further analyzed by prediction index, as shown in Table 1.
Table 1 Prediction index results of combination model
| Model | MAE (MW) | RMSE (MW) | MAPE (%) | Determination Coefficient |
| K-means-SVM | 0.3456 | 0.4322 | 17.34 | 0.978 |
| IWOA-LSTM | 0.3218 | 0.4419 | 18.25 | 0.974 |
| ID-TCN | 0.4803 | 0.5669 | 21.16 | 0.923 |
| Research model | 0.1947 | 0.3847 | 15.23 | 0.992 |
In Table 1, the MAE, RMSE, and MAPE values exhibited by the Research model are 0.1947, 0.3847, and 15.23 respectively, which are much higher than the other three comparative algorithms. Its maximum difference reaches 0.2856 m/s, 0.1822 m/s, and 5.93%. Among them, the ID-TCN model exhibits the largest MAE and MAPE values of 0.4803 m/s and 21.16%, which are poorly predicted. The fitting accuracy of the other three combined models is more than 0.90, but the model proposed in the study is more convergent to 1.0 in the coefficient of determination, which has better PA performance. The results of training time (TT) and prediction accuracy (PA) of the above models are analyzed as shown in Figure 6.
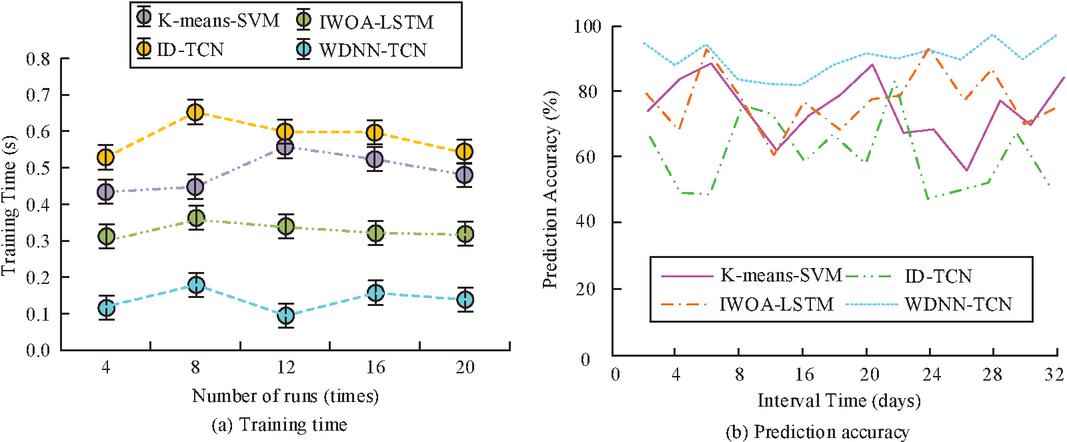
Figure 6 Training time and Prediction Accuracy results of different prediction models.
In Figure 6(a), the TT of the WDNN-TCN algorithm is always less than 0.2 s, while the TT of the K-means-SVM model and the IWOA-LSTM model is always greater than 0.3 s. The maximum value of ID-TCN spends the most TT, and its maximum value is close to 0.6 s and 0.4 s. The TT of ID-TCN spends the most, and its maximum value is close to 0.7 s. to 0.7 s. In Figure 6(b), the PA of the WDNN-TCN algorithm is significantly larger than the other three comparison models. Its maximum value reaches 95.68%, and the overall fluctuation of the curve is small. On the other hand, the other three comparison algorithms show different degrees of ups and downs, and the prediction performance needs to be further improved. To further validate the effectiveness of the research model, it was compared with the Residual Bidirectional Long Short Term Memory with Attention Mechanism (RBiLSTM AM) proposed by Jing J et al. [4], the Hybrid Convolutional Neural Network Long Short Term Memory (CNN-LSTM) proposed by Osgonbaatar T et al. [5], and the Complete Ensemble Empirical Mode Decomposition with Adaptive Noise Soft Thresholding Temporal Convolutional Network proposed by Xiang X et al. [5]. CEEMDAN-SF-TCN [25] and Zheng G The Improved Complete Ensemble Empirical Mode Decomposition with Adaptive Noise Long Short Term Memory Temporal Convolutional Network Bagging (ICEEMDAN-LSTM-TCN Bagging) model proposed by others [26] was used for power load forecasting analysis, and the results are shown in Table 2.
Table 2 Power load forecasting results of different models
| Recall | F1 | RMSE | Cost | Calculate | ||||
| Accuracy | Rate | Score | MAE | MAPE | (%) | Optimization | Time | |
| Model | (%) | (%) | (%) | (kW) | (kW) | (%) | Ratio (%) | (s/epoch) |
| Research model | 96.68 | 90.51 | 91.37 | 123.70 | 104.44 | 5.62 | 12.3 | 0.18 |
| RBiLSTM-AM | 95.12 | 88.73 | 89.45 | 145.82 | 121.36 | 6.84 | 10.1 | 0.35 |
| CNN-LSTM | 93.85 | 86.92 | 87.61 | 158.47 | 132.05 | 7.53 | 8.7 | 0.42 |
| CEEMDAN-SF-TCN | 94.21 | 87.15 | 88.03 | 152.16 | 126.83 | 7.12 | 9.3 | 0.28 |
| ICEEMDAN-LSTM-TCN | 95.67 | 89.24 | 90.11 | 139.75 | 139.75 | 115.62 | 6.21 | 11.0 |
In Table 2, the research model outperforms the comparison model in terms of accuracy (96.68%), RMSE (123.70 kW), and MAPE (5.62%), especially with a 15.2% reduction in RMSE compared to the RBiLSTM AM model, indicating that it is more suitable for high fluctuation load scenarios. The CEEMDAN-SF-TCN model optimizes high-frequency components through signal decomposition, but the fitting ability of low-frequency TCN is insufficient, resulting in a 21.4% higher MAE than the research model. By combining the research model with multi-objective optimization algorithms, the scheduling cost was reduced by 12.3%, significantly higher than other models (such as the hybrid CNN-LSTM model which only has 8.7%). The ICEEMDAN-LSTM-TCN model improves generalization ability through ensemble learning, with a cost optimization ratio of 11.0%, but increases computation time by 72%. The research model, with its parallelized TCN structure, has the fastest training speed (0.18 s/epoch), which is 48.6% faster than the RBiLSTM-AM model, while the ICEEMDAN-LSTM-TCN model has a longer computation time (0.31 s/epoch) due to multi-stage decomposition and integration.
3.2 PS ED Results
The study uses the PlatEMO platform to provide six test problems to test the improved MODE proposed by the study. The tests are set with a population size of 100, iterations of 100 and 300, and the number of targets is M 3. The evaluation metrics are inverted generational distance (IGD) and generational distance (GD). The study runs each test problem independently 20 times and analyzes the mean and standard deviation of the Pareto front results obtained from the algorithm solution. Table 3 illustrates the performance results before and after the improvement of the study algorithm.
Table 3 Performance results before and after algorithm improvement
| MOEA | I-MODE | |||||||
| Algorithm | IGD | GD | IGD | GD | ||||
| UF | Ave | Std Dev | Ave | Std Dev | Ave | Std Dev | Ave | Std Dev |
| 1 | 0.00438 | 0.00039 | 3.44E-04 | 5.64E-05 | 0.00419 | 0.00009 | 3.12E-04 | 3.58E-06 |
| 2 | 0.00683 | 0.00189 | 5.85E-04 | 2.32E-04 | 0.00558 | 0.00132 | 3.18E-04 | 1.68E-04 |
| 3 | 0.00448 | 0.00123 | 3.11E-04 | 9.88E-05 | 0.01441 | 0.05680 | 4.19E-04 | 0.00115 |
| 4 | 0.05844 | 0.00328 | 0.004322 | 0.00208 | 0.05758 | 0.00855 | 0.00275 | 9.62E-04 |
| 5 | 0.18074 | 0.06815 | 0.022778 | 0.01892 | 0.14495 | 0.12140 | 0.01187 | 0.01461 |
| 6 | 0.00591 | 0.00174 | 0.003321 | 0.00115 | 0.00302 | 0.00076 | 5.10E-04 | 2.38E-04 |
In Table 3, the I-MODE algorithm proposed by the study exhibits smaller standard deviation and mean values, except for problem 4. The maximum difference in the mean of the two compared algorithms in terms of IGD metrics values can reach 0.185. On problem 6, the difference in the metrics values between the improved MOEA algorithm and the MOEA algorithm is smaller. The improved algorithm shows better solution set diversity and convergence. Table 4 then displays the comparison of the algorithms’ test times.
Table 4 Testing time before and after algorithm improvement
| Algorithm | MOEA | I-MOEA | ||
| UF | Average value | Standard deviation | Average value | Standard deviation |
| 1 | 96.51870 | 1.10621 | 98.45630 | 0.86708 |
| 2 | 99.06011 | 0.58623 | 99.84844 | 1.11033 |
| 3 | 94.60562 | 1.19667 | 95.02431 | 1.84833 |
| 4 | 98.72792 | 0.83670 | 104.35512 | 1.52675 |
| 5 | 77.82873 | 1.83881 | 78.78395 | 2.41902 |
| 6 | 97.57895 | 1.29666 | 98.65491 | 1.75708 |
In Table 4, the average running time of the I-MOEA/D algorithm is greater than that of the MOEA/D algorithm, but the maximum difference does not exceed 15 s. After that, the ED analysis of the proposed multi-objective algorithm of the study is performed. It is also compared with multi-objective artificial bee colony scheduling (MOABCS), DDAO, and MOMO, as shown in Figure 7.
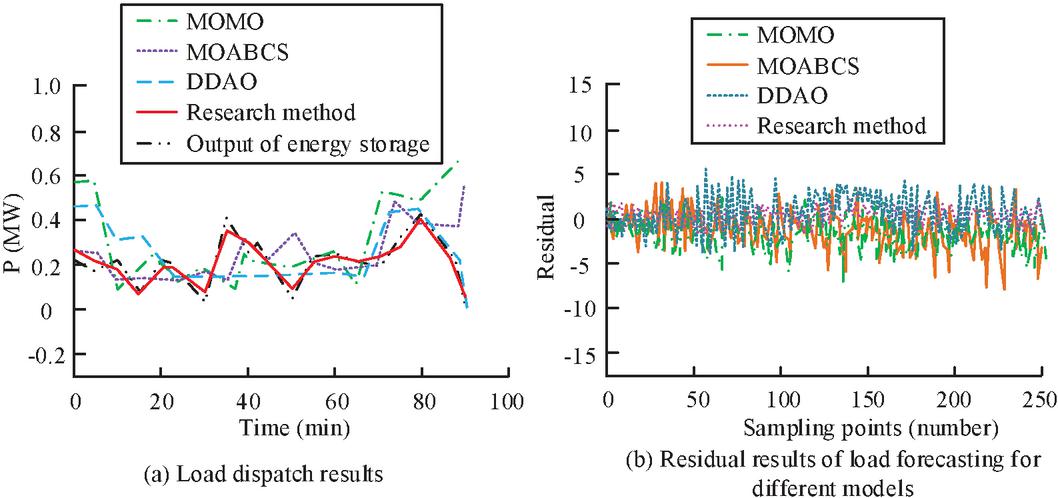
Figure 7 Residual results of power load dispatch and prediction.
In Figure 7(a), the dispatch curve calculated by the hybrid algorithm has a small discrepancy between the dispatch curve and the total energy output result, with a small power loss. The other three comparative algorithms have higher power loss in calculating the dispatch results. The fluctuation of their curves is obvious and there exists a dispatch error of at least 5%. In Figure 7(b), the results of the optimized prediction model proposed by the study are closest to the actual values. In this case, more than 85% of the prediction results are within the range of , while the other models have a larger range of deviation. The results such as economic cost of PS operation are analyzed. The results are shown in Figure 8.
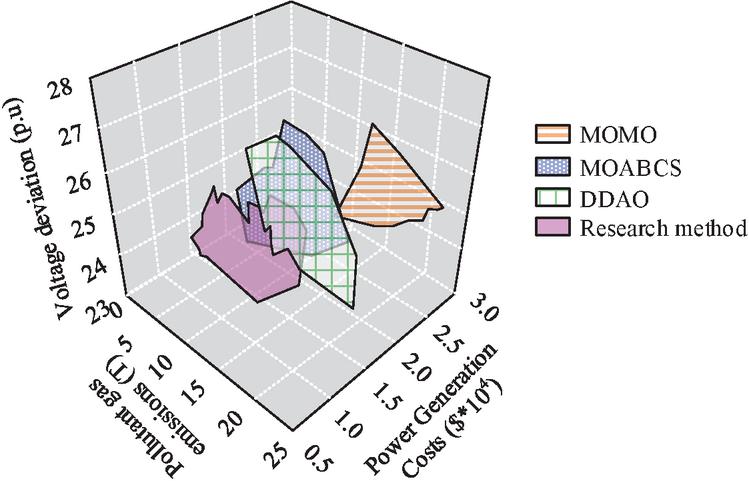
Figure 8 ED processing results of PS.
In Figure 8, the hybrid model proposed in the study has a smaller span of objective values in all three dimensions when dealing with the dynamic ED problem. The overall exhibited gas emissions and generation costs are small, with maximum values not exceeding 15 T and $2.5 10. Whereas the generation costs of the remaining algorithms are controlled, but they exhibit larger values of voltage deviation, and their overall dispatch performance is slightly worse than that of the studied method. Subsequently, Figure 9 illustrates the analysis of the PS’s dispatch prediction error.
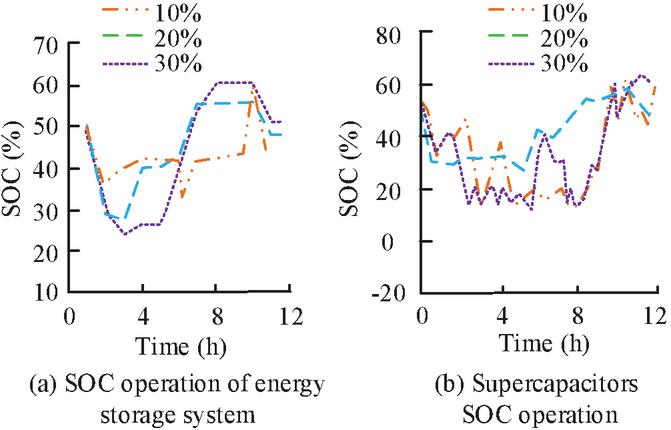
Figure 9 Predictive dispatch results of the PS.
In Figure 9(a), the operating cost of the PS is reduced under the control of the multi-objective optimal dispatch model. The maximum load state value of the energy storage system under different processing prediction errors does not exceed 65%. Moreover, there is a phase change in the operation under different time, and the overall change is smoother. In Figure 9(b), the State of Charge (SOC) change of the capacitor is slightly larger than that of the energy storage system, which can better balance the power of the energy storage system.
4 Conclusion
The study proposed to combine hybrid neural networks with MODE algorithms to present an efficient ELF method for PSs. The experimental results indicated that the WDNN-TCN algorithm exhibited a smoother convergence curve on the test function with an optimal objective value of 102.5, whereas the DNN algorithm and the BPNN algorithm performed poorly in terms of stability in the later iterations. The TT of the WDNN-TCN algorithm was always less than 0.2 s, while the TT of the K-means-SVM and the IWOA-LSTM was always greater than 0.3 s. There were obvious variations in their values under different runs, with the maximum values converging to 0.6 s and 0.4 s. The ID-TCN model took the most time to train, with the maximum value converging to 0.7 s. The improved MOEA algorithm exhibited a small standard deviation and mean in solving the problem, while the two comparison algorithms could reach a maximum difference of 0.185 in the mean of the IGD metrics values. The hybrid algorithm computed dispatch curves with a small variability between the results and the total energy output. The other three comparison algorithms existed with a dispatch error of at least 5%. Furthermore, the hybrid model proposed in the study did not exceed the maximum values of gas emission and power generation cost of 15 T and $2.5 10 when dealing with the dynamic ED problem. Its operating cost was reduced and it could balance the power of the energy storage system better. The method outperformed traditional methods in terms of PA and model robustness, providing strong support for ED and energy management of PSs. It is imperative that future research endeavors prioritize the exploration of more efficient model training methods. This includes distributed computing techniques and model compression techniques. Additionally, the research should focus on expanding the application scope of the model.
References
[1] Wang H, Zhang N, Du E, Yan J, Han S, Liu Y. A comprehensive review for wind, solar, and electrical load forecasting methods. Global Energy Interconnection, 2022, 5(1): 9–30.
[2] Shirzadi N, Nasiri F, El-Bayeh C, Eicker U. Optimal dispatching of renewable energy-based urban microgrids using a deep learning approach for electrical load and wind power forecasting. International Journal of Energy Research, 2022, 46(3): 3173–3188.
[3] Basak S, Dey B, Bhattacharyya B. Uncertainty-based dynamic economic dispatch for diverse load and wind profiles using a novel hybrid algorithm. Environment, Development and Sustainability, 2023, 25(5): 4723–4763.
[4] Jing J, Di H, Wang T, et al. Optimization of power system load forecasting and scheduling based on artificial neural networks. Energy Informatics, 2025, 8(1): 6.
[5] Saglam M, Lv X, Spataru C, et al. Instantaneous electricity peak load forecasting using optimization and machine learning. Energies, 2024, 17(4): 777.
[6] Osgonbaatar T, Matrenin P, Safaraliev M, et al. A rank analysis and ensemble machine learning model for load forecasting in the nodes of the central Mongolian power system. Inventions, 2023, 8(5): 114.
[7] Zhang X, Chau T K, Chow Y H, et al. A novel sequence to sequence data modelling based CNN-LSTM algorithm for three years ahead monthly peak load forecasting. IEEE Transactions on Power Systems, 2023, 39(1): 1932–1947.
[8] Yao Q, Ma B, Zhao T, Hu Y, Fang F. Optimized active power dispatching of wind farms considering data-driven fatigue load suppression. IEEE Transactions on Sustainable Energy, 2022, 14(1): 371–380.
[9] Dong X, Deng S, Wang D. A short-term power load forecasting method based on k-means and SVM. Journal of Ambient Intelligence and Humanized Computing, 2022, 13(11): 5253–5267.
[10] Zhuang Z, Zheng X, Chen Z, Jin T. A reliable short-term power load forecasting method based on VMD-IWOA-LSTM algorithm. IEEJ Transactions on Electrical and Electronic Engineering, 2022, 17(8): 1121–1132.
[11] Guo Y, Li Y, Qiao X, Zhang Z, Zhou W, Mei Y, Lin J, Zhou Y, Nakanishi Y. BiLSTM multitask learning-based combined load forecasting considering the loads coupling relationship for multienergy system. IEEE Transactions on Smart Grid, 2022, 13(5): 3481–3492.
[12] Zhuang W, Fan J, Xia M, Zhu K. A multi-scale spatial–temporal graph neural network-based method of multienergy load forecasting in integrated energy system. IEEE Transactions on Smart Grid, 2023, 15(3): 2652–2666.
[13] Wang Y, Chen J, Chen X, Zeng X, Kong Y, Sun S, Guo Y, Liu Y. Short-term load forecasting for industrial customers based on TCN-LightGBM. IEEE Transactions on Power Systems, 2020, 36(3): 1984–1997.
[14] Yang H, Niu W, Wang X, Gu W. Wind turbine output power forecasting based on temporal convolutional neural network and complete ensemble empirical mode decomposition with adaptive noise. International journal of green energy, 2023, 20(11/15): 1612–1627.
[15] Wang L, Tian T, Xu H, Tong H. Short-term power load forecasting model based on t-SNE dimension reduction visualization analysis, VMD and LSSVM improved with chaotic sparrow search algorithm optimization. Journal of Electrical Engineering & Technology, 2022, 17(5): 2675–2691.
[16] Ajagekar A, You F. Deep reinforcement learning based unit commitment scheduling under load and wind power uncertainty. IEEE Transactions on Sustainable Energy, 2022, 14(2): 803–812.
[17] Hassan M H, Kamel S, Selim A, Shaheen A, Yu J, El-Sehiemy R. Efficient economic operation based on load dispatch of power systems using a leader white shark optimization algorithm. Neural Computing and Applications, 2024, 36(18): 10613–10635.
[18] Wang L, Liu Y, Pang X, Wang Q, Wang X. Environmental economic dispatch method of power system based on multi-objective artificial bee colony algorithm. Electrical engineering, 2024, 106(1): 567–579.
[19] Khan M, Shafi M A, Khosa M S K. An analysis of stochastic wind power approach for economic load dispatch optimization using genetic algorithm. Southern Journal of Engineering & Technology, 2023, 1(2): 36–45.
[20] Shafiee M, Zamani A A, Sajadinia M. Using improved DDAO algorithm to solve economic emission load dispatch problem in the presence of wind farms. International Journal of Industrial Electronics Control and Optimization, 2023, 6(3): 161–169.
[21] Hao W K, Wang J S, Li X D, Wang M, Zhang M. Arithmetic optimization algorithm based on elementary function disturbance for solving economic load dispatch problem in power system. Applied Intelligence, 2022, 52(10): 11846–11872.
[22] Acharya S, Ganesan S, Kumar D V, Subramanian S. Optimization of cost and emission for dynamic load dispatch problem with hybrid renewable energy sources. Soft Computing, 2023, 27(20): 14969–15001.
[23] Pedraza J M. The role of renewable energy in the transition to green, low-carbon power generation in Asia. Green and Low-Carbon Economy, 2023, 1(2): 68–84.
[24] Trong H C, Nguyen T T. Jellyfish search algorithm for economic load dispatch under the considerations of prohibited operation zones, load demand variations, and renewable energy sources. IAES International Journal of Artificial Intelligence, 2024, 13(1): 74–81.
[25] Xiang X, Yuan T, Cao G, et al. Short-term electric load forecasting based on signal decomposition and improved tcn algorithm. Energies, 2024, 17(8): 1815.
[26] Zheng G, Kong L, Su Z, et al. Approach for short-term power load prediction utilizing the ICEEMDAN–LSTM–TCN–bagging model. Journal of Electrical Engineering & Technology, 2025, 20(1): 231–243.
Biographies

Zhixin Wang graduated from North China Institute of Science and Technology with a Bachelor’s Degree in Electrical Engineering and its Automation.
Her research interests include Optimization and improvement of distribution and marketing integration business, power quality, etc.

Yougang Ren graduated from North China Electric Power University with a Master’s Degree in Electrical Engineering.
His research interests include Optimization and improvement of distribution and marketing integration business, power quality, etc.

Yuting Liang graduated from Hebei University of Technology with a Master’s Degree in Electrical Engineering.
Her research interests include Technical Supervision and Management of Supply Voltage and Power Quality, etc.

Chong Wang graduated from Yanshan University with a Master’s Degree in Electrical Engineering.
Her research interests include Artificial intelligence technology and its applications, etc.

Cuizhi Tong graduated from North China Electric Power University with a Master’s Degree in Electrical Engineering.
Her research interests include Data management support for power distribution and utilization, big data analysis and application, artificial intelligence technology and its research applications, etc.
Distributed Generation & Alternative Energy Journal, Vol. 40_5&6, 1235–1258.
doi: 10.13052/dgaej2156-3306.405613
© 2025 River Publishers