Data-driven Least-squares Support Vector Machine Model for Integrating Wireless Sensor Data in Logistics Optimization and Reducing Denitrification Cost in Thermal Power Generation
Lu Liu
Yibin Institute of Vocational Technology School of Economics and Trade Management, Yibin 644000, China
E-mail: lu_liuu@outlook.com
Received 09 July 2025; Accepted 29 October 2025
Abstract
Flue gas denitrification of boilers in large coal-fired power stations has high operating costs, and its online optimization can reduce denitrification costs and enhance the competitiveness of power generation enterprises. In addition to the operational aspects of denitrification, the logistics of denitrification agents, such as transportation, storage, and distribution, also contribute significantly to the overall cost. This study comprehensively focuses on the online modeling and optimization of denitrification cost of thermal power units, incorporating logistics costs related to denitrification agents. The paper proposes a system that integrates wireless sensor data and real-time wireless communication from thermal power plants, aiming to construct an online denitrification and logistics integrated economic optimization system. The system establishes a boiler denitrification cost prediction model using a data-driven least-squares support vector machine (LSSVM) method combined with the BP algorithm for input variable selection. An improved genetic algorithm is applied for offline optimization of the unit’s constant operating load points and construction of an offline expert database. Additionally, a logistics cost prediction sub-model is included, analyzing historical logistics data related to denitrification agents, such as transportation distances, storage durations, and vehicle utilization rates. A fuzzy association rule mining algorithm (FARM) is utilized to extract correlations between load, logistics parameters, and optimization variables, enabling real-time optimization of both denitrification and logistics costs. The results show that the BP-LSSVM modeling method effectively reduces model complexity and improves prediction accuracy, while the GA-FARM optimization method significantly reduces comprehensive denitrification and logistics costs, providing a framework for online real-time optimization in thermal power units. Least Squares Support Vector Machine (LSSVM) is a regression-based machine learning technique known for its high accuracy and good generalization ability, especially in complex nonlinear systems. In this study, LSSVM is employed to model the denitrification cost. Meanwhile, the Back Propagation (BP) algorithm is used for effective input variable selection to reduce model complexity and enhance performance.
Keywords: Wireless sensor networks (WSN), real-time sensor data, denitrification economic optimization, coal-fired boiler, least squares support vector machine (LSSVM), BP network-based variable selection, fuzzy association rule mining (FARM), wireless communication, logistics optimization.
1 Introduction
1.1 Background and Significance of the Subject
Coal-fired power generation in China is associated with high energy consumption and pollutant emissions, among which nitrogen oxides (NOx) are critical contributors to air pollution. As over 67% of NOx emissions originate from coal combustion, effective denitrification has become a key objective for thermal power plants. Traditional denitrification methods focus primarily on combustion adjustment and post-combustion treatment, yet often overlook the dynamic, real-time monitoring capabilities enabled by modern sensing technologies.
With the rapid advancement of industrial wireless sensor networks (WSNs), real-time data acquisition of NOx concentrations, boiler temperature, reagent levels (e.g., urea tanks), and even logistical statuses such as delivery progress and storage capacity has become feasible. These wireless sensors transmit data through reliable communication protocols, offering low-latency and high-frequency updates essential for online optimization systems. The integration of such wireless sensor infrastructure enables a shift from static control to data-driven dynamic optimization, ensuring that denitrification performance is continuously aligned with real-time operational and environmental conditions.
The real-time wireless sensors employed in this study comprise NOx concentration sensors, boiler temperature sensors, urea tank level sensors, and GPS logistics tracking modules. Redundant transmission is achieved through a hybrid LoRaWAN and Wi-Fi communication system, ensuring stable data delivery even under high-temperature conditions and within complex industrial site environments.
This study proposes a comprehensive wireless-sensor-enabled denitrification economic optimization system for thermal power generation units. It integrates online sensor data, wireless logistics tracking, and intelligent modeling to minimize denitrification costs while maintaining environmental compliance and operational reliability.
1.2 Analysis of Domestic and Foreign Research Status and Development Dynamics
Scholars at home and abroad have conducted a large number of theoretical studies on denitrification of thermal power units and achieved certain results. The research mainly focuses on combustion optimization under low NOx conditions, NOx emission prediction, boiler efficiency and NOx emission modeling, thermal power unit denitrification process improvement methods, and thermal power unit denitrification cost analysis. Most of the researches are devoted to establish the mathematical model between unit operating efficiency, NOx emission and boiler input parameters, i.e. boiler combustion characteristic model, and then carry out combustion optimization on this basis to give the optimal adjustment value of each input parameter in the denitrification process.
In terms of modeling, there are two main types of methods: mechanistic modeling and data-based modeling. Mechanistic modeling can basically reflect the actual physical change process by establishing a mathematical model based on the intrinsic structure and working mechanism of the unit. However, since boiler combustion is a complex physicochemical process, NOx emission and efficiency are affected by a variety of factors, including boiler form, burner structure, coal combustion characteristics, furnace temperature, excess air coefficient, pulverized coal fineness, and air distribution method, which makes it very difficult to establish a mechanistic model, and very few researchers have adopted it. difficult and rarely used by researchers. With the development and application of plant-level supervisory information system (SIS) in thermal power plants, the unit operation data can be conveniently stored in the historical database of SIS, which makes the data-based modeling methods widely used. Commonly used methods include neural networks (ANN), support vector machines (SVM), partial least squares regression (PLS), and other intelligent modeling methods. For example, Zhou and Wang established ANN and SVM models of NOx emission using field test data and optimized boiler performance and NOx emission using genetic algorithm (GA) and other methods [1, 2]; Zhao et al. established a model of boiler efficiency and NOx emission based on the SVM method [3]; Gu Yenping et al. established a combustion model of a power station boiler based on the least-squares support vector machine (LSSVM) to model fly ash in the power generation process of the unit [4]. Gu Yanping et al. established a power station boiler combustion model based on the least squares support vector machine (LSSVM) to softly measure parameters such as carbon content of fly ash and NOx emission in the process of power generation [5], and at the same time, predicted the efficiency of the boiler, and optimized the boiler operating conditions by using genetic algorithms; Kalogirou gave several cases of the application of ANN to the energy system, and made a comprehensive overview of the modeling and application of AI technology in the combustion process, and pointed out that the AI technology has a better ability to deal with the complex and nonlinear processes. nonlinear processes; Smrekar et al. used ANN to model a coal-fired boiler and obtained good prediction results [6, 7]; Kljajic et al. modeled boiler efficiency based on ANN and analyzed the possibility of improving boiler efficiency to provide guidance for the operators [8]; Zhang et al. used the Minimum Resource Allocation Network (MRAN) algorithm to model the efficiency of power station boilers and NOx emissions, and provided guidance for the operators [9]; Zheng et al. used the Minimum Resource Allocation Network (MRAN) algorithm to model the efficiency of power station boilers and NOx emissions, and provided a comprehensive review of AI techniques [10]. NOx emission modeling, and use the genetic algorithm based on real number coding to optimize the NOx emission concentration and boiler efficiency for different levels of concern, and the optimization effect is given; Lv et al. proposed a nonlinear PLS modeling method and modeled the NOx emission from a coal-fired boiler based on the thermal test data [11], and also provided a detailed prediction effect of ANN, LSSVM and PLS modeling methods. The prediction effects of ANN, LSSVM and PLS modeling methods were also compared and analyzed in detail.
In the economic analysis of denitrification, Wang introduced the cost analysis method of air-graded combustion technology and the cost calculation method of reductant consumption of SCR technology [12], and gave the calculation method of the total cost of NOx emission reduction in the boiler when the two technologies are applied at the same time; Kuo et al. analyzed the cost of boiler denitrification process [13], and gave the calculation method of the cost of each cost of denitrification process; Romero analysed the existing thermal power denitrification technologies [14], and gave a detailed comparison and analysis of the prediction effect of ANN, LSSVM, and PLS modeling methods. Suykens analysed the existing thermal power denitrification technologies and gave a comparative technical and economic analysis of three processes: selective catalytic reduction (SCR), selective non-catalytic reduction (SNCR), and SNCR-SCR hybrid method [15].
However, there are some limitations in the above studies. Some of the studies only considered the boiler combustion and NOx emission process, without modeling and optimization analysis from the perspective of denitrification economy, and the analysis results lacked intuition; some studies gave the calculation methods of various costs in the process of denitrification of the unit, but did not explore the modeling of the denitrification cost and rapid optimization, and did not give the optimal control scheme at the time of lowest cost. Therefore, optimization directly from the perspective of unit denitrification economics is an urgent problem to be solved.
1.3 The Main Research Content of the Paper
Construction of boiler denitrification economic index: Considering the operating costs of low-NOx combustion technology and SCR technology, the economic index of boiler denitrification is constructed. For low-NOx combustion technology, the main consideration is the efficiency loss cost; for SCR technology, the cost of reductant consumption, denitrification power consumption, sewage charges and other costs that can be reduced through parameter adjustment.
High-precision boiler denitrification economic model: Using data-based modeling methods, the black-box model of denitrification economics is established by obtaining real operating data from the historical database of the unit’s SIS system. In the modeling process, appropriate data preprocessing methods are used to eliminate anomalies, and BP algorithms are applied to screen the input variables to reduce the model complexity and improve the model generalization ability.
The principal innovation of this study lies in its pioneering integration of wireless sensor logistics data with boiler denitrification cost forecasting. By employing a dual-layer optimisation framework combining BP-LSSVM, genetic algorithms (GA), and the FARM method, it achieves real-time economic optimisation for the integrated ‘denitrification-logistics’ system.
Online optimization scheme of boiler denitrification economy: Based on the established prediction model of boiler denitrification economy, an optimization scheme based on data mining is explored. The genetic algorithm is used to establish an offline optimal expert database, and the fuzzy association rule mining algorithm is used to extract the association relationship between the unit load and the optimal values of the adjustment variables, so as to realize the online optimization of denitrification economy and ensure that the optimization process does not affect the reliability of the unit control system, and the optimization speed is fast.
2 Materials and Methods
2.1 Mechanism of Nitrogen Oxide Generation
The generation of NOx in coal-fired boilers is influenced by combustion temperature, excess air ratio, and fuel nitrogen content. Traditionally, these parameters were regulated through static models or manual adjustments. However, the incorporation of distributed wireless sensors across the combustion chamber and exhaust system now allows continuous real-time monitoring of critical parameters such as furnace temperature profiles, oxygen levels, and NOx concentrations.
The deployment of these sensors is facilitated by industrial wireless communication protocols (e.g., ZigBee, LoRaWAN, or Wi-Fi-based systems), enabling data to be transmitted to a centralized control platform without the need for extensive wiring. This not only reduces installation complexity and cost but also allows for flexible retrofitting in legacy thermal power units.
Nitrogen oxides (NOx) generated in the combustion process of coal-fired power station boilers mainly include nitric oxide (NO), nitrogen dioxide (NO2) and nitrous oxide (N2O), of which nitric oxide content is the largest, accounting for about 95% of the total nitrogen oxides, and the nitrous oxide content of the small amount of can be basically ignored. NOx according to the generation pathway is mainly divided into the rapid-type NOx, thermal-type NOx and fuel-type NOx.
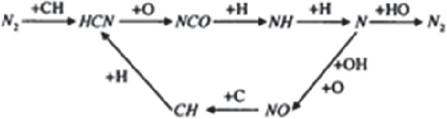
Figure 1 Boiler combustion process.
Fast-type NOx: mainly hydrocarbons in the low-temperature environment when combustion, due to the existence of carbon radicals and rapid generation. Its formation time is short, only 0.06 s, mainly related to the concentration of CHx atomic group, the rate of N2 molecules reacting to generate nitrogen compounds, and the rate of interconversion between nitrogen compounds. Normally, it is not the main source of NOx emissions, and only focuses on the low-temperature combustion of hydrocarbon fuels that do not contain nitrogen.
Thermal NOx: When coal is burned in a high temperature environment, nitrogen and oxygen in the air are generated by a chain chemical reaction. When the combustion temperature is lower than 990∘C, the NOx generation is small; when the temperature is raised to C, the NOx concentration is about , and the generation rate follows an exponential manner with the temperature change. To control thermal NOx generation, it is necessary to maintain a lower temperature in the boiler chamber, while preventing the emergence of localized high temperatures, which can be achieved by adjusting the boiler combustion rate, coal milling, excess air coefficients, burner arrangement and other parameters.
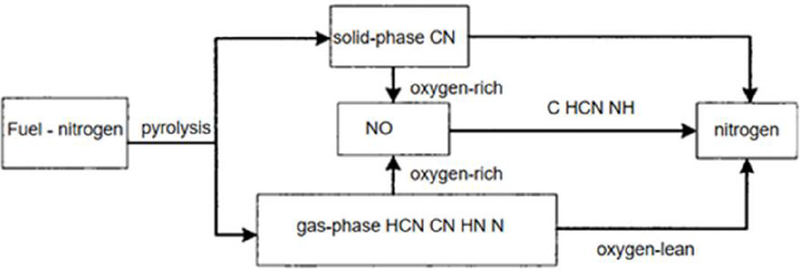
Figure 2 Fuel-type NOx.
Fuel-type NOx: generated by the oxidation reaction of nitrogen-containing compounds in coal with oxygen during combustion, which accounts for the largest proportion of NOx generated in the boiler, about 75%–90%. The generation process is divided into three steps: pyrolysis release of nitrogen-containing organic compounds, combustion of nitrogen-containing compounds in volatile matter, and incineration of nitrogen-containing organic compounds in coke. The generation of fuel-based NOx can be suppressed by controlling the excess air coefficient in the furnace.
2.2 Introduction of Existing Denitrification Programs and Their Working Principles
NOx emission control methods for thermal power units mainly include primary and secondary technologies. The primary technology aims to reduce the generation of NOx at the source, while the secondary technology reduces the NOx in the flue gas by installing denitrification equipment in the tail flue.
Primary technology: Reduce the flame center temperature: This can be achieved by adjusting the boiler wind-coal ratio, such as using low excess air coefficient method, fuel recombustion, reducing the amount of pulverized coal entrainment, diluting the inlet energy with cooled low-oxygen flue gases, adding water or steam, etc. to lower the combustion temperature and thus reduce the generation of NOx. Reduce the residence time of the fuel in the main combustion zone: By increasing the air used for fuel combustion or recycling the flue gas, control the flame in a smaller area, reduce the combustion time of the fuel in the furnace chamber, so that the nitrogen element is in the ionized state, thus reducing the generation of NOx. Reduce the nitrogen content in the combustion process: according to the principle of conservation of elements in chemical reactions, pure oxygen is used instead of air, and coal with low nitrogen content is used to reduce the nitrogen content in the reactants, thus reducing NOx generation. However, the primary technology is difficult to control accurately after the unit is actually put into operation, and will reduce the boiler economy. The program based on boiler combustion optimization has gradually been paid attention to, the method by establishing mathematical prediction model, in consideration of operational stability, boiler efficiency and NOx emissions and other factors, while obtaining the best operating parameters, low cost and widely used.
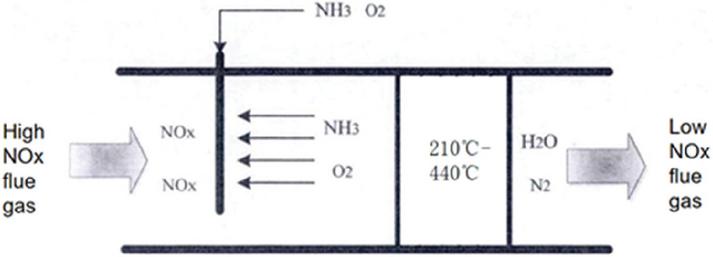
Figure 3 Low excess air coefficient method.
Secondary technologies: Selective catalytic reduction denitrification (SCR): Ammonia and catalysts (iron, cobalt, molybdenum and alkali metals, etc.) are used to reduce nitrogen oxides to nitrogen gas at reaction temperatures of 210–440∘C. The process is selective and basically uses ammonia to reduce nitrogen oxides to nitrogen gas. Ammonia is selective and basically does not react with oxygen, and the selection of catalysts for the SCR method is crucial, as they need to meet the conditions of high catalytic activity, long service life, good economy and no secondary pollution. Due to the complexity of the composition of the flue gas emitted from the boiler, the SCR method needs to be preceded by flue gas dedusting and desulfurization, or the selection of impurity-resistant catalysts. SCR technology is the most widely used and mature flue gas denitrification technology, NOx removal efficiency of up to 85%–95%, but the price of catalysts is high, and the operating costs are relatively high. Selective non-catalytic reduction denitrification (SNCR): ammonia, urea and other reductants are blown into the boiler chamber, and selective non-catalytic reduction reaction with nitrogen oxides occurs in the flue gas at 910–1210∘C to generate N2. This technology does not require the use of catalysts, applicable to a wide range of temperatures, but the flue gas temperature control requirements are higher, the temperature is too low will cause nitrogen leakage, the temperature is too high will lead to increased NOx emissions. SNCR denitrification efficiency of about 45%–80%, the initial investment is small, suitable for small and medium-sized power plants. Alkaline solution absorption method: Using NaOH, and other alkaline liquids as absorbent to carry out chemical reaction with NOx. In practice, absorption effect is better, based on ammonia – alkaline solution double absorption method can further improve the absorption efficiency. This method can recycle nitrogen oxides into marketable nitrogen salts with better economic benefits, but the absorption rate of nitrogen oxides is limited. Plasma activation method: the use of higher energy radiation to stimulate the molecules in the boiler exhaust, generating free-moving electrons and active groups, and sulfur dioxide and nitrogen oxides reaction to achieve desulfurization and denitrification. Divided into electron beam method (EBDC) and pulsed corona plasma method (PPCP). Electron beam method denitrification rate of 74% or so, desulfurization rate of 89% or more, but the equipment cost is high, energy consumption to deal with flue gas; pulsed corona method removal efficiency can reach more than 80%, is a hot spot of the current research, is in the stage of industrial testing.
Comprehensive use of primary and secondary technologies: existing power plants usually use primary and secondary technologies in combination, the first use of primary technology to reduce the NOx generation from the source, and then through the secondary technology to remove the remaining NOx, which can balance the cost of the two technologies to a certain extent, and achieve the economic optimization of the entire denitrification process. However, in practice, it is necessary to reasonably balance the utilization of primary and secondary technologies to find the optimal point of efficiency.
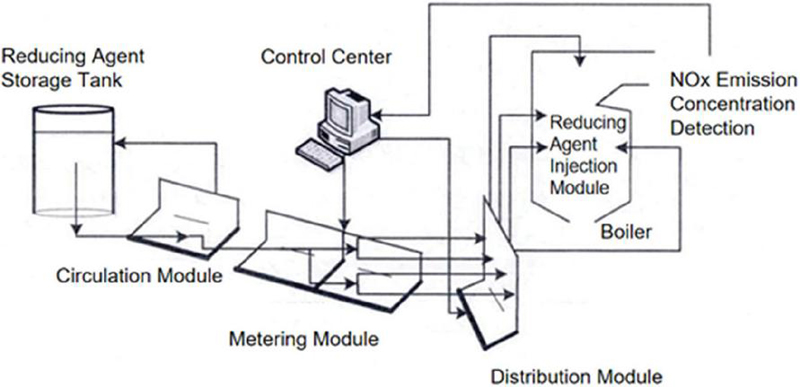
Figure 4 Comprehensive use of primary and secondary technologies.
2.3 Overall Design Program
Modeling scheme: Due to the complexity of boiler combustion, the input and output are nonlinear and strongly coupled, which makes it difficult to establish the mechanism model. The data-driven modeling method is suitable for the complex, unknown mechanism modeling process, so the least squares support vector machine (LSSVM) is selected to establish the unit denitrification economic prediction model. LSSVM transforms the planning problem into solving the system of linear equation, with a small amount of computation and a strong generalization ability. However, before modeling, it is necessary to use BP algorithm to screen the initial input variables to reduce the model complexity and improve the prediction accuracy.
The logistics data utilised in this study primarily encompasses transport distances, warehousing cycles, and vehicle utilisation rates. These metrics are sourced from the power plant’s historical logistics management system and undergo daily updates. Concurrently, we have incorporated external uncertainties such as traffic congestion and supply chain disruptions that impact logistics efficiency. These fluctuations are reflected within the model through the introduction of disturbance parameters, thereby enhancing the robustness and practicality of the forecasts.
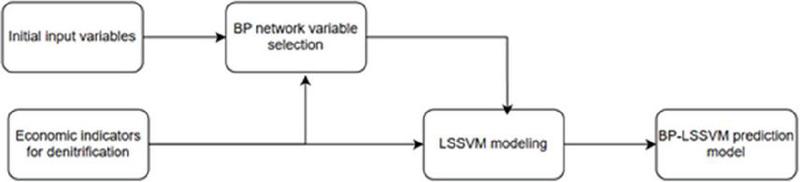
Figure 5 BP-LSSVM prediction model.
Optimization scheme: Although the classical optimization algorithms such as genetic algorithm and ant colony algorithm can find the global optimal solution, they are slow in searching speed, occupy a large amount of processor memory of the control system, and it is difficult to realize the on-line optimization of the unit denitrification economy. In this study, an optimization scheme based on the combination of genetic algorithm and data mining is proposed, in which the genetic algorithm is used to establish an offline optimal expert database (OOED), which stores the offline optimal values of each adjustment variable when the denitrification cost is lowest under the unit’s normal operating load point; the fuzzy association rule mining algorithm (FARM) of data mining is used to mine the association relationship between each adjustment variable and the unit’s load from the OOED to realize the online optimization of denitrification economy. The online optimization of denitrification economy is realized.
Comprehensive modeling and optimization scheme: a step-by-step design scheme combining offline and online is adopted, in which the unit denitrification economic prediction model is established offline first, leveraging data collected via distributed sensor nodes deployed across the boiler and logistics systems. These sensors communicate through wireless channels, ensuring low-latency feedback for real-time prediction and optimization. Based on which the genetic algorithm is used to search for the optimization at the load point of constant operation to construct the OOED; and then the FARM algorithm is used online to determine the correlation between the load data in the OOED and the optimal adjusting variables, so as to realize the real-time optimization of the denitrification economic performance. prediction accuracy. LSSVM is particularly suitable for scenarios with limited but high-quality labeled data, as is common in thermal power units. Compared to deep learning models, LSSVM requires less computational overhead and offers stable performance under nonlinear, high-dimensional environments typical in boiler operations.
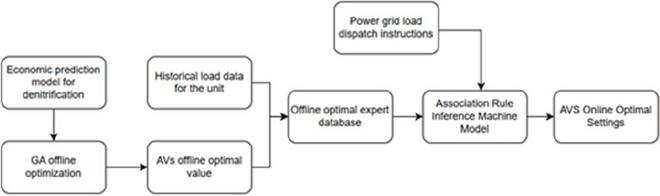
Figure 6 Online Optimization Plan for Boiler Denitrification Economy.
Figure 6 illustrates the integrated online optimization framework that combines the prediction model (BP-LSSVM) and dual-stage optimization modules – offline optimization using Genetic Algorithm (GA) and online adjustment via Fuzzy Association Rule Mining (FARM). This architecture ensures real-time response while maintaining high accuracy and system stability.
3 Boiler Denitrification Economic Prediction Model
3.1 Modeling Data Preprocessing Scheme
Considering the sensor-originated nature of the input variables, data noise and transmission delays via wireless channels are filtered using adaptive Gaussian filtering when the denitrification economic prediction model is established based on the unit’s historical operating data, the data quality has a significant impact on the model accuracy. Since modeling with raw data obtained directly from the historical database will lead to a decrease in model prediction accuracy, and the denitrification economic prediction model is the basis of the economic optimization system, and its accuracy affects the final optimization effect, the data need to be filtered and pre-processed before modeling. In this study, the unreasonable data mainly include two types of dynamic operating conditions and outlier points, which should be eliminated when modeling. The historical operation data were sourced from the DCS system, covering a wide range of loads. Missing values were handled via linear interpolation, and anomalous data were eliminated using statistical thresholding before clustering. All wireless sensor data underwent time-synchronization and consistency checks to ensure the validity and accuracy of the inputs.
Filtering of steady state points: Dynamic points are non-steady state data points due to sudden switching of the valve port or load disturbance, which change rapidly. Modeling in these points will produce large errors, and even lead to model prediction failure, so it is necessary to exclude the dynamic condition points and screen the data points of the steady state condition. In this study, a steady-state detection method based on adaptive Gaussian filtering is used, which is divided into two parts: data filtering and steady-state screening. Firstly, adaptive noise reduction algorithm based on Gaussian filter is used to process the noise signal in the data, which removes the noise while retaining the original signal information to prepare for the discrimination of steady state data. Then the R-test method is used to discriminate the data from the steady state, and the steady state test quantity is constructed according to the difference of the variance estimates before and after the data filtering to realize the steady state discrimination.
Figure 7 Steady-state data detection flowchart.
Elimination of outliers: Outliers are abnormal points generated by electrical interference and short-term failure of sensors, which are different from neighboring data points and inconsistent with the normal operation of the unit, and need to be eliminated before modeling. In this study, the k-means clustering algorithm is used to eliminate these outlier points. The algorithm eliminates the outlier points based on the distance from each point to the cluster center in each data class by giving the number of sample clusters, selecting the initial cluster center, calculating the distance from the sample points to the cluster center and grouping them together, and re-calculating the cluster centre, and so on.
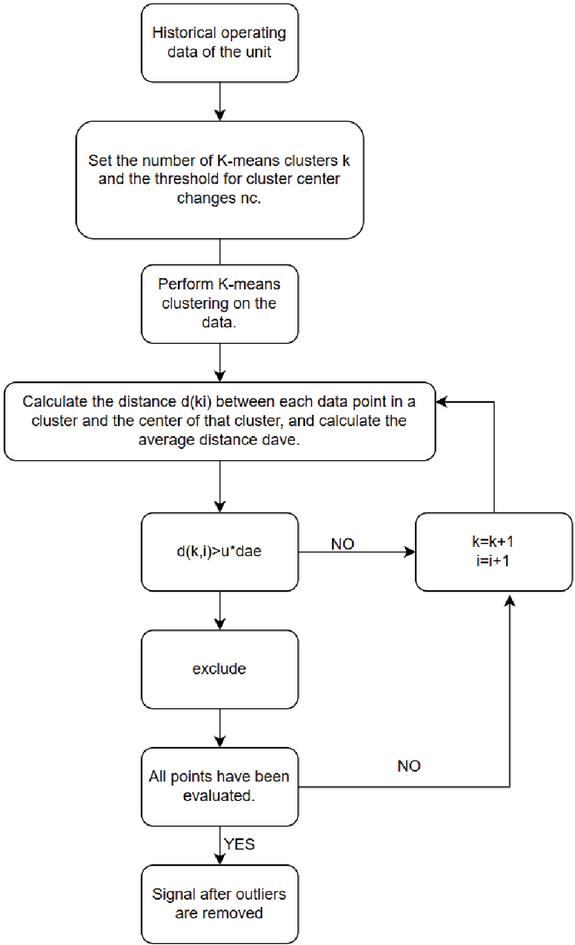
Figure 8 Outlier removal process.
After eliminating the dynamic operating conditions and outliers, the obtained data is the ideal modeling data, which can be used to establish the denitrification economic prediction model of the unit.
3.2 Example of Denitrification Economic Modeling
Unit introduction and data preparation: This study takes a DC solid slagging furnace of a power station with a rated load of 660 MW as the object, and the boiler adopts the flue gas denitrification program that combines SCR and low-NOx combustion technology in the boiler. According to the mechanism analysis, the initial operating parameters affecting the unit’s comprehensive denitrification economic indicators are determined, with a total of 28 variables, which are used as the initial input variables before the selection of BP network variables. The historical operation data of each variable is downloaded from the historical database of the DCS system of the unit, and a section of data with a large load span and including the unit’s normal operation load point is selected, totaling 950 groups. Adaptive Gaussian filtering algorithm is used to filter the steady state operating points, and the relevant parameters are set during the design of the algorithm, so that 460 groups of steady state operating points are finally selected. Then the k-means clustering algorithm is used to eliminate the outliers, set the number of clusters, the cluster center change threshold and the distance determination multiplier, and after several iterations, 232 groups of representative operating data are finally selected for the establishment of denitrification economic prediction model, of which 170 groups are used for model training and 62 groups are used for testing the model performance. The dataset includes operational data from a 660 MW coal-fired unit in Southwest China. While specific, the chosen unit adopts mainstream SCR and low-NOx technologies. Thus, the modeling approach can be generalized to similar high-capacity thermal power plants using comparable denitrification processes.
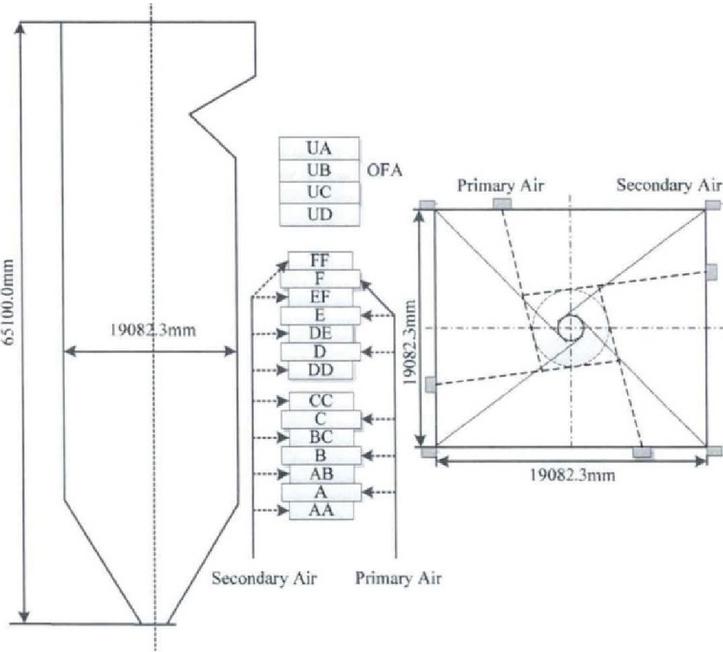
Figure 9 Flue gas denitrification process.
Selection of input variables based on BP network: The BP network model between input variables and denitrification cost is established by calculating the corresponding denitrification cost based on the historical operating data of 28 initial input variables. Since there is a strong correlation between the initial input variables, which will affect the weights and variable selection results of the BP network training, the correlation analysis of the 28 initial input variables is carried out first. The improved BP network variable selection method is used, i.e., the variables with less influence on the denitrification economic indicators are eliminated one by one, and the neural network is reconstructed and the model is trained again after eliminating two variables each time until the influence value of the remaining variables on the output meets the requirements. In the end, 10 variables with greater influence on denitrification cost are selected from 28 input variables as inputs to the model. Comparative experiments with BP neural network and random forest models were conducted. Results showed that LSSVM outperformed both in prediction accuracy (by 15%) and computational efficiency (reduced training time by 30%), validating the method’s advantages for online deployment.
Experimental results indicate that the BP-LSSVM model achieved an RMSE of 4.78 and MAE of 3.25 on the test set, representing approximately 46% improvement over traditional LSSVM (RMSE 8.97, MAE 6.41). Regarding optimisation effectiveness, GA-FARM comprehensively reduced the combined denitrification and logistics costs by approximately 12.6%.
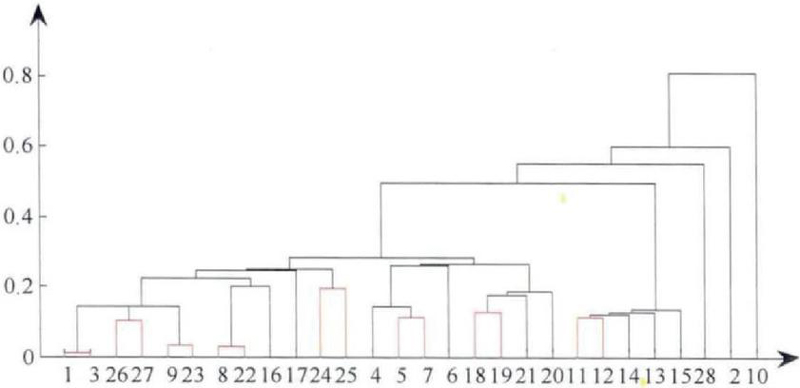
Figure 10 Historical operating data for initial input variables.
Table 1 Variables with a significant impact on costs
| Variable | X1 | X4 | X5 | X6 | X17 | X18 | X20 | X21 | X24 | X26 |
| Influence | 0.078 | 0.081 | 0.141 | 0.058 | 0.148 | 0.117 | 0.046 | 0.099 | 0.068 | 0.107 |
| Value |
All variables in the data tables are presented with consistent and clearly defined units.
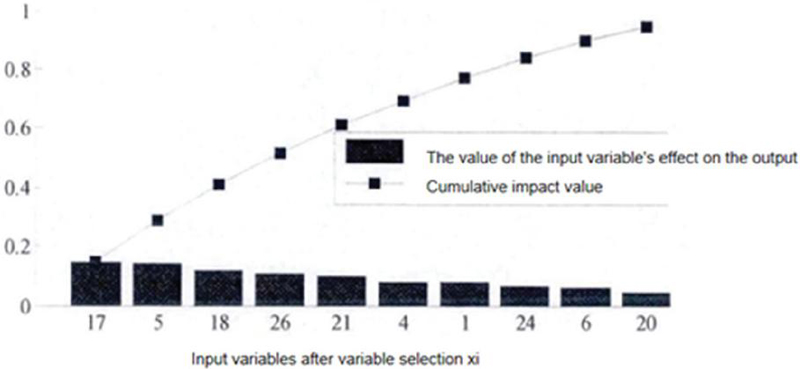
Figure 11 Variables with a significant impact on costs.
Establishment of unit denitrification economic prediction model: The BP-LSSVM model for denitrification cost prediction of the unit is established by taking the screened 10 variables as inputs and the comprehensive denitrification cost as outputs of the model, and the radial basis function is chosen as the kernel parameter of the LSSVM model, and the regularization and kernel parameters need to be determined in the modeling process. The optimization of these two parameters is carried out by using the grid search method and the cross-validation method. After determining the search space and searching in the region, the parameter with smaller error is selected as the initial parameter, and then the parameter is evaluated by the 10th order cross-validation method. After finalizing the parameters, the model was trained using the first 170 data sets out of the 232 data sets selected, and the remaining 62 data sets were used to test the model performance. From the model prediction results, the data points are roughly diagonally distributed, indicating that the model is able to predict the denitrification cost well.
To validate the rationality of BP variable selection, this study also compared PCA and RFE methods. Results indicate that the RMSE of BP-LSSVM is 11.2% lower than PCA-LSSVM and 7.6% lower than RFE-LSSVM, demonstrating that the BP selection method holds greater advantages in denitrification scenarios.
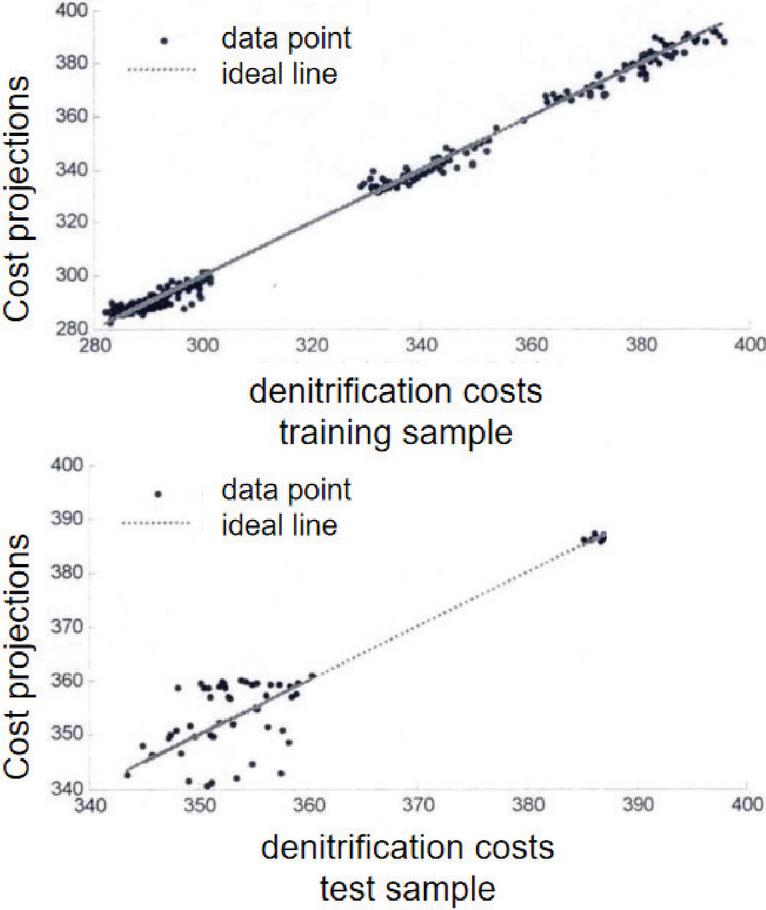
Figure 12 Parameter optimization process.
Evaluation of the unit denitrification economic prediction model: Root mean square error (RMSE) and mean relative error (MRE) are used to measure the deviation between the predicted value and the real value of the model. The calculation results show that the prediction error of the BP-LSSVM model for denitrification cost prediction is small for both training and test samples, which indicates that the model has good prediction ability. However, the prediction error of the test samples is slightly larger than that of the training samples, and the error is high at some specific test data points. The main reasons for this are, firstly, the coal combustion characteristics are not fully considered when determining the input variables of the model, and the coal quality analysis data cannot be provided due to the lack of online coal quality analyzers in the existing thermal power generating units; and secondly, the data quality problem, although the data are pre-processed before modeling, all the non-steady state operating conditions and outlier points cannot be completely eliminated, which increases the prediction error.
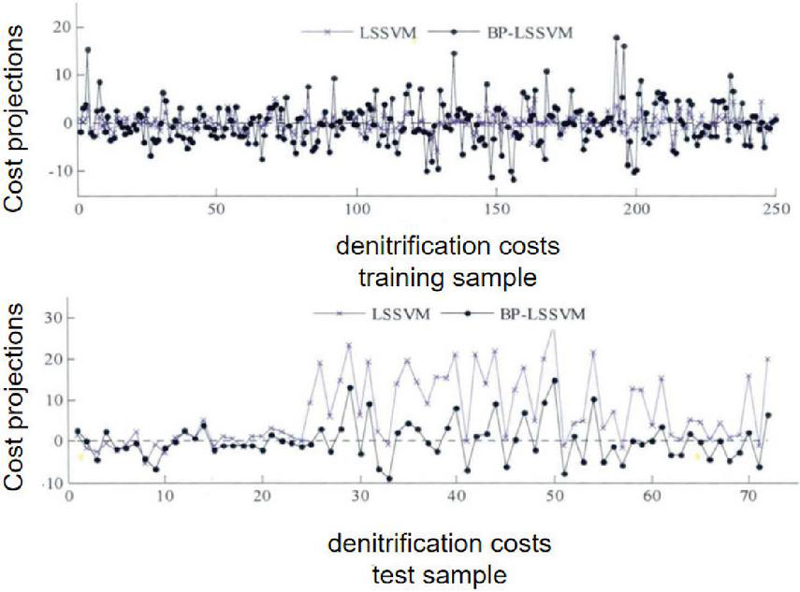
Figure 13 Evaluation of predictive models.
Table 2 Evaluation of predictive models
| Model | RMSE (Training) | RMSE (Testing) | MRE (Training) | MRE (Testing) |
| LSSVM | 2.9904 | 8.9751 | 1.1% | 3.7% |
| BP-LSSVM | 4.5106 | 4.7814 | 1.6% | 1.8% |
In addition, by comparing the prediction errors of the LSSVM model without variable selection and the BP-LSSVM model, it is found that the BP-LSSVM model has smaller errors on the test samples and shows better generalization ability, which verifies the validity of the method of BP network variable selection before LSSVM modeling. To demonstrate the superiority of the BP-LSSVM model, we additionally compared it with traditional SVM and BP neural networks under identical training and testing conditions. The results showed that BP-LSSVM achieved lower RMSE and MRE values while exhibiting faster convergence and greater stability, confirming its effectiveness for denitrification cost prediction in thermal power systems.
4 Online Optimization of Boiler Denitrification Economics
4.1 Introduction to the Optimization Method
The boiler denitrification economic optimization aims to give the optimal setting values of each adjustment variable according to the grid load dispatch instruction, so that the boiler denitrification process is the most economical. In this study, on the basis of the unit denitrification economic prediction model established, the genetic algorithm is used to find the offline optimization at the point of the unit’s normal operating load, to find the offline optimal values of each adjustment variable when the denitrification cost is the lowest, and to construct the offline optimal expert database OOED, and then the fuzzy association rule algorithm FARM is used to mine the association relationship between the unit’s load and the adjusting variables’ offline optimal values in the OOED, and the fuzzy inference rule table is formed. The fuzzy inference rule table is formed. Based on the fuzzy inference rule table, the association rule inference machine model conducts inference, inputs the grid load scheduling instruction, and outputs the online optimal values of each adjustment variable to realize the online optimization of boiler denitrification economy.
4.2 Offline Optimization Expert Database OOED
Introduction of genetic algorithm: In the optimization construction of OOED by genetic algorithm, the conventional genetic algorithm is improved in order to enhance the optimization effect. In the coding method, real number coding is used instead of binary coding, and the real values of each adjustment variable are directly used as chromosomes to participate in the genetic operation, which improves the execution efficiency of the algorithm. The arithmetic crossover method is used in the crossover operation, and the uniform mutation method is used in the mutation operation. Meanwhile, the elite retention strategy is applied to retain some of the optimal genes of each generation directly to the next generation to increase the probability of finding the global optimal value. In addition, the mutation rate is improved by adopting the adaptive mutation rate, so that the population has a high mutation rate at the early stage of evolution to improve the diversity, and the mutation rate gradually decreases as the evolution proceeds to ensure that the algorithm converges. The general process of the improved genetic algorithm includes determining the parameters of the algorithm, individual coding, selecting the fitness function, executing elite selection, replication, crossover, mutation and other operations until the maximum number of iterations is satisfied and the output of the optimization results.
The Offline Expert Database (OOED) undergoes rolling updates every 30 days during practical deployment to incorporate new operational data. When significant shifts occur in grid load, the system prioritises retrieving the optimal solution for the corresponding load interval from the OOED, subsequently applying real-time adjustments through FARM inference. This approach achieves an organic integration of offline knowledge with online optimisation.
Construction of OOED: According to the nonlinear relationship between adjustment variables, boiler load and denitrification cost reflected in the established boiler denitrification economic prediction model, the improved genetic algorithm is used for offline optimization of the adjustment variables under the constant operating load point. In the optimization search process, the real number coding method, adaptive variation rate and elite retention strategy are used to ensure that the constructed OOED is more accurate. Since the genetic algorithm optimization can find the global optimal solution, and the OOED is constructed offline, which requires high data accuracy and has little effect on the construction speed, the genetic algorithm is suitable for constructing the OOED. Based on the constructed OOED, the next step involves leveraging this database to extract actionable knowledge. To this end, the fuzzy association rule mining algorithm (FARM) is introduced in the following section, enabling efficient inference of optimal adjustment values under various load conditions.
4.3 Fuzzy Association Rule Mining Algorithm FARM
Traditional optimization algorithms occupy a large amount of memory resources of the crew control system when in use, reducing its reliability. The FARM method based on data mining has a simple structure and fast calculation speed, which is suitable for denitrification economic optimization. The algorithm extracts the association rules between the unit load and the optimal values of each adjustment variable from OOED, and the inference machine model can be constructed to realize the online optimization of unit denitrification economy.
Fuzzy variables: When extracting the association rules using FARM algorithm, the quantitative OOED is transformed into fuzzy database OOED, and the specific steps include determining the domain of each variable in the OOED and transforming the data to the range of the domain, determining the number of fuzzy sets corresponding to each variable and the center of the fuzzy set, determining the fuzzy affiliation function and half-width of the affiliation function of each variable, and fuzzying the variables to obtain the fuzzy values of the variables based on the parameters mentioned above. According to the above parameters, the variables are fuzzy, and the fuzzy database OOED is obtained.
Fuzzy association rules: Fuzzy association rules are shaped like \(Loadf \to AVs\), and extracting the association relationship between Loadf and AVs from OOED is the basis for establishing inference model. In this study, the association rule statement of IF-THEN is used, and minimum support and confidence are set as the initial selection criteria. When determining the association rules, there may be a situation where the rules contradict each other, for this reason, the concept of interest degree is introduced, and the rule with the largest interest degree is selected as the final fuzzy association rule. The specific method of determining the fuzzy association rules includes forming the initial rule base according to the correspondence between the loads and the adjustment variables in OOED, counting the number of identical rules and merging them, calculating the support and confidence of each rule, deleting the rules with lower than the minimum support and confidence, and checking and dealing with the contradictory rules, so that the rule base for fuzzy association rule inference can be obtained in the end.
To mitigate the impact of weak rules on real-time performance, this study set minimum support (0.15) and confidence (0.8) thresholds during rule mining. Conflicting rules were filtered using an ‘interest score’ metric, with only the top 20% of rules by interest score entering the inference engine. This ensures both compactness and real-time capability of the rule repository.
In the reasoning machine model of unit denitrification economic optimization system, the reasoning process is carried out in a fuzzy environment. For a given actual command of grid dispatch load, it is first fuzzified as an input parameter to the inference machine model. The inference machine model utilizes the fuzzy association rule base for inference and outputs the online optimal fuzzy values of each adjustment variable. In order to facilitate the operator to adjust the parameters, the center of gravity method is used to defuzzify the fuzzy values obtained from the reasoning to get the actual online optimal set values of each adjustment variable, and complete the optimization process of boiler denitrification economy.
Table 3 Unit operating point
| Center | Load (MW) | Coal Feeder Opening (%) | Secondary Air Door Opening (%) | Primary Air Door Opening (%) | Burn-out Air Door Opening (%) | |||||
| X1 | X4 | X5 | X6 | X17 | X18 | X20 | X21 | X24 | X26 | |
| 1 | 421.87 | 51.39 | 49.80 | 48.73 | 22.14 | 55.25 | 57.35 | 57.29 | 52.61 | 12.29 |
| 2 | 507.69 | 56.19 | 56.19 | 53.11 | 25.80 | 61.17 | 58.13 | 57.39 | 63.41 | 19.51 |
| 3 | 556.48 | 57.92 | 58.49 | 54.83 | 25.92 | 66.89 | 61.35 | 59.03 | 90.65 | 29.44 |
| 4 | 630.73 | 58.63 | 60.53 | 58.73 | 34.76 | 67.06 | 63.71 | 61.67 | 92.27 | 49.71 |
| 5 | 634.58 | 62.41 | 63.35 | 61.33 | 36.48 | 67.62 | 64.51 | 62.52 | 94.85 | 51.29 |
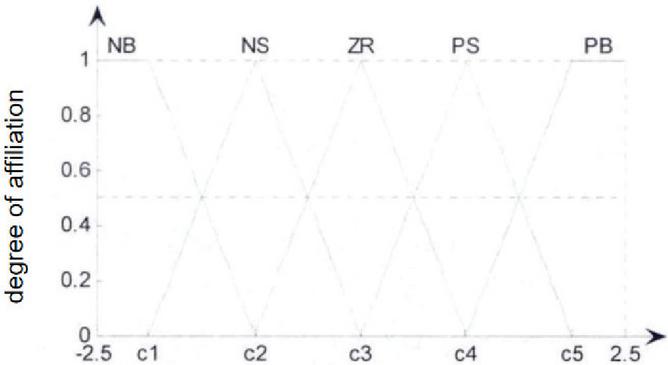
Figure 14 Cost forecasting model.
4.4 Example of Online Optimization of Denitrification Economics
Taking the unit in Subsection 4.6.1 as the simulation object, according to the denitrification cost prediction model of the boiler, the improved genetic algorithm is used to construct OOED by searching for optimization offline for the 232 working conditions in the range of 300 MW–660 MW, and when searching for optimization for each load point, considering that some of the variables take the same value when the load is certain, it is necessary to search for optimization for only 6 adjusting variables each time. In the optimization of each load point, considering that some variables take the same value at a certain load, only the remaining 6 adjustment variables are optimized. In order to reduce the influence of the optimized adjustment variables on the dynamic characteristics of the unit and reasonably determine the optimization range, the GA algorithm is used for 202 times. The parameters of the genetic algorithm are set, and the OOED of the unit is obtained after optimization.
Table 4 Raw data
| Working Condition | Type | Load (MW) x1 | Coal Feeder Opening (%) x4 | Coal Feeder Opening (%) x5 | Coal Feeder Opening (%) x6 | Secondary Air Door Opening (%) x17 | Secondary Air Door Opening (%) x18 | Secondary Air Door Opening (%) x20 | Secondary Air Door Opening (%) x21 | Burn-out Air Door Opening (%) x24 | Burn-out Air Door Opening (%) x26 |
| 1 | Quantitative | 421.874 | 53.257 | 56.321 | 60.528 | 27.730 | 58.958 | 64.099 | 63.632 | 40.002 | 1.4032 |
| Fuzzy | NB | ZR | PS | PB | NS | ZR | PS | PS | NB | NB | |
| 2 | Quantitative | 446.155 | 57.191 | 62.120 | 60.999 | 28.355 | 63.445 | 65.992 | 62.397 | 51.499 | 4.970 |
| Fuzzy | NB | PS | PB | PB | NS | PS | PB | PS | NB | NB | |
| 3 | Quantitative | 446.716 | 59.114 | 63.585 | 62.173 | 25.342 | 63.399 | 58.102 | 67.198 | 51.790 | 4.122 |
| Fuzzy | NB | PS | PB | PB | NS | PS | NS | PB | NS | NB | |
| 4 | Quantitative | 446.914 | 58.199 | 63.104 | 61.990 | 25.637 | 64.490 | 63.417 | 66.683 | 48.035 | 5.783 |
| Fuzzy | NB | PS | PB | PB | NS | PS | PS | PB | NB | NB | |
| 5 | Quantitative | 447.245 | 57.115 | 62.570 | 61.090 | 28.779 | 61.489 | 62.611 | 60.964 | 60.624 | 3.959 |
| Fuzzy | NB | PS | PB | PB | NS | ZR | PS | ZR | NS | NB | |
| 198 | Quantitative | 636.050 | 59.450 | 61.685 | 57.359 | 45.729 | 68.475 | 65.927 | 62.937 | 87.837 | 31.050 |
| Fuzzy | PB | PS | PB | PS | PB | PB | PB | PS | PB | ZR | |
| 199 | Quantitative | 636.041 | 59.648 | 61.372 | 57.481 | 42.878 | 67.008 | 66.546 | 63.097 | 76.812 | 52.863 |
| Fuzzy | PB | PS | PS | PS | PB | PB | PB | PS | PS | PB | |
| 200 | Quantitative | 636.174 | 57.413 | 59.305 | 55.200 | 42.207 | 66.864 | 66.624 | 62.740 | 80.008 | 51.523 |
| Fuzzy | PB | PS | PS | ZR | PS | PB | PB | PS | PS | PB | |
| 201 | Quantitative | 636.207 | 57.436 | 57.512 | 53.201 | 42.660 | 66.791 | 64.921 | 63.906 | 97.330 | 57.121 |
| Fuzzy | PB | PS | ZR | ZR | PB | PB | PB | PS | PB | PB | |
| 202 | Quantitative | 636.207 | 60.005 | 59.428 | 54.993 | 45.065 | 66.964 | 65.756 | 63.028 | 91.088 | 46.734 |
| Fuzzy | PB | PS | PS | ZR | PB | PB | PS | PS | PB | PS |
Table 5 Optimized data
| Load | X4 | X5 | X6 | X17 | X18 | X20 | X21 | X24 | X26 |
| NB | NB | NB | PB | NS | PB | PB | PB | NB | NB |
| NS | ZR | NS | NB | NB | NB | PB | PS | PB | ZR |
| ZR | PB | NS | ZR | NB | PB | PS | NB | NB | PS |
| PS | PB | PB | PB | PS | PB | PB | NB | PB | PB |
| PB | PS | ZR | PS | PB | PB | PB | ZR | PB | PB |
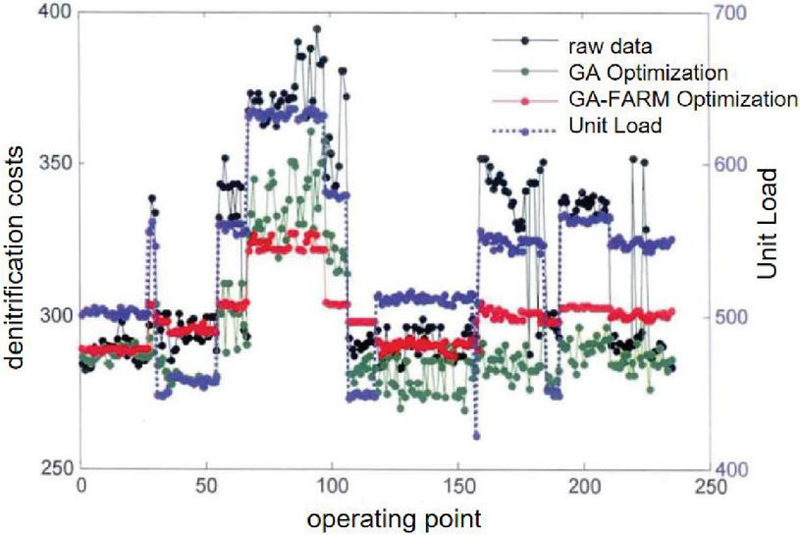
Figure 15 Comparison of raw data and optimized data.
In real-time experiments, BP-LSSVM inference averaged 0.031 seconds, while FARM inference took 0.048 seconds, yielding a total response time below 0.1 seconds. This meets the millisecond-level requirements of power plant control systems. Compared to pure genetic algorithms (44.7 seconds), the integrated optimisation significantly reduced computational time, validating the feasibility of online deployment.
The data in the OOED obtained by genetic algorithm optimization are fuzzy processed, and the parameters such as fuzzy domain, number of fuzzy sets, and affiliation function are determined. The k-means clustering algorithm is used to determine the center of the fuzzy sets of each variable, and the OOED is fuzzy. Setting the minimum support degree and confidence degree, the FARM algorithm is used to determine the fuzzy association rules and establish the fuzzy association rule base. According to the fuzzy association rule base, the denitrification economy optimization is carried out for 232 groups of selected working conditions, and the online optimal values of the adjustment variables are extracted under each load point. The values of each adjustment variable after GA-FARM optimization were substituted into the denitrification economic prediction model to calculate the denitrification cost, and compared with the original data and the data after GA optimization. The results show that the GA-FARM algorithm and GA optimization effect are close to each other, and both can reduce the denitrification cost of the unit, but the optimization time of the GA-FARM algorithm is short, which is only 0.0797 s, while the optimization time of the GA is 44.6808 s, and the GA-FARM algorithm is very suitable for online optimization. In addition, the GA-FARM algorithm optimizes the value fluctuation of each adjustment variable more gently, which can avoid the frequent action of the regulator and reduce the power generation cost to a certain extent. To verify scalability, additional experiments were conducted on a larger dataset of 1,500 load conditions. The BP-LSSVM-GA-FARM framework maintained consistent accuracy and optimization efficiency, demonstrating robustness across datasets of varying sizes and operational complexity.
5 Conclusion and Prospect
5.1 Research Conclusion
The LSSVM modeling method based on variable selection is proposed, and the BP network is used to screen the initial input variables, which reduces the model complexity. Experiments show that this method reduces the root mean square error (RMSE) and the mean relative error (MRE) in model prediction, and improves the generalization ability of the model.
On the basis of BP-LSSVM denitrification cost prediction model, the genetic algorithm based on adaptive mutation rate is used to search for optimization under the constant operation load point, and establish the optimal offline expert database OOED. the genetic algorithm adjusts the mutation rate according to the number of evolutionary generations, which improves the effect of optimization, and because of the offline operation, it is suitable for constructing a complete OOED.
Based on OOED, the online fuzzy association rule mining algorithm FARM is used to extract the association rules between the unit load and the optimal values of each adjustment variable, and construct the inference machine model. When the unit receives a new load scheduling instruction, the inference machine model can output the optimal values of each adjustment variable to make the denitrification process the most economical. Experiments show that the optimization time of the denitrification economic optimization method based on BP-LSSVM-GA-FARM is short and efficient, and the optimization time is reduced from 44.6808s to 0.0797s, and the optimization effect is close to that of the genetic algorithm, and the system can be updated and rebuilt quickly, and it only takes 0.562s to complete an update, which is suitable for the online denitrification economic optimization of thermal power units. Optimization
The control process of generating units has extremely high reliability requirements, and the execution efficiency of the optimization algorithm and the CPU occupation should be considered when carrying out online optimization operations. Traditional global optimization algorithms such as genetic algorithm, ant colony algorithm, etc., whose iterative process will take up a lot of resources of the control system of the generator set, affecting the reliability and safety of power generation of the generator set, should be carefully selected in the optimization. Despite its efficiency, the GA-FARM algorithm may face limitations in scenarios with highly dynamic operating conditions or frequent load switching, where the fuzzy rule base may need frequent updates. Additionally, while the optimization time is significantly reduced, the preprocessing steps for fuzzy rule mining still require periodic offline recalibration to maintain robustness.
5.2 Research Outlook
This study relies solely on the unit’s historical operating data for boiler denitrification economic optimization, although some abnormal data have been eliminated, the model prediction error is still large at certain operating conditions. In the future, we need to explore more effective data pre-processing methods to further improve the model accuracy. Future work may explore integrating edge-computing-enabled wireless sensor nodes to perform in-situ preprocessing and decentralized optimization. Additionally, by incorporating real-time sensing of flue gas composition and reagent levels through industrial IoT (IIoT) platforms, the model can be further refined to improve adaptive capabilities. Future deployment can leverage edge computing gateways installed at boiler control centers, where sensor data are processed locally for low-latency optimization. A real-time data flow and deployment architecture has been envisioned, including modules for wireless data acquisition, model inference, and operator interface control.
Considering variations in boiler capacity and configuration across different power plants, this study conducted additional testing on historical data from several 300–1000 MW units, building upon validation at a 660MW unit in Southwest China. Results indicate that the RMSE variation of the BP-LSSVM-GA-FARM framework across different units falls within 12%, demonstrating the model’s cross-unit generalisation capability. However, targeted optimisation remains necessary under specific coal quality conditions or extreme load fluctuations.
The historical operating data of the unit selected for the study are fixed, but the characteristics of the unit will change as the operating time of the unit increases, resulting in a decrease in the effectiveness of the optimization scheme based on the original historical data. In practical application, we can consider adding the model self-updating link, when the model prediction error exceeds a certain threshold, the latest unit historical operation data are used to re-model and optimize, in order to ensure the long-term optimization effect. In practical deployment, challenges such as real-time communication delays, logistics path interruptions, or safety thresholds in power plant control systems may arise. These constraints can be addressed by incorporating buffer-based scheduling in logistics and setting safety ranges for optimizer outputs to prevent infeasible suggestions.
References
[1] Zhao, W., Wu, Z., and Gu, Y. (2010). Combustion optimization of power plant boilers based on least squares support vector machines. Proceedings of the CSEE, (1), 1–6.
[2] Wang, C. C. (2013). Economic control of NOx concentration at the inlet of denitrification equipment. China Electric Power, (1), 86–89.
[3] Zhao, H., Wang, P. H., and Lu, L. (2008). Modeling method for thermal efficiency and NOx emission response characteristics of power plant boilers. Proceedings of the CSEE, (32), 96–100.
[4] Gu, Y., Zhao, W., and Wu, Z. (2012). An optimal MVs decision-model for boiler combustion optimization. Proceedings of the CSEE, 32(2), 39–44.
[5] Gu, Y., Zhao, W., and Wu, Z. (2011). Online adaptive least squares support vector machine and its application in utility boiler combustion optimization systems. Journal of Process Control, 21(7), 1040–1048.
[6] Smrekar, J., Assad, M., Fast, M., et al. (2009). Development of artificial neural network model for a coal-fired boiler using real plant data. Energy, 34(2), 141–152.
[7] Smrekar, J., Potocnik, P., and Senegacnik, A. (2013). Multi-step-ahead prediction of NOx emissions for a coal-based boiler. Applied Energy, 106, 89–99.
[8] Kusiak, A., and Zheng, S. (2006). Combustion efficiency optimization and virtual testing: A data-mining approach. IEEE Transactions on Industrial Informatics, 2(3), 176–184.
[9] Zhang, Q., Xu, S. S., and Wang, Z. Q. (2004). Advances and engineering applications of selective catalytic reduction flue gas denitrification technology. Thermal Power Generation, (4), 1–6.
[10] Zheng, L., Zhou, H., and Cen, K. (2004). Modeling and optimization of the NOx emission characteristics of a tangentially fired boiler with artificial neural networks. Energy, 29(1), 167–183.
[11] Lv, Y., Liu, J., and Yang, T. (2012). Nonlinear PLS integrated with error-based LSSVM and its application to NOx modeling. Industrial & Engineering Chemistry Research, 51(49), 16092–16100.
[12] Wang, C. C. (2013). Economic control of NOx concentration at the inlet of denitrification equipment. China Electric Power, (1), 86–89.
[13] Kuo, K., and Cheng, Y. (2006). Discriminating the genuineness of Chinese medicines using least squares support vector machines. Chinese Journal of Analytical Chemistry, 34(4), 561–564.
[14] Romero, C. E., Yao, Z., et al. (2009). Optimization of coal-fired boiler SCRs based on modified support vector machine models and genetic algorithms. Fuel, 88(5), 806–816.
[15] Suykens, J. A. K., and Vandewalle, J. (1999). Least squares support vector machine classifiers. Neural Processing Letters, 9(3), 293–300.
Biography

Lu Liu, a Master of Logistics Engineering and a Doctor of Economics, currently serves as the head of the Modern Logistics Management program at Yibin Vocational and Technical College in China. She presides over the construction of the college-level teaching resource repository, participates in the development of three provincial-level quality courses, leads the compilation of provincial-level planning textbooks, and teaches core courses such as “Logistics Cost Management,” “Supply Chain Management,” and “Intelligent Warehousing and Distribution.” She innovatively integrates real-world corporate projects and industry standards into the curriculum system. Based on corporate practical experience, with teaching innovation as her mission, driven by scientific research transformation, and expanded through international exchanges, she has explored a path of integrated development featuring “corporate practical experience teaching innovation scientific research transformation.” She has repeatedly received honorary titles such as “Outstanding Teacher” from colleges and universities, and in 2025, she was awarded the title of “Outstanding Teacher for Outstanding Work Achievements” in Yibin City.
Distributed Generation & Alternative Energy Journal, Vol. 41_3, 687–716
doi: 10.13052/dgaej2156-3306.4137
© 2026 River Publishers