Prediction of Remaining Life of Relay Protection Equipment Using Transformer-Holt Model
Zhenguo Ma*, Tianlei Xia, Bing Tang and Yuming Huang
Changzhou Power Supply Branch, State Grid Jiangsu Electric Power Co., Ltd, Jiangsu, 213003, China
E-mail: mazhenguo_state@sina.com
*Corresponding Author
Received 19 August 2025; Accepted 02 September 2025
Abstract
Accurately predicting the remaining service life of relay protection equipment is crucial for maintaining the stability and safety of power systems. This study proposes a prediction method, based on the Transformer-Holt model, to improve the accuracy and generalization ability of predicting the remaining life of relay protection equipment. This method combines the deep learning ability of the Transformer model and the time-series smoothing processing function of the Holt model to develop a new type of prediction model. The experimental results showed that on the Commercial Modular Aero-Propulsion System Simulation (CMAPSS) dataset, the prediction accuracy of this model reached 0.98, the prediction delay score was 0.90, and the generalization ability score was 0.95, all of which were significantly better than the comparison models. In the actual prediction scenarios, the evaluation parameters of mean square error, root mean square error, and mean absolute error of the model were 0.05, 0.21 and 0.15 respectively, demonstrating excellent performance. The proposed Transformer-Holt model provides a new technical approach to the predictive maintenance of power systems.
Keywords: Transformer-Holt model, relay protection equipment, remaining life prediction, time-frequency domain sequence.
1 Introduction
The relay protection equipment (RPE) in a power system (PS) is a key component that ensures the continuity and safety of power supply. Real-time monitoring of RPE performance status and its remaining useful life (RUL) is crucial for preventing unexpected power outages, reducing maintenance costs, and avoiding economic losses. However, due to the complexity and the variability of the operating environment, accurately predicting the RUL of RPE remains a huge challenge [1, 2]. Deep learning, as a powerful data-driven approach, has made revolutionary progress in image recognition and natural language processing. However, designing a model that can capture device operating characteristics and accurately predict future states remains a problem when applying it to RUL prediction in PS [3, 4].
In view of the limitations of traditional methods in remaining useful life prediction and the insufficiency of the application of deep learning models, reference [5] proposed a variety of deep learning methods. The research results show that the Transformer deep learning model performs exceptionally well when dealing with large-scale datasets. Its average Nash-Suttcliffe efficiency (NSE) reaches 0.72, and the average root mean square error is 32.52, significantly outperforming other models, demonstrating high efficiency and accuracy in multi-day predictions [5]. Reference [6] used intelligent algorithms to improve the precision of fault prediction models for RPE. This combined model effectively captured variable correlations, enhancing prediction accuracy [6]. Considering challenges like extreme weather, cyber-attacks, increased PS loads, and limited investment, reference [7] explored machine learning applications in PS protection. These applications cover synchronous generators, power transformers, and transmission lines. The study also discussed the opportunities and challenges associated with using machine learning [7]. To address protection maloperations during power transformer energization, reference [8] proposed a new method. It was computationally efficient and did not require special inrush current detection. This method was reliable for power transformer protection [8]. Reference [9] developed an optimized algorithm for predicting the life of residual current circuit breakers. This method avoided local optima and improves prediction accuracy. It kept the relative error below 10% when predicting pseudo-failure life, meeting engineering needs [9]. Reference [10] designed a data mining-based analysis system for RPE. It used an intelligent analysis architecture and a class-based frequent itemset mining algorithm. The research confirmed the system’s effectiveness [10].
In summary, although some progress has been made in power equipment condition monitoring and fault diagnosis in recent years, existing technologies still have shortcomings in prediction accuracy, real-time performance, and adaptability. Traditional physics model-based methods often rely on a deep understanding of device operating mechanisms, but their ability to handle complex and nonlinear problems is limited. However, although data-driven methods can provide more accurate predictions in some cases, they typically require a large amount of historical data and are not good at generalizing to new or unknown failure modes.
The proposed research aims to improve the efficiency and reliability of maintaining RPE in PSs by using innovative predictive techniques. This will reduce the risk of unexpected power outages and optimize maintenance costs. The motivation for this research stems from the importance of ensuring the safe and stable operation of PSs and the understanding of the limitations of existing prediction technologies. The goal is to provide more accurate technical support for the predictive maintenance of power equipment by combining deep learning and time-series analysis. The Transformer-Holt model [11] is proposed and verified in the study, which significantly improved the accuracy and generalization ability of predicting the remaining life of RPE. Transformer-Holt model also known as the double exponential smoothing method, is a forecasting technique widely used in time-series analysis. It was developed by Charles Holt in 1957 as an improvement on Brown’s simple exponential smoothing method. The model’s ability to perceive the status of equipment operations has been enhanced by introducing time-frequency domain data preprocessing and multi-channel attention. This provides a new technical approach for predictive maintenance of the PS and promotes technological progress in related fields.
The paper is organized as follows: The first section of the article is an introduction that highlights the importance of RPE in PSs and the necessity of accurately predicting its RUL. The second section, dealing with “Methods and Materials,” elaborates on the research methods and materials used. Firstly, the state assessment system of RPE was selected. Then, a RUL prediction model based on the Transformer architecture in the time-frequency domain is proposed. The time-series data of the Transformer in the time-frequency domain is smoothed using the Holt model. The third section, dealing with “Results,” presents the performance test and evaluation results of the Transformer-Holt model. Section four covers the conclusion, which summarizes the model’s efficiency and accuracy in predicting the RUL of RPE.
2 Methods and Materials
First, this section constructs the RPE state evaluation system. This is followed by the proposal of an RPE remaining life prediction model with the time-frequency domain Transformer architecture. Finally, the time-series data of the time-frequency domain Transformer is smoothed using the Holt model.
2.1 Selection of RPE Status Assessment System
It is crucial to implement status monitoring and life assessment to assure the reliable operation of RPE in substations. By regularly evaluating the current status of these devices, accurate information on their operation can be obtained in a timely manner. This helps prevent potential failures. It also predicts the possible failure time of equipment. This allows maintenance or replacement measures to be taken in advance. As a result, the continuity and safety of the PS are effectively guaranteed. The RPE system of the substation is shown in Figure 1.
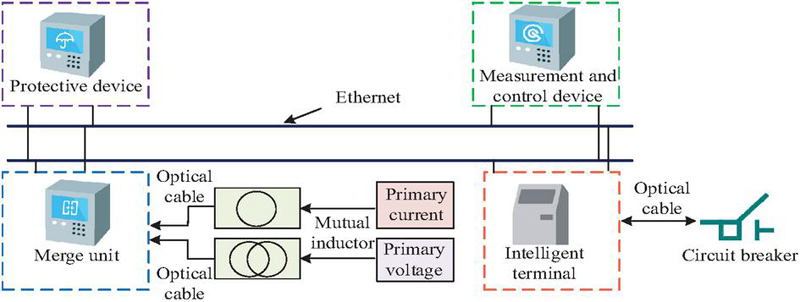
Figure 1 Substation RPE diagram.
In Figure 1, the RPE of the substation includes protection devices, monitoring tools, data integration units, intelligent interfaces, current conversion equipment, voltage conversion equipment, disconnection devices, intelligent circuit breaker equipment, data exchange equipment, transmission carriers, and time synchronization signal sources. These components work together to form a comprehensive protection and monitoring network, ensuring the safe and efficient operation of the PS. When evaluating the safety protection equipment of the PS, two main evaluation criteria can be used: maintenance related standards and operational standards. The runtime standards mainly rely on the data obtained from real-time monitoring, while maintenance related standards focus on historical operational data and maintenance archives. This study establishes an evaluation system that reflects the failure rate of electronic components in RPE. The system is based on the principles of criticality, observability, quantifiability, and actual utility. The status evaluation index system of RPE is shown in Figure 2.
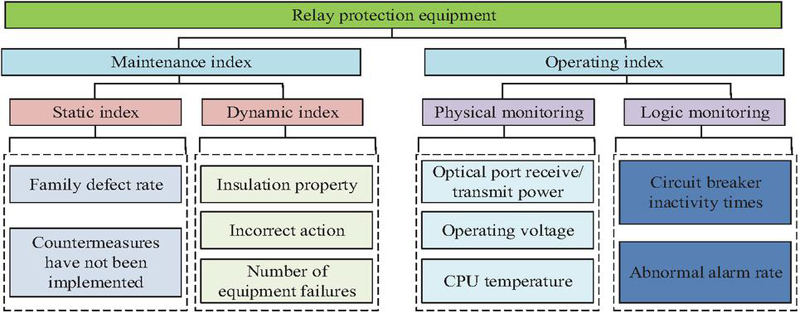
Figure 2 State evaluation index system diagram of RPE.
In Figure 2, the evaluation system not only considers the performance of the equipment in actual operation, but also integrates the historical maintenance information of the equipment to comprehensively evaluate its performance and reliability. Through this method, potential equipment failures can be predicted more accurately, thereby optimizing maintenance plans and improving the stability and safety of the PS. Additionally, the evaluation system emphasizes analyzing failure modes of electronic components. This helps identify and improve weak links in equipment design, thereby enhancing durability and reliability. When monitoring the status of safety protection equipment, it is required to obtain operational status data indicators such as processor temperature, fault frequency, operating voltage, and number of maloperations. A metric that reflects the degree of deviation between data indicators and standard values is defined as performance degradation, with a value ranging from 0 to 1. According to the performance characteristics of data indicators, they are classified into optimization type and degradation type [12, 13]. For optimized data metrics such as processor temperature, the degree of performance degradation is shown in Equation (1).
| (1) |
In Equation (1), represents the degree of performance degradation; represents the maximum limit value of the data indicator; is the actual monitored data; is the operating standard value, which is the reference value for good equipment status; is the parameter, set to 1 to reflect the impact of parameter changes on equipment status. For degraded data indicators such as insulation performance, their degree of performance degradation is shown in Equation (2).
| (2) |
In Equation (2), represents the minimum limit value of the data indicator. According to expert opinions and equipment operation experience, the equipment status contains the following classifications: “Excellent”, “Need to pay attention”, “Abnormal”, and “Faulty”. The classification of status levels is based on the degree of degradation, where the “Excellent” level corresponds to a degree of degradation between 0 and 0.2. This indicates that the performance of the equipment is close to ideal. The corresponding degradation degree of the “Need to pay attention” level is between 0.2 and 0.5, indicating a decrease in device performance and requiring attention. The “Abnormal” level corresponds to a degradation degree between 0.5 and 0.8, indicating significant issues with equipment performance that require further inspection. The “Faulty” level corresponds to a degradation degree between 0.8 and 1, indicating a serious decline in equipment performance and the possibility of a malfunction. The expected lifespan of the equipment also needs to be predicted.
2.2 RUL Prediction of RPE based on Transformer Model
After constructing the RPE state evaluation system, this study further develops a comprehensive deep life prediction method, which is mainly based on an improved time-frequency domain Transformer model. Unlike traditional step-by-step processing methods, the model proposed by the research can achieve direct prediction from initial data to RUL without the need for manual intervention or explicit feature selection. This deep learning algorithm offers several key advantages for life prediction. It simplifies the data preprocessing step, enhances the model’s adaptability to different scenarios, and reduces the need for professional domain knowledge, all while maintaining a high prediction accuracy. This method automatically extracts features from raw data, eliminating the need for tedious preprocessing and feature selection steps. This improves the efficiency of data processing and increases the model’s running speed [14, 15]. The RPE remaining life prediction framework is shown in Figure 3.
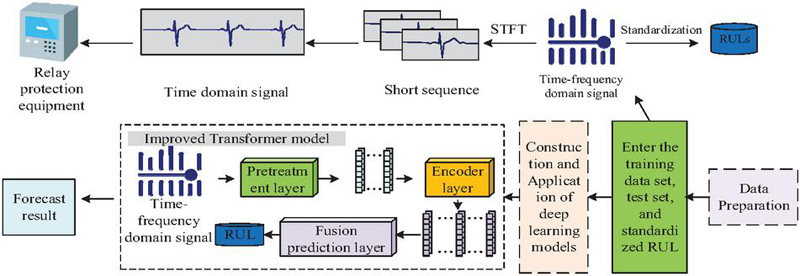
Figure 3 Residual life prediction frame diagram of RPE.
In Figure 3, the model architecture is divided into data preparation and the construction and application of deep learning models. Data preparation is a prerequisite for a model to learn and predict efficiently, covering data purification, normalization, and extraction of key information. The construction and application of deep learning models are the essence of the entire model architecture. Using carefully prepared data to cultivate the model allows it to capture the inherent patterns and correlations in the data. Then, it can calculate the expected remaining service life of mechanical equipment based on this data. In the data preparation stage, invalid or erroneous data points are carefully removed, the data is adjusted to a uniform level, and features that are crucial for the prediction task are identified. During the model construction and application phase, these optimized data are used to train deep learning models. These models can understand and simulate complex relationships in the data, thereby accurately predicting the device’s RUL. The improved Transformer-Holt model proposed in the study integrates causal convolution units and multi-channel masked self Attention Mechanism (AM) while introducing a fusion prediction unit that processes time-frequency domain data. AM is a technique in deep learning that simulates human attention allocation. By assigning different weights to different parts of the input data, the model can focus on the information that is more crucial to the task. This unit solves the shortcomings of previous models in processing such data and enhances prediction accuracy by deeply analyzing complex, multidimensional features in the degradation process [16, 17]. Figure 4 illustrates the model structure.
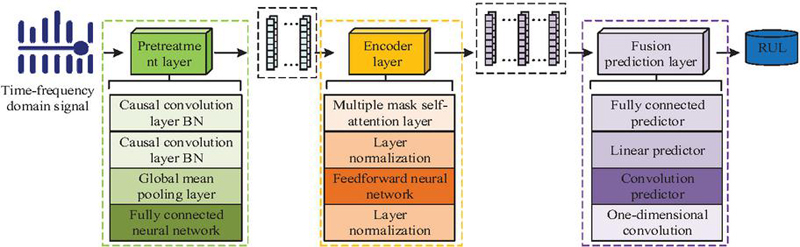
Figure 4 The Transformer-Holt model structure.
In Figure 4, the model structure includes a data preprocessing layer, an encoder layer, and a comprehensive prediction layer. The encoding layer is the backbone of the improved time-frequency domain Transformer model; this layer is responsible for in-depth encoding and modeling of time-frequency feature data. It adopts a multi-channel AM, which is composed of several different self-attention configurations, each optimized and adjusted for specific task requirements and data characteristics. Comprehensive attention combines basic AM with causal masking to shield the influence of future time steps. This ensures that the weight of time steps is retained only until the previous time step before the current one. The attention distribution is calculated by querying the similarity between query and the key value , and then weighting the numerical value to obtain a new numerical representation, as shown in Equation (3).
| (3) |
In Equation (3), is the query; is the key value; is the numerical value; and is the causal mask matrix, retaining only the time step weights before time period ( represents the time step). Local attention and local logarithmic attention are introduced into the local mask to limit the scope of AM. The score of irrelevant positions is set to negative infinity through the local mask, and then the Softmax operation is performed. Local logarithmic attention is combined with the logarithmic function to determine the local window size, improving the perception of local changes, as shown in Equation (4).
| (4) |
In Equation (4), represents element-wise multiplication; and is a local mask matrix. As shown in Equation (5), the attention distribution is sparsified using probability masks, and queries and key pairs are selectively focused to reduce computational complexity.
| (5) |
In Equation (5), represents a sparse matrix. The Fast Fourier Transform (FFT) algorithm is used in the frequency domain to capture the periodicity and frequency information of the sequence and process time-series data, as shown in Equation (6).
| (6) |
In Equation (6), is the Inverse Fourier Transform; is the Fast Fourier Transform; and is the Conjugate Fourier Transform. The integration of the AM Multihead Mask allows the model to simultaneously consider the interrelationships between different regions and attributes. The application of the mask technique ensures that information interference at subsequent time points is eliminated during the construction of integrated features, optimizing the model’s processing of time-series data [18, 19]. The comprehensive effect of this design significantly improves the performance of the model in identifying system degradation characteristics and tracking their changing trends.
2.3 Time Frequency Domain Sequence Data Processing Based on Transformer-Holt Model
The Transformer-Holt model proposed in this study has been specially optimized for the time-frequency domain to adapt to the characteristics of sequence data in this field. Due to the need for smoothing in time-frequency domain sequence data to improve analysis accuracy, the Transformer-Holt model is chosen for this optimization step. The Transformer-Holt model can effectively handle data smoothing and trend changes, providing more accurate and stable input data for Transformer models [20, 21]. One-time exponential smoothing (ES) is a time-series prediction method that is suitable for situations where the trend of data changes is relatively stable. The basic principle is to assign different weights to data at different time points, with recent data points having greater weights, to predict future values [22, 23]. Equation (7) illustrates the calculation of ES.
| (7) |
In Equation (7), is the first-order ES value of the -th time period; is the smoothing coefficient, which ranges from 0 to 1; and is the actual observation value of the -th period. When is close to 1, the model pays more attention to recent observations. When is close to 0, the model pays more attention to historical data. The second-order ES method increases the consideration of trends on the basis of first-order ES, making it adaptable to time-series with trend changes, as shown in Equation (8).
| (8) |
In Equation (8), is the smoothed value of the trend term in the -th time period; is the trend smoothing coefficient, ranging from 0 to 1; represents the quantity of backward smoothing periods; and represents the predicted value of the time period. Triple ES further considers seasonal factors and is suitable for time-series with significant seasonal changes. Specifically, it is shown in Equation (9).
| (9) |
In Equation (9), is the smoothed value of the seasonal term in the -th time period; is the length of the seasonal cycle; and is the seasonal smoothing coefficient, which ranges from 0 to 1. Figure 5 illustrates the RUL prediction process of the RPE in the Transformer-Holt model.
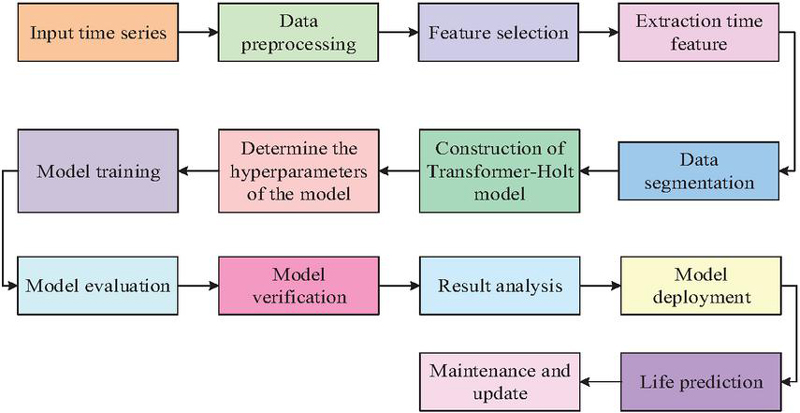
Figure 5 RUL prediction process of RPE based on Transformer-Holt model.
In Figure 5, first, the input time-series data is preprocessed, and then feature selection is performed to extract key temporal features. Then the data is segmented, and the Transformer-Holt model is constructed with its hyperparameters determined. The model is trained and evaluated to validate its predictive performance. Afterwards, the model is deployed to practical applications for life prediction and maintained and updated with feedback. In Table 1, this study selects the following evaluation indicators to evaluate the model.
Table 1 Formula table of evaluation indicators
| Indicators | Symbols | Equation | Numbering of Equation |
| Mean square error (MSE) | (10) | ||
| Weighted MSE loss | (11) | ||
| Smoothness loss | (12) | ||
| Smooth weighted mean square loss | (13) | ||
| Mean absolute error (MAE) | (14) | ||
| Root mean square error (RMSE) | (15) |
In Table 1, is the samples’ quantity; is the predicted output of the model for the -th sample; is the actual observed value of the corresponding sample; and is the weight vector. The input tensor contains elements. The error term is the difference between the predicted value and the true value. The term is the average of these errors, and is used to measure the smoothness of the model’s prediction. For time-series data, the total number of time steps is , where represents the actual RUL at time step , and is the predicted RUL value of the model.
3 Results
First, in this section the performance of the Transformer-Holt model is tested to verify its prediction accuracy and generalization ability. Next, the model is applied to the RUL prediction scenario of actual RPE. Its performance is then compared and analyzed with other models to demonstrate its superiority in practical applications.
3.1 Performance Testing and Evaluation of Transformer-Holt Model
To enable the Transformer-Holt model to perform RUL prediction for RPE, an open-source dataset CMAPSS was selected, the data was cleaned, and key features were extracted. After normalization and sliding window processing, the ratio of the training set to the validation set to the test set was 14:3:3. Next, the Transformer-Holt model was trained and the performance was monitored. The Transformer-Holt model was compared and analyzed with other models, including RUL prediction model based on Transformer, RUL prediction model based on deep convolutional neural network (DCNN), RUL prediction model based on Deep Gated Recurrent Unit (DGRU), and RUL prediction model based on long short-term memory (LSTM). The accuracy ratio and recall rates of these five models are shown in Figures 6(a) and 6(b) respectively.
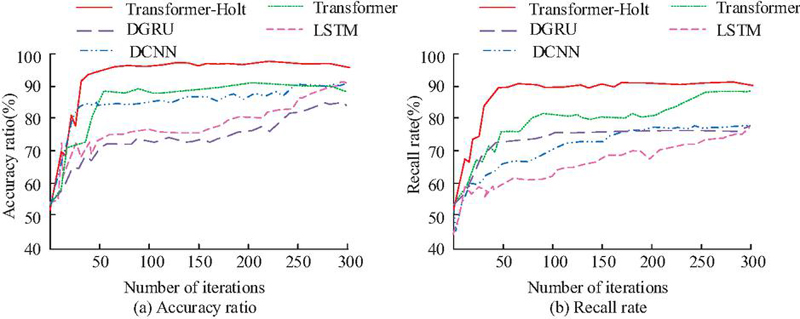
Figure 6 Accuracy of the five models recall rate.
In Figure 6(a), Transformer-Holt model exhibited the highest accuracy ratio, ultimately stabilizing at 98%, which was significantly higher than the accuracy ratio of other compared models. In Figure 6(b), the Transformer-Holt model also performed the best in terms of recall rate, ultimately stabilizing at a high level of 90%, far exceeding the recall rates of other models. This indicated that the Transformer-Holt model could not only correctly identify positive samples with extremely high accuracy, but also effectively identify almost all positive samples. This performance made the Transformer-Holt model highly reliable in prediction tasks, providing highly reliable prediction results for practical operations. Meanwhile, the model had good generalization ability when processing data and could maintain high performance on different datasets. Figure 7 compares the iterative Loss Function of the five models.
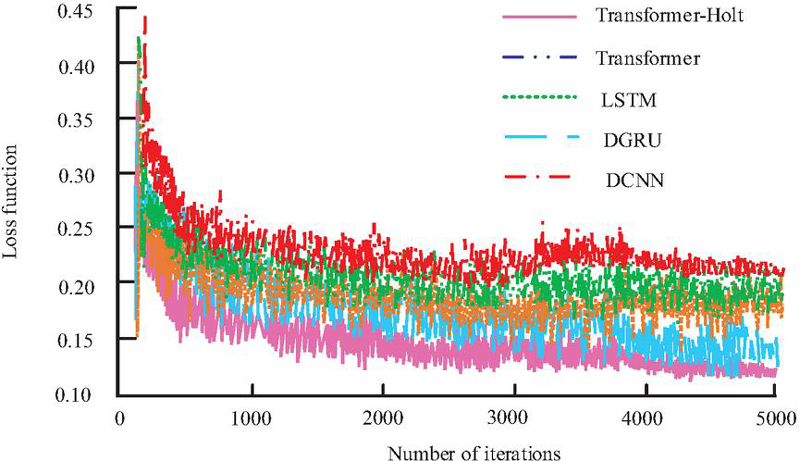
Figure 7 Iterative graphs of loss functions for five models.
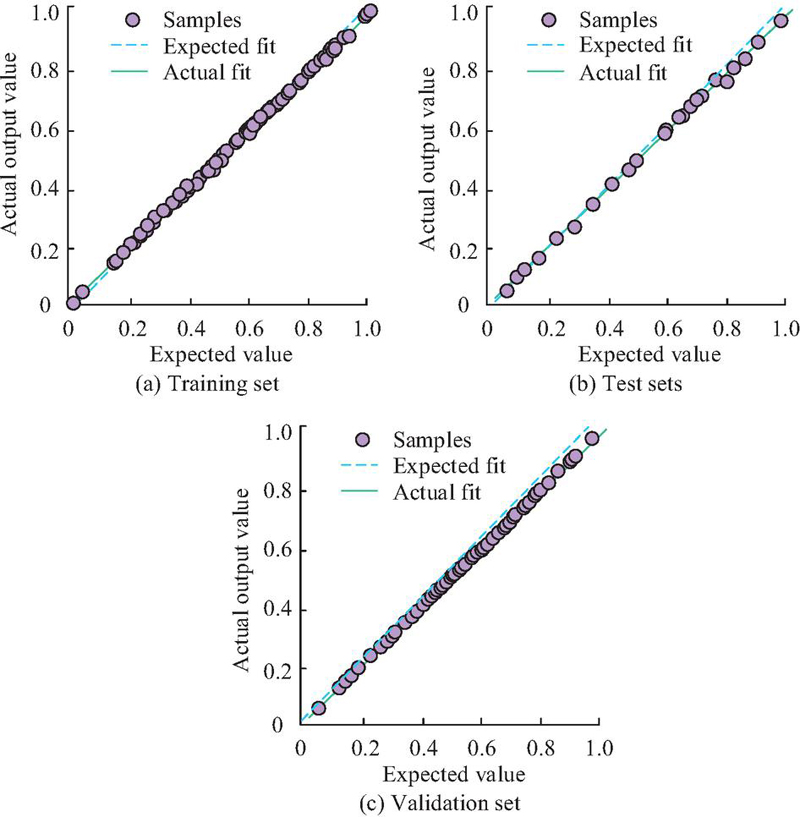
Figure 8 Regression results of Transformer-Holt model.
In Figure 7, the Loss Function value of the Transformer-Holt model successfully converged after 1000 iterations and remained below 0.20, indicating that it effectively reduced the discrepancy of predicted and actual values. The low Loss Function value indicated that the Transformer-Holt model had high prediction accuracy, as it could generate prediction results that were very close to real data. In addition, the fast convergence of the Transformer-Holt model also demonstrated the efficiency and stability of its algorithm. Transformer-Holt model not only performed well in prediction accuracy, but also showed fast convergence speed and good generalization ability during the training process. Therefore, the Transformer-Holt model was suitable for practical applications, especially in scenarios that required fast and accurate prediction. Figure 8 shows the regression results of the Transformer-Holt model.
In Figure 8(a), the Transformer-Holt model showed good approximation ability for the predicted RUL values, indicating that it could obtain the specific values of the RUL, and the predicted results were highly consistent with the actual situation. In Figure 8(b), the regression analysis of the Transformer-Holt on the test set showed a high correlation, with a small fitting deviation and a very high correlation coefficient, which was close to 1. This was a strong positive correlation. In Figure 8(c), the Transformer-Holt model also demonstrated good fitting performance on the validation set, with a fitting degree of 0.9 or above. It not only performed well on training data, but also adapted well to unseen data. Figures 9(a) and 9(b) shows the RMSE and MAE indicators respectively of all five models.
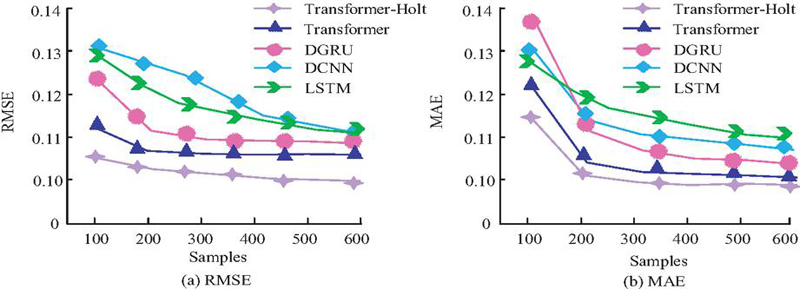
Figure 9 Comparison of RMSE and MAE indicators of five models.
In Figure 9(a), the RMSE value of the Transformer-Holt model remained below 0.11, significantly lower than the 0.13 of DCNN. In Figure 9(b), the MAE value of the Transformer-Holt also remained below 0.12. The low RMSE and MAE values indicated that the Transformer-Holt model produced robust predictions of RPE RUL with small differences between predicted and actual values. The ability to maintain low error values under different error metrics demonstrated the reliability and effectiveness of the Transformer-Holt model in practical applications.
3.2 Analysis of the Actual Application Effect of Transformer-Holt model
The Transformer-Holt model and several other comparative models were applied to a 110 kV substation for RUL prediction of its RPE. The indicators obtained by all the five models in the RUL prediction process were compared and analyzed. In Table 2, the prediction time, prediction accuracy, prediction delay, generalization ability, and user satisfaction indicators were normalized.
Table 2 Comparison results of indicators in actual RUL prediction
| Model Type | Transformer-Holt | Transformer | DCNN | DGRU | LSTM |
| Prediction time | 0.95 | 0.75 | 0.85 | 0.70 | 0.60 |
| Prediction accuracy | 0.98 | 0.90 | 0.88 | 0.80 | 0.75 |
| Prediction delay | 0.90 | 0.65 | 0.70 | 0.60 | 0.50 |
| Generalization ability | 0.95 | 0.85 | 0.80 | 0.85 | 0.81 |
| User satisfaction | 0.95 | 0.89 | 0.85 | 0.80 | 0.75 |
| MSE | 0.05 | 0.07 | 0.09 | 0.10 | 0.12 |
| RMSE | 0.21 | 0.24 | 0.26 | 0.28 | 0.30 |
| MAE | 0.15 | 0.18 | 0.20 | 0.22 | 0.25 |
In Table 2, the Transformer-Holt model performed well in RUL prediction tasks, achieving a prediction accuracy of 0.98, significantly surpassing other models, indicating its high reliability in prediction accuracy. The Transformer-Holt model scored 0.90 in prediction latency, indicating that it could quickly provide prediction results with extremely low latency. In terms of generalization ability, the Transformer-Holt model score was 0.95, which demonstrated its strong adaptability and stability on unknown data. In addition, Transformer-Holt model achieved low error values of 0.05, 0.21, and 0.15 in MSE, RMSE, and MAE respectively, further verifying its accuracy in prediction. The user satisfaction score was 0.95, which reflected the high recognition of the Transformer-Holt model prediction results by users. Figure 10 shows the actual RUL prediction of the Transformer-Holt model.
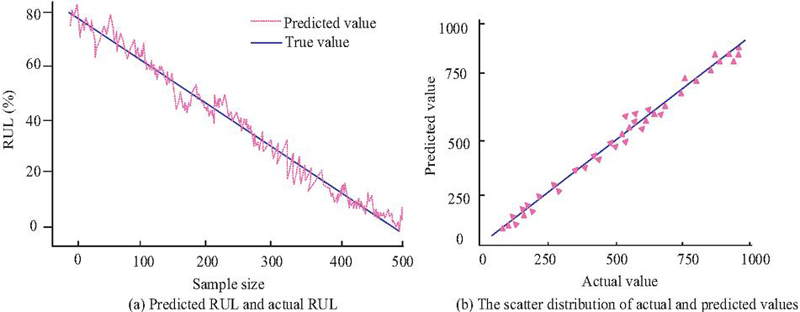
Figure 10 The actual RUL prediction of Transformer-Holt model.
In Figure 10(a), the low RMSE and MAE values suggest that the Transformer-Holt model reliably predicts RPE RUL, with minimal discrepancy between the predicted and actual values. Figure 10(b) shows that the Transformer-Holt model had a relatively small fitting deviation and a very high correlation coefficient of 0.99, close to 1. This indicated a strong positive correlation and confirmed the model’s reliability and accuracy in predicting RUL. The prediction results of Transformer-Holt model could accurately reflect the RUL of the device.
4 Conclusion
To develop a RUL prediction method for RPE in PS, this study constructed a Transformer-Holt model that optimizes time-frequency domain data to achieve efficient RUL prediction for RPE. The Transformer-Holt model achieved significant predictive performance on CMAPSS, with a prediction accuracy of up to 0.98, MSE, RMSE, and MAE of 0.05, 0.21, and 0.15 respectively, all of which were significantly better than the comparison models. The Transformer-Holt model also performed well in prediction latency and generalization ability, with scores of 0.90 and 0.95 respectively. It could not only quickly and accurately predict RUL, but also adapted to different datasets, demonstrating good generalization performance. The fitting deviation of the Transformer-Holt model was relatively small, with a correlation coefficient of 0.99, indicating that its prediction results could accurately reflect the remaining service life of the equipment. The Transformer-Holt model had high efficiency and accuracy in RUL prediction. However, further research is needed on the data sensitivity of the Transformer-Holt model in extreme situations, and it may face challenges in terms of data quality and integrity in practical deployment. Future work will further optimize model algorithms to reduce computational resource consumption and enhance the potential of models in real-time prediction scenarios.
Fundings
The research is supported by Research on Substation Equipment Maintenance Strategies and Cycle Management Based on Big Data and Artificial Intelligence Technology, Science and Technology Project of State Grid Jiangsu Electric Power Co., Ltd. (J2021102).
References
[1] Padmanaban S, Khalili M, Nasab M A, Zand M, Shamim A G, Khan B. Determination of power transformers health index using parameters affecting the transformer’s life. IETE Journal of Research, 2023, 69(11): 8467–8488.
[2] Hussein R I H, Gökºenli N, Bektaº E. Enhanced Transformer Protection Using Fuzzy-Logic-Integrated Differential Relays: A Comparative Study with Rule-based Methods. Journal of Robotics and Control (JRC), 2024, 5(5): 1299–1310.
[3] Subramaniam A, Sahoo A, Manohar S S, Raman S J, Panda S K. Switchgear condition assessment and lifecycle management: Standards, failure statistics, condition assessment, partial discharge analysis, maintenance approaches, and future trends. IEEE Electrical Insulation Magazine, 2021, 37(3): 27–41.
[4] Chen X, Hu Y, Dong Z, Zheng P, Wei J. Transformer operating state monitoring system based on wireless sensor networks. IEEE Sensors Journal, 2021, 21(22): 25098–25105.
[5] Madhushanka G W T I, Jayasinghe M T R, Rajapakse R A. Multiple-Day-Ahead Flood Prediction in the South Asian Tropical Zone Using Deep Learning. Journal of Hydrologic Engineering, 2025, 30(1):4024054.1–4024054.13.
[6] Yuming H, Jiaohong L, Zhenguo M, Bing T, Keqi Z, Jianyong Z. On combined PSO-SVM models in fault prediction of relay protection equipment. Circuits, Systems, and Signal Processing, 2023, 42(2): 875–891.
[7] Aminifar F, Abedini M, Amraee T, Jafarian P, Samimi M H, Shahidehpour M. A review of power system protection and asset management with machine learning techniques. Energy Systems, 2022, 13(4): 855–892.
[8] Peng F, Gao H, Huang J, Guo Y, Liu Y, Zhang Y. Power differential protection for transformer based on fault component network. IEEE Transactions on Power Delivery, 2023, 38(4): 2464–2477.
[9] Liu G, Miao J, Zhao X, Wang Z, Li X. Life prediction of residual current circuit breaker with overcurrent protection based on BP neural network optimized by genetic algorithm. Journal of Electrical Engineering & Technology, 2022, 17(3): 2003–2014.
[10] Suo N, Zhou Z. Computer assistance analysis of power grid relay protection based on data mining. Computer-Aided Design and Applications, 2021, 18(S4): 61–71.
[11] Arnautalić S, Mujèinagić E H, Petrović S. Influence of Current Transformer Saturation on Numerical Protection Relays–A Case Study of Circuit Breaker Failure Protection. B&H Electrical Engineering, 2021, 15(2): 78–85.
[12] Sharma H C, Gupta Y K, Atri S K, Singhal P K, Bhanage R M, Dixit V K, Basu A. Approach & experience of iot based predictive maintenance technologies in power distribution network. Journal International Association on Electricity Generation, Transmission and Distribution, 2021, 34(1): 15–22.
[13] Parvez J, Khan S, Khan I. Real-time monitoring system of power transformer using IoT and GSM. J. Mech. Continua Math. Sci., 2021, 16(9): 1–15.
[14] Dapshima B A. A fault detection and protection scheme for a 150 MVA transformer using fuzzy. International Journal of Advances in Engineering and Management, 2022, 4(11): 503–512.
[15] Jawady N, Ibrahim M A, Khalaf L A, Khalaf L A, Abed M N. An intelligent overcurrent relay to protect transmission lines based on artificial neural network. International Journal of Power Electronics and Drive Systems (IJPEDS), 2023, 14(2): 1290–1299.
[16] Arora R K, Batra S K. Significance of Condition Monitoring of Electrical Equipment in Transmission & Distribution System. Water and Energy International, 2024, 67(2): 34–42.
[17] Ghosh S, Dutta S. Ensemble machine learning methods for better dynamic assessment of transformer status. Journal of The Institution of Engineers (India): Series B, 2021, 102(5): 1113–1122.
[18] Shaikh S, Soomar A M, Shah S H H. Coordination of protective relays in the substation. International Journal of Power Electronics and Drive Systems (IJPEDS), 2023, 14(3): 1471–1478.
[19] Chen H, Meng L, Xi Y, Xin M, Yu S, Chen G, Chen Y. GRU based time series forecast of oil temperature in power transformer. Distributed Generation & Alternative Energy Journal, 2023, 38(2): 393–412.
[20] Sheikh A H, Bakhsh F I. Optimal power flow through variable frequency transformer using different optimization techniques. Distributed Generation & Alternative Energy Journal, 2022, 37(4): 1129–1158.
[21] Gheisari M, Hamidpour H, Liu Y, Saedi P, Raza A, Jalili A, Rokhsati H, Amin R. Data Mining Techniques for Web Mining: A Survey. Artificial Intelligence and Applications, 2023, 1(1): 3–10.
[22] Qin Y, Chen D, Xiang S, Zhu C. Gated dual attention unit neural networks for remaining useful life prediction of rolling bearings. IEEE Transactions on Industrial Informatics, 2020, 17(9): 6438–6447.
[23] Harinaik S, Sathyan S. Design and analysis of quasi-Y source high gain DC/DC resonant converter for renewable energy applications. Distributed Generation & Alternative Energy Journal, 2023, 38(2): 569–594.
Biographies

Zhenguo Ma received the B.S. degree in electrical engineering from Xi’an Jiaotong University in 1998. His research areas include power system operation, high voltage and insulation technology, electrical equipment, and life-cycle management of equipment.

Tianlei Xia received the master’s degree in electrical engineering from Zhejiang University in 2016. His research interests include power system information modeling,power system simulation,and relay protection.

Bing Tang graduated from Huazhong University of Science and Technology with a major in Electrical Engineering. Since 2018, he has been working at State Grid Changzhou Company in the field of relay protection. His research focus is on the maintenance of electrical equipment.

Yuming Huang is currently a Senior Engineer at State Grid Changzhou Electric Power Supply Company, dedicated to professional work in power system relay protection. His research focuses on fault prediction of power system relay protection equipment and the development of intelligent maintenance algorithms.
Distributed Generation & Alternative Energy Journal, Vol. 41_1, 101–122
doi: 10.13052/dgaej2156-3306.4115
© 2026 River Publishers