Resilience Improvement for Distributed Renewable Energy Grids: Integration of UAV-Assisted Live-Line Inspection and Real-Time Systems
Zhe Sun, Ruixue Yu*, Guiqi Zhu and Qi Xue
Training Center of State Grid Shaanxi Electric Power Co., Ltd. Xi’an 710032, China
E-mail: 18509160535@163.com
*Corresponding Author
Received 13 October 2025; Accepted 17 December 2025
Abstract
In the context of global energy transition, distributed renewable energy grids face key issues of insufficient resilience due to frequent equipment failures, complex operating environments, and limitations of traditional operation and maintenance methods. The core objective of this study is to enhance the resilience of this type of power grid, integrate unmanned aerial vehicle assisted live inspection and real-time fault diagnosis technology, and construct a full process solution. In the inspection process, a multi rotor drone equipped with high-definition cameras, infrared thermal imaging devices, and partial discharge sensors is used to conduct uninterrupted inspections of power grid equipment at a flight altitude of 20150 m and a speed of 38 m/s. Multiple sources of data such as equipment appearance defects and hot spot distribution are collected 2–4 times a week, covering areas that are difficult for manual access. This significantly improves the efficiency of traditional inspections and provides high timeliness data support for fault diagnosis. Fault diagnosis fusion deep learning technology embeds the Convolutional Block Attention Module (CBAM) into the YOLOv7 model to enhance feature focus, constructs a dual channel Generative Adversarial Network (GAN) combined with Long Short-Term Memory (LSTM) to capture fault timing patterns, and designs a sliding window error correction mechanism to counteract noise interference. In the experiment, the accuracy and recall of this method reached 88.62% mAP@0.5 Significantly superior to existing methods such as BVLOS and SIS. The research results provide strong technical support for the safe and stable operation of distributed renewable energy grids, which helps to improve the reliability and anti-interference ability of the grid, promote the sustainable development of distributed renewable energy grids, and is of great significance for ensuring energy security and addressing climate change.
Keywords: Collaborative inspection of drone clusters, smart grid system, fault diagnosis, elastic assessment system, multi energy complementary system.
1 Introduction
Against the backdrop of global energy structure transformation and continuous promotion of carbon neutrality goals, distributed renewable energy is gradually becoming an important component of the power system due to its advantages such as cleanliness, flexibility, and on-site consumption [1]. With the continuous increase in the penetration rate of distributed energy, the traditional power grid structure and operation mode dominated by centralized power generation are facing profound challenges [2, 3]. Distributed power generation has significant intermittency, volatility, and spatial dispersion. Its large-scale integration not only changes the unidirectional transmission mode of power flow, but also introduces more complex issues such as voltage control, frequency stability, and fault isolation [4]. Especially in scenarios where a high proportion of renewable energy is connected to the grid, the operating environment of the power grid is becoming increasingly complex, and the probability of equipment failure is increasing [5]. Traditional operation and maintenance models are no longer able to meet the requirements of safe, reliable, and economical operation, and the problem of insufficient “resilience” of the power grid is becoming increasingly prominent.
Grid resilience refers to the ability of the power system to resist disturbances, absorb shocks, quickly recover, and adapt to new operating conditions when subjected to disturbances [6]. For distributed renewable energy grids, resilience is not only related to power supply continuity, but also directly affects the consumption efficiency of renewable energy and the long-term stability of the system [7]. The current distributed power grid still faces multiple constraints in terms of resilience improvement, with equipment widely distributed and mostly located in complex environments such as the wild, rooftops, and mountains [8]. Traditional manual inspection methods have problems such as low efficiency, high risk, and difficult coverage, making it difficult to detect equipment hazards in a timely manner [9]. There are various types of faults and complex evolution mechanisms, including traditional electrical equipment faults and new equipment faults such as photovoltaic panel hot spots and fan blade cracks. Existing diagnostic methods have shortcomings in real-time, accuracy, and adaptability [10]. The system lacks the ability to integrate and collaboratively analyze multi-source information, making it difficult to achieve the transition from “post maintenance” to “pre warning” operation and maintenance mode. Therefore, how to achieve real-time perception of the power grid status, rapid diagnosis of faults, and autonomous recovery of the system through technological means has become a key issue in improving the resilience of distributed renewable energy power grids [11, 12].
Drones have the characteristics of maneuverability, wide field of view, and the ability to carry multiple sensors. They can adapt to complex terrain and environments, achieve non-contact and uninterrupted live inspections, and significantly improve the breadth, frequency, and safety of data collection [13]. By integrating sensors such as visible light, infrared thermal imaging, ultraviolet discharge detection, and laser radar, drones can synchronously obtain multi-dimensional information such as device appearance, temperature distribution, insulation status, and three-dimensional structure, forming high spatiotemporal resolution panoramic data of device status [14]. This provides an unprecedented data foundation for subsequent fault identification, health assessment, and predictive maintenance. At the same time, artificial intelligence methods, especially deep learning techniques, have demonstrated powerful performance in image recognition, temporal prediction, and anomaly detection, providing technical possibilities for automatically and accurately extracting fault features, identifying fault types, and locating fault locations from massive inspection data. By combining deep learning models such as Convolutional Neural Networks (CNN), attention mechanisms, Long Short-Term Memory Networks (LSTM), etc. with unmanned aerial vehicle inspection data, it is expected to build a real-time and intelligent fault diagnosis and warning system.
It is worth noting that the application of a single technology is difficult to fully meet the systematic demand for improving the resilience of distributed power grids [15]. The elasticity of the power grid runs through the entire cycle, requiring a deep integration of advanced inspection methods, intelligent diagnostic algorithms, and the operation control, planning, and management of the power grid. Drone inspection is not only used to discover existing defects, but its data should also serve system vulnerability assessment, fault evolution prediction, and recovery strategy formulation. Intelligent diagnostic algorithms not only need to achieve high-precision classification, but also should have the ability to adaptively learn unknown fault types, and after diagnosis, they should be able to form a closed loop with systems such as power grid protection control and network reconstruction [16]. With the development of distributed energy clustering and scale, future power grid operation and maintenance may involve more complex collaborative operation modes such as multi drone collaboration, drone ground equipment linkage, digital twin simulation, etc., which puts higher requirements on scheduling algorithms, communication architecture, and system integration. Conducting research on the resilience enhancement of distributed renewable energy grids based on unmanned aerial vehicle assisted live inspection and real-time fault diagnosis(The total response time from data collection to fault type recognition completion does not exceed 15 seconds, with drone data return delay controlled within 3 seconds and diagnostic algorithm processing time not exceeding 12 seconds) has important theoretical significance and application value. This not only helps to improve the operational efficiency and power supply reliability of distributed renewable energy grids, but also provides technical support for the safe access and effective consumption of large-scale distributed energy, promoting energy transformation and sustainable development processes.
This study is based on the forefront of technology and practical needs in this field, aiming to construct a full process solution covering state perception, intelligent diagnosis, resilience evaluation, and strategy generation through the deep integration of unmanned aerial vehicle assisted live inspection and artificial intelligence driven real-time fault diagnosis technology. The research not only focuses on improving inspection efficiency and diagnostic accuracy, but also aims to explore how to organically embed these two core technologies into the operation and maintenance system of the power grid, thereby systematically enhancing the anti-interference, recovery, and adaptability of the power grid in dealing with internal faults and external disturbances.
The structure of this article: The second part of the paper analyzes the existing fault diagnosis techniques for power grids. The third part integrates distributable requirements with deep learning to establish a new fault diagnosis method. The fourth part conducts experiments. The fifth part combines the limitations and advantages of the previous analysis, and explains future research directions.
2 Literature Review
Against the backdrop of large-scale integration of distributed renewable energy into the power grid, enhancing grid resilience to cope with complex and changing operating environments and potential faults has become a key issue in ensuring the safe and stable operation of the power grid. Currently, numerous scholars have conducted research on power grid inspection, fault diagnosis, and resilience enhancement, providing a rich theoretical foundation and practical reference for the research on distributed renewable energy power grid resilience enhancement based on unmanned aerial vehicle assisted live inspection and real-time fault diagnosis in this paper.
Li et al. [17] designed an autonomous drone detection system based on object detection. Compared with the original YOLOX_tiny, the new model improved the mAP_0.5:0.95 index by about 2% when running at a speed of 56 frames per second on Nvidia NX, and significantly reduced the number of parameters and calculations. This system can effectively solve the problem of target deviation from the center of the image when unmanned aerial vehicles take photos during high-altitude autonomous inspection, and has been verified by many practical flight experiments.
Guan H et al. [18] conducted a contemporary review of the most advanced drone-based detection and discussed a potential concept of intelligent power line detection supported by LiDAR. Overall, the standardized protocol for intelligent power line detection supported by LiDAR includes four data analysis steps, namely point cloud classification, key point extraction, route generation, and fault detection.
Kaitouni S I et al. [19] studied the DT of five building attached photovoltaic (BAPV) systems installed in a solar village in Benguela, Morocco. The 3D model was generated on the Rhinoceros platform, and the solar AC power output of each photovoltaic system was calculated using a ladybug plugin integrated statistical model in a grasshopper environment. In addition, data evaluation and visualization are processed through Python. Then, a hybrid fault detection and diagnosis (FDD) method based on models and data-driven approaches was proposed, utilizing monitoring and inspection techniques such as remote sensors (RS) and real-time solar production monitoring systems to identify and isolate anomalies in decentralized solar photovoltaic systems at the urban scale.
Roshanski et al. [20] addressed this challenge by utilizing real data from the Aero Sentinel military drone Sentinel G2 quadcopter. These data were collected in collaboration with Maris Tech Ltd, using their advanced Mercury Nano system to capture detailed communication between the drone and its control unit. Developed and evaluated a correlation-based algorithm specifically tailored to the unique complexity of drone sensor data.
Arenella et al. [21] proposed a method for automatically detecting hotspots in photovoltaic panels by analyzing thermal image sequences installed on drones. The main novelty of the proposed method lies in the combination of color-based information and model-based information commonly used in general methods, which greatly reduces the number of false positives detected. The experiment has confirmed the effectiveness and efficiency of the proposed method in terms of accuracy and processing time.
Existing research has achieved certain results in power grid inspection, fault diagnosis, and resilience improvement, but there are still many shortcomings. This article combines unmanned aerial vehicle assisted live inspection with real-time fault diagnosis to propose a systematic distributed renewable energy grid resilience enhancement scheme, which has important theoretical significance and practical value.
3 Real Time Fault Detection and Resilience Enhancement System for Power Grid
3.1 Unmanned Aerial Vehicle Live Inspection Technology
As an interdisciplinary advanced detection method, drone live inspection technology integrates the technological advantages of remote sensing, telemetry, automation control [22, 23], image processing, and machine learning, and has demonstrated significant effectiveness in the operation and management of distributed renewable energy grids.
This technology deploys unmanned aerial vehicles equipped with high-definition cameras, infrared thermal imaging modules, ultraviolet detectors, and partial discharge sensors and other diversified precision instruments [24]. Based on the preset refined flight path, it collects data from power grid lines and equipment in close range and all directions without power outage, covering key parameters such as equipment appearance images, temperature distribution, partial discharge phenomena, and insulation status [25].
The massive data obtained is instantly transmitted to the ground control center through high-speed real-time communication links, and is intelligently analyzed by operation and maintenance experts using deep learning algorithms [26]. This includes using convolutional neural networks (CNN) to accurately identify external abnormalities such as insulator damage and wire breakage, using generative adversarial networks (GAN) to enhance weak power signal detection for early warning of internal partial discharge risks, and using support vector machines (SVM) to analyze temperature field changes to identify potential faults such as joint overheating, thereby achieving real-time and accurate diagnosis of power grid faults.
Compared to traditional manual inspections, this technology significantly reduces the safety risks of high-altitude operations, overcomes terrain limitations and efficiency bottlenecks, and is particularly capable of capturing new fault characteristics brought about by distributed energy access, such as partial discharge caused by hidden cracks in photovoltaic panels and flashover signs caused by wind power access, providing fine-grained and highly timely monitoring and warning support for the power grid. In emergency situations such as extreme weather or equipment failures, drone technology can quickly locate the fault point and collaborate with smart grid self-healing control strategies to achieve rapid isolation and power restoration of faults, significantly improving the resilience and self-healing ability of the power grid to deal with complex faults. It is one of the core technologies to ensure the stable operation of distributed renewable energy grids and promote energy transformation.
3.2 Target Recognition of Power Grid Faults Based on Improved YOLOv7
3.2.1 CBAM attention mechanism
This study aims to deeply integrate the Convolutional Block Attention Module (CBAM) into the underlying model architecture to improve performance. For the input data, firstly, in the channel attention submodule, the global contextual information between channels is captured in parallel through global average pooling and max pooling. The shared multi-layer perceptron (MLP) is used to generate channel weights and enhance the expression ability of key semantic feature channels. Then, in the spatial attention submodule, the optimized feature maps of channel attention are subjected to average pooling and max pooling operations along the channel dimension. After concatenation, a spatial weight mask is generated through a convolutional layer, focusing on the target area and suppressing background noise interference. Through this cascaded channel space attention mechanism, CBAM can adaptively recalibrate feature responses, enabling the model to accurately locate key information in complex scenes, ultimately achieving significant improvements in classification accuracy or semantic matching through end-to-end training. The structure of the CBAM module is shown in Figure 1.
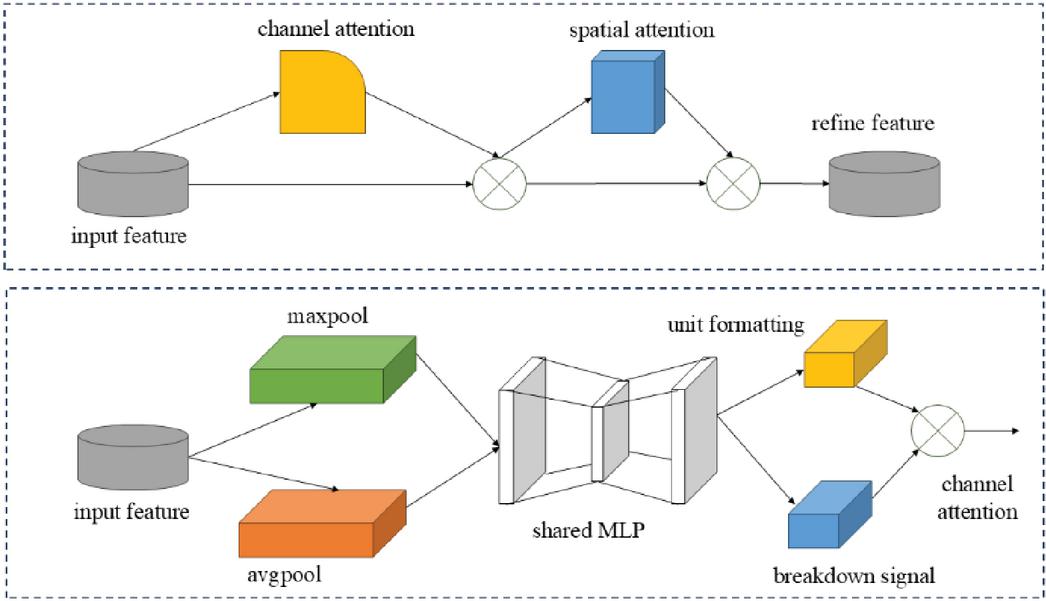
Figure 1 CBAM module structure.
The input feature map is represented as . CBAM sequentially derives the one-dimensional channel attention map and the two-dimensional spatial attention map . The entire attention process can be summarized as follows:
| (1) | ||
| (2) |
Where represents element multiplication, represents the first output, and represents the final output [27].
The innovation of CBAM lies in the use of mean pooling and max pooling operations to aggregate spatial information of feature maps. The CBAM submodule compresses the input feature map along the spatial dimension, and then performs max pooling and average pooling operations. Next, the generated results will be fed into a shared network to form a channel attention map, which is then multiplied with the feature map to highlight key target features [28, 29].
| (3) |
Among them, F represents the input feature map, AvgPool represents global average pooling, MaxPool represents max pooling, MLP represents multi-layer perceptron, and is the Sigmoid activation function.
Segment Anything Model(SAM) aggregates the channel information of feature maps through two pooling operations to generate two two-dimensional maps. The SAM submodule takes channel attention maps as input feature maps, first compresses them in the channel dimension, and then performs max pooling and average pooling operations sequentially. Concatenate these two results along the channel and form a spatial attention map through a 7 7 convolution operation. The spatial attention map is then multiplied with the feature map to emphasize the important positional information of the target.
| (4) |
Where f7 7 represents a 7 7 convolution.
This study utilized the Interactive Channel Spatial Attention Mechanism (I-CSAM), which mainly consists of two parts: Channel Attention (CA) and Spatial Attention (SA). Given an intermediate feature map F as input, the channel attention module (CA) first derives a 1D channel attention map Mc. Then, Mc is multiplied element by element with the input feature F, and the resulting channel attention values are broadcasted in the spatial dimension to obtain fine features Fc with channel attention. Next, the spatial attention module (SA) processes Fc to generate a 3D spatial attention map Ms. Finally, the output feature is obtained by multiplying Ms with Fc element by element.
| (5) |
In the design of channel attention mechanism (CA), its core structure is similar to CBAM. This module first uses two global pooling operations to condense the spatial features of the feature map, and then uses a shared convolutional layer to transform these spatial features. Finally, it outputs the channel attention feature map after weight adjustment.
| (6) |
Among them, F represents the feature map, FGMP and FGAP represent global max pooling and global average pooling, and Fsc represents shared convolution, which is a two-layer 1x1 convolutional network with an hourglass shape. The first layer is used to compress dimensions, and the second layer is used to recover dimensions. represents the Sigmoid function. After channel enhancement, a depth wise separable convolution structure is used to extract spatial correlations between features, and a multi-scale structure is introduced to enhance the ability of convolution operations to capture spatial relationships, thereby achieving spatial enhancement [30].
| (7) |
Among them, DSConv represents depth wise separable convolution, and Branchi, represents the i branch. SA represents spatial distribution information, and then SA is multiplied by the input feature map F to achieve adaptive feature refinement. Subsequently, the refined feature map is added element by element to the input feature map to obtain an enhanced feature map. Finally, add the two enhanced feature maps together to obtain the output FDM.
A multi machine collaborative scheduling algorithm based on dynamic task partitioning and path optimization was studied and designed. According to the power grid topology, equipment failure risk level, and real-time meteorological conditions, the inspection area was divided into multiple sub task blocks. The improved ant colony algorithm was used to achieve multi drone task allocation and path planning, and communication delay and collision avoidance constraints were introduced to ensure the safety of collaborative operations. At the same time, simulation comparative experiments were conducted to analyze the improvement effects of multi machine collaboration compared to single machine inspection in terms of coverage, data collection timeliness, and fault response time, significantly enhancing the real-time monitoring and diagnostic capabilities of wide area distributed power grids. The supplementation of relevant content has improved the overall architecture of the system and enhanced the completeness and practicality of the research.
3.2.2 Target detection loss function setting
In the original YOLOv7, Complete Intersection over Union(CIoU) was used as the bounding box regression loss function for the original model. In the equation, 2 (b, bgt) represents the Euclidean distance between the center points of the predicted box and the real box in the detection image, and c is the diagonal distance of the smallest bounding rectangle that includes both the predicted box and the real box. is a weight balance parameter used to balance the impact of different shapes, while optimizing the aspect ratio of the predicted box and the real box to make the shape of the predicted box closer to the real box. is a parameter used to measure the consistency of the aspect ratio between the predicted box and the real box. b is the target predicted box, bgt is the target real box, w and h are the width and height of the target predicted box, and wgt and hgt are the width and height of the target real box.
| (8) | |
| (9) | |
| (10) | |
| (11) |
CIoU has added loss functions for the length and width of the target detection box based on the previous loss function. This allows for the adjustment of the predicted box by optimizing the distance and aspect ratio of the center, even if the predicted box and the real box do not intersect at all [31, 32]. This ensures that divergence does not occur during the training process.
Research introduces Focal loss function to address the limitations of traditional cross entropy loss in uneven sample distribution or difficult sample differentiation. In response to the problem of class imbalance or significant differences between difficult and easy samples in the dataset [33]. Focal loss dynamically adjusts weight coefficients to apply a smaller loss contribution to easy to classify samples (such as background regions or high-frequency categories), while focusing on optimizing difficult to classify samples (such as occluded targets or rare categories).
| (12) | ||
| (15) |
In the formula, y is the label value of the sample, p is the probability of predicting that the sample is a positive sample. If the label value of the sample is 1, it is a positive sample, otherwise it is a negative sample. In the loss calculation, a modulation factor is introduced (where pt is the model’s prediction probability of the true category, and is an adjustable hyperparameter). When the sample is misclassified (pt is small), the modulation factor approaches 1 and the loss is basically not affected. When the sample is correctly classified (pt is large), the modulation factor significantly reduces the loss weight, forcing the model to focus more on difficult samples with classification errors. Through this mechanism, Focal loss can effectively alleviate model bias caused by class imbalance, improve recognition ability for minority classes or difficult samples, and ultimately achieve higher and more robust generalization performance on the test set.
| (16) |
In the formula, is taken as the weight factor for positive samples, and is taken as the weight factor for negative samples. That is, when there are more negative samples, the weight assigned becomes smaller to solve the problem of imbalance between positive and negative samples. At the same time, is added as the weight factor. When and approaches 1 in the formula, it is a distinguishable sample, and the value of the weight factor tends to approach.
3.3 Real Time Fault Diagnosis Method Based on Generative Adversarial Network
A dual channel generative adversarial network was designed for the spatiotemporal coupling characteristics of equipment failures in distributed power grids. The generator part adopts an encoder decoder structure, where the encoder extracts local spatial features of images or vibration signals collected by drones through convolutional neural networks (CNN), and introduces long short-term memory networks (LSTM) to capture dynamic dependencies in time series. The decoder reconstructs the input data through deconvolution and generates synthetic data that is similar to real fault samples [34, 35]. The discriminator adopts a dual branch structure, which performs authenticity discrimination on spatial and temporal features respectively, and dynamically assigns weights through attention mechanism to enhance sensitivity to key fault features. This design enables the model to simultaneously learn the spatial form and temporal evolution laws of faults, improving the diagnostic accuracy of composite faults. The improved generative adversarial network structure is shown in Figure 2.
This study constructed a multidimensional stochastic model that includes fluctuations in photovoltaic output (standard deviation 15%), intermittency of wind power (power coefficient 0.3–0.8), and sudden load changes (20% peak load). Monte Carlo simulation revealed that these factors lead to measurement errors of 8%–12% in drone data collection and significantly reduce the confidence of the fault diagnosis model. We propose a dual response strategy for this. Firstly, an adaptive sampling algorithm is configured at the unmanned aerial vehicle (UAV) end to dynamically adjust the inspection path based on real-time meteorological data. Secondly, a Bayesian inference framework is introduced at the diagnostic end to correct uncertain inputs through prior probability distributions, effectively improving the robustness of the system under complex operating conditions.
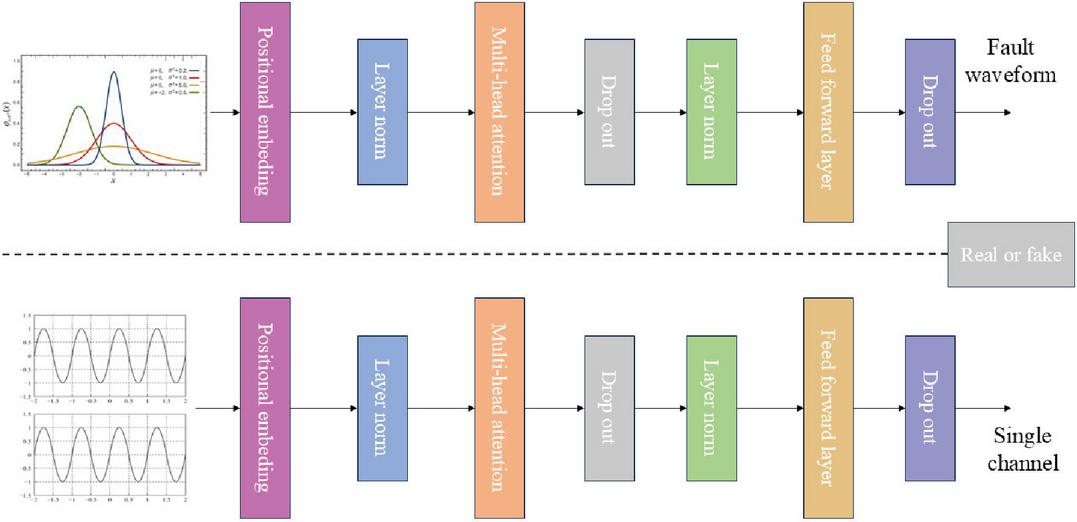
Figure 2 Improved generative adversarial network structure.
Calculate the between the query matrix and the key matrix to obtain similarity, then divide by and normalize it using the Softmax function to obtain the score matrix .
| (17) |
Then, multiply the score matrix with the value matrix to calculate the attention matrix :
| (18) |
The input of the attention matrix, , is linearly transformed to obtain the output formula of this layer, where W0 is the learnable network weight parameter.
| (19) |
On the basis of synthesizing fault samples in the generator, unlabeled real-time inspection data is introduced to participate in discriminator training [36–38]. The discriminator needs to complete two types of tasks simultaneously: one is to distinguish between real fault samples and pseudo samples synthesized by the generator, and the other is to determine whether unlabeled data belongs to a normal state. By minimizing the joint objective function of supervised and unsupervised losses, the model can learn the normal behavior baseline of power grid equipment using a large amount of unlabeled data, while expanding the fault sample library through the generator to alleviate the problem of data imbalance.
The calculation process of the convolutional self attention layer is as follows, where k represent one-dimensional convolutions with a kernel size of k. Firstly, divide the input X of the previous layer into multiple local blocks , and then use one-dimensional convolution operation to learn the Q, K, V of each local block .
| (20) |
In the formula, represents the weight at the position of the convolution kernel (p, q), k represents the size of the convolution kernel, Cin, Cout represent the channel sizes of the input and output, and yij represents the feature tensor at the feature position (i, j) on the local block.
The convolutional self-attention layer performs convolution operations on the input sequence using h sets of different convolution kernels, and calculates their attention matrices Zi, . Z is linearly transformed to obtain the final output result Z of the layer:
| (21) |
The research adopts a dual band (5.8 GHz/2.4 GHz) adaptive frequency hopping communication protocol based on the IEEE 802.11ac standard, and experimentally verifies that it can stably provide 130 Mbps bandwidth at a transmission distance of 10 km, meeting the parallel transmission requirements of high-definition images (20 Mbps/frame), infrared thermal spectra (5 Mbps/frame), and partial discharge data (2 Mbps/frame). For delay control, a layered transmission architecture is designed, in which edge computing is used for data preprocessing (compression ratio 65%) at the unmanned end, and TDMA time-division multiple access technology is used by the ground station to achieve multi machine data cooperative transmission, and the end-to-end delay is controlled within 800 ms in combination with forward error correction coding (FEC). Actual deployment tests have shown that this solution has a data packet loss rate of 1.5% in complex electromagnetic environments, meeting the strict requirements of real-time diagnosis for timeliness.
3.4 Multi Step Prediction Error Correction Mechanism for Fault Diagnosis
In the actual operation of distributed renewable energy grids, the development process of equipment failures (such as the formation of thermal spots on the surface of photovoltaic modules and the gradual wear of wind turbine gearboxes) often exhibits nonlinear and dynamic characteristics. The traditional single step prediction model relies solely on current time data for single point inference, which is susceptible to measurement noise or local disturbances, leading to the gradual accumulation of prediction errors over time. To this end, this study proposes a collaborative optimization strategy that combines multi-step prediction and dynamic error compensation: firstly, an LSTM attention hybrid time series prediction model is constructed based on historical inspection data, and the predicted sequence of the device’s state at multiple future time nodes is obtained through recursive deduction; Subsequently, the real-time on-site data collected by the drone is compared with the predicted values in multiple dimensions to quantify the cumulative deviation of multi-step predictions; Finally, the model parameters or predicted outputs are dynamically corrected through the error feedback correction module, forming a closed-loop iterative mechanism of “prediction verification optimization”. The core advantage of this strategy lies in using redundant information from multi-step prediction to hedge single point prediction errors, while achieving model adaptive adjustment through real-time data feedback, thereby significantly improving the ability to capture fault evolution trends.
In terms of algorithm implementation, this study developed the Sliding Window Error Compensation (SWEC) method. The correction efficiency of multi-step prediction highly depends on the real-time and reliability of on-site data. When the prediction system identifies a significant increase in the probability of equipment failure in a certain area within k time steps in the future, it will automatically increase the inspection priority of that area and command the drone to arrive at the target location in advance to obtain high-precision data, which not only verifies the prediction results but also provides a basis for model correction. If the error of the revised model continues to decrease in subsequent predictions, the current inspection path and data collection mode will be stored in the dynamic template library; Otherwise, it will be marked as a case to be optimized. Through long-term data accumulation and template iteration, gradually build an adaptive inspection path optimization system to achieve synergistic efficiency between data collection and fault diagnosis.
3.5 Distributed Grid Resilience Assessment System
3.5.1 N-1 fault criteria extended application
The traditional N-1 fault criterion focuses on single component static faults and is difficult to reflect the fault characteristics in distributed renewable energy grids. This study extends it to a dynamic N-1+fault chain model. Firstly, based on real-time equipment status data obtained from drone inspections, the functional correlation between components is identified. Multiple distributed power sources or adjacent fans on the same feeder are defined as fault units, and the impact of collective withdrawal on local voltage/frequency stability is evaluated. Secondly, by introducing the sequence of fault evolution and combining historical fault databases with real-time meteorological data, a dynamic fault chain of initial faults and secondary extensions is constructed.
To quantify the resilience of the power grid under the N-1 criterion, this study proposes a three-dimensional index system. The anti-interference ability is evaluated by the fault impact strength and resilience margin, and the system evaluates the additional fault capacity that can be absorbed by adjusting the output of distributed power sources. The recovery ability is based on the fault isolation time and service recovery time, and the economic efficiency is calculated by the elastic investment return rate. The evaluation system and drone inspection form a closed loop, dynamically updating the component vulnerability parameters in the fault chain model based on real-time evaluation results, while guiding the drone to optimize the inspection path.
3.5.2 Quantitative model of three elements of elasticity
This study constructs a three-dimensional comprehensive evaluation system covering anti-interference, restoration, and adaptability for the resilience assessment of distributed renewable energy grids. Specifically, in terms of anti-interference evaluation, based on real-time operational data collected by drones, the degree of deviation of system parameters from steady state after faults is quantified, and combined with the output regulation capability of distributed power sources and network topology flexibility, the remaining capacity of the system to maintain critical load power supply after faults is calculated; In terms of restorative assessment, the focus is on fault isolation time and service recovery efficiency. The fault isolation time is determined by the accuracy of drone positioning and the speed of protection device action, while the service recovery efficiency is comprehensively evaluated through the load recovery progress and backup resource utilization rate monitored by the drone; In terms of adaptability assessment, collaborative evolution indicators are introduced to dynamically evaluate the adaptability of the power grid to future changes in the operating environment, using equipment degradation data accumulated from long-term drone inspections and combined with meteorological prediction information.
4 Experiment
4.1 Collection of Drone Inspection Data
In terms of hardware selection, this study compared the wind resistance (stable flight at level 6 wind speed), endurance time (45 minutes), and payload capacity (3 kg) of six industrial grade unmanned aerial vehicles, including DJI M300 RTK and Zongheng CW-150, through field testing. Finally, a multi rotor model suitable for infrared thermal imaging and partial discharge sensors was selected; The communication protocol adopts wireless frequency hopping technology in the 5.8 GHz frequency band based on the IEEE 802.11ac standard. Through experimental verification, the data packet loss rate is 1.2% at a transmission distance of 10 km. Combined with the measured data of a 20 MW photovoltaic power station, the feasibility of the scheme’s input-output in complex terrain areas is demonstrated.
This study integrated multiple publicly available datasets to construct a benchmark scenario and fault feature library for distributed renewable energy grids. Firstly, the IEEE 33 node distribution network standard testing system is adopted as the basic topology framework, which includes 12 distributed power access points and can simulate renewable energy access scenarios under different penetration rates. Secondly, the dynamic load data of NSF funded CERTS Microgrid Testbed is introduced, which covers the 24-hour fluctuation curves of industrial, commercial, and residential loads, providing a real scenario for evaluating the resilience of the power grid under load changes. The IEEE 33 node system has been adopted in over 300 studies worldwide, and the spatiotemporal resolution of the NREL dataset can accurately capture the intermittent characteristics of renewable energy, providing a reliable benchmark for the comparative validation of resilience assessment models.
To compensate for the shortcomings of publicly available data in terms of device level details and real-time performance, this study collected equipment level data by deploying multi rotor drones equipped with infrared thermal imagers, partial discharge sensors, and LiDAR to conduct a one-year live inspection of a 20 MW distributed photovoltaic power station in China. The data collected included the distribution of thermal spots on photovoltaic modules, partial discharge spectra of inverters, and changes in line sag. The on-site operation is shown in Figure 3. The experimental parameter settings are shown in Table 1.
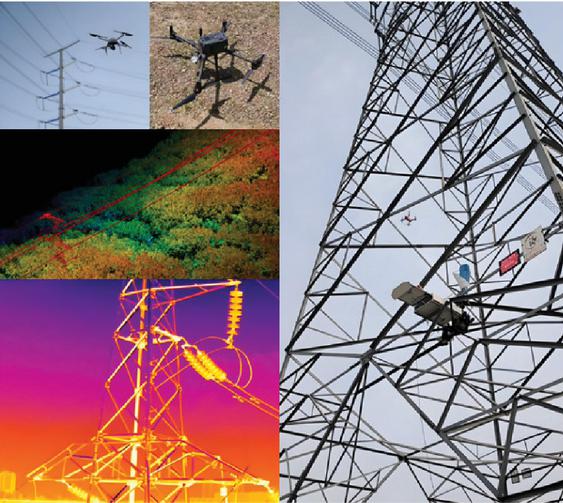
Figure 3 On site operation diagram of unmanned aerial vehicle.
Table 1 Parameter settings
| Flight Parameters | Set Range |
| Flight altitude | 20150 m |
| Flight speed | 38 m/s |
| Data collection frequency | 24/week |
| Evaluation time interval | 15 min |
In the data collection process, sensitive data such as geographic coordinates and equipment operating parameters collected by unmanned aerial vehicles equipped with sensors are locally stored and encrypted using a symmetric encryption method based on the national encryption algorithm SM4. At the same time, data anonymization technology is used to strip the direct association between the unique identifier of the equipment and geographic information. In the data transmission phase, a three-level encrypted transmission architecture is constructed, and a secure communication link is established between the drone and the ground control center using TLS 1.3 protocol. The transmitted data is subjected to key negotiation and identity authentication using SM2 asymmetric encryption algorithm, and the core operational data is additionally protected by VPN tunnels to prevent eavesdropping and tampering during transmission. In the process of data storage and usage, role-based access control (RBAC) mechanism is adopted to divide different levels of permissions such as operation and maintenance, management, and scientific research. Only authorized personnel can access the corresponding level of data, and regular security audits and log retention are carried out.
4.2 Contrast Test
In the research on enhancing the resilience of distributed renewable energy grids, the importance of comparing different algorithms lies in the efficient analysis of complex system dynamic characteristics and multi-source heterogeneous data. In the scenario of power grid fault diagnosis, accuracy can intuitively reflect the accuracy of the overall classification of the method, as shown in Figure 5. The recall rate focuses on the proportion of samples that are actually positive and correctly predicted as positive. In the diagnosis of power grid faults, faulty equipment belongs to the positive case, and the recall rate can reflect the method’s ability to identify faulty equipment, as shown in Figure 5. The average precision mean is the average of the average precision calculated across different categories, and when the IoU (Intersection over Union) threshold is set to 0.5, it is used to measure the degree of matching between predicted boxes and real boxes in object detection (such as detecting the location of power grid equipment faults). In fault diagnosis based on drone inspection, this method requires accurate detection of the location and other information of the faulty equipment, mAP@0.5 The performance of the method in object detection tasks can be comprehensively evaluated, reflecting its overall performance in locating and classifying faulty equipment, as shown in Figure 4.
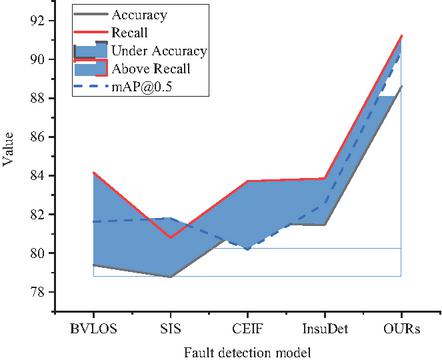
Figure 4 Accuracy, Recall Value, and mAP@0.5 Value comparison.
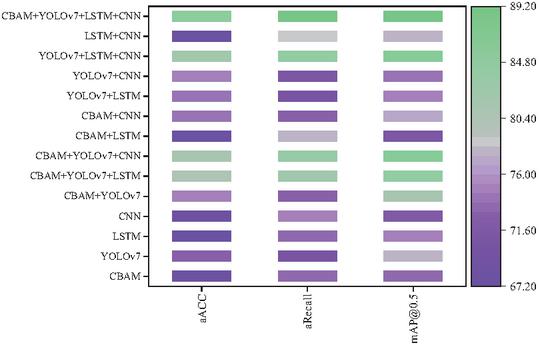
Figure 5 Ablation experiment.
In this study on the resilience enhancement of distributed renewable energy power grids based on unmanned aerial vehicle assisted live inspection and real-time fault diagnosis, performance evaluations were conducted on different real-time fault diagnosis methods for power grids. From the data, it can be seen that existing real-time fault diagnosis methods for power grids such as BVLOS, SIS, CEIF, and InsuDet have high accuracy, regression value, and mAP@0.5 Each indicator has its own performance. For example, the SIS method has high regression values, but mAP@0.5 Relatively low, indicating that it may perform well in certain single evaluation dimensions, but its overall object detection and classification abilities are not satisfactory. The real-time fault diagnosis method proposed in this study is significantly better than other methods in three indicators, with an accuracy of 88.62% and a regression value of 91.21%, mAP@0.5 It is 90.43%. This indicates that the method has significant advantages in accurately identifying faults, regression analysis of fault related parameters, and comprehensive performance of object detection, and can more effectively adapt to the complex and changing operating environment of distributed renewable energy grids, providing more reliable fault diagnosis support for improving grid resilience.
4.3 Ablation Experiment
In the research on enhancing the resilience of distributed renewable energy grids, the importance of ablation experiments lies in their ability to systematically reveal the independent contributions and interactions of each component in the multi module collaborative mechanism, providing key basis for optimizing model architecture. If the overall performance is directly verified, it is difficult to determine which module plays a leading role in the extraction ability of timing fault features, and the corresponding module impact can be known through ablation experiments, as shown in Figure 5 below, and the specific data is shown in Table 2.
Table 2 Specific numerical display of ablation experiment
| CBAM | YOLOv7 | LSTM | CNN | aACC | aRecall | mAP@0.5 |
| — | — | — | 68.02 | 73.22 | 73.26 | |
| — | — | 74.82 | 73.03 | 81.27 | ||
| — | 74.82 | 73.03 | 81.27 | |||
| — | 81.33 | 83.62 | 85.67 | |||
| 80.62 | 82.24 | 84.76 | ||||
| — | — | — | 72.93 | 70.84 | 78.01 | |
| — | — | 74.53 | 70.35 | 74.68 | ||
| — | — | 74.81 | 71.55 | 74.22 | ||
| — | 82.46 | 84.61 | 85.61 | |||
| — | — | — | 67.27 | 73.63 | 74.54 | |
| — | — | 67.37 | 78.86 | 77.99 | ||
| — | — | — | 67.94 | 74.57 | 71.68 |
In the research on enhancing the resilience of distributed renewable energy grids based on unmanned aerial vehicle assisted live inspection and real-time fault diagnosis, performance tests were conducted on multiple module combinations. It can be seen from the data that the average accuracy, average regression value and mAP@0.5 The performance on indicators is uneven, such as YOLOv7 mAP@0.5 Relatively high, but slightly inferior in the average regression value, indicating that each single module has certain limitations in different evaluation dimensions. After module combination, there is a significant change in performance, such as the improvement of CBAM and YOLOv7 combination in multiple indicators. Further adding modules, such as the combination of CBAM+YOLOv7+LSTM+CNN, significantly improves various indicators, with an average accuracy of 85.16% and an average regression value of 88.47% mAP@0.5 It is 89.16%. This indicates that multi module fusion can fully leverage the advantages of each module, process drone inspection data more comprehensively, improve the accuracy of fault diagnosis, the reliability of regression analysis, and the comprehensive performance of target detection, providing more accurate technical support for the resilience improvement of distributed renewable energy grids.
4.4 Robustness Analysis
The operating environment of distributed renewable energy power grids is complex and ever-changing. Unmanned aerial vehicle inspections can be affected by wind, rain, electromagnetic interference, and other factors, leading to errors in data collection. Equipment performance can also fluctuate due to aging and manufacturing differences. At the same time, the power grid may also face abnormal working conditions such as sudden failures and load changes. The robustness experiment simulates these adverse factors to test the stability and reliability of fault diagnosis algorithms and resilience enhancement strategies under inaccurate data, equipment performance changes, and abnormal operating conditions. The experimental results are shown in Figures 6 and 7.
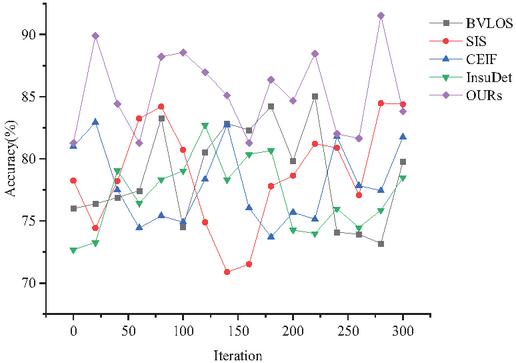
Figure 6 Relationship between iteration and accuracy.
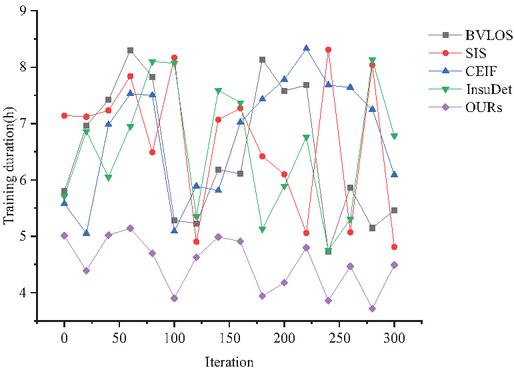
Figure 7 Relationship between iteration and training duration.
From the data, it can be seen that existing methods such as BVLOS, SIS, CEIF, InsuDet, as well as the method proposed in this study, have their own fluctuations in accuracy performance. The accuracy of BVLOS method fluctuates relatively frequently, with ups and downs at different iteration stages. The accuracy of the SIS method also fluctuates to some extent, with high values at some iteration points, but overall stability is poor. The accuracy of the CEIF method is also unstable, with multiple low value points. The accuracy of the InsuDet method also shows a fluctuating state. The real-time fault diagnosis method for the power grid studied in this study, although its accuracy fluctuates at some iteration points, generally maintains a high level as the number of iterations increases. This indicates that the method used in this study has better convergence and stability in the iterative optimization process, and can effectively adapt to the complex environment of the power grid, providing more reliable fault diagnosis results for improving the resilience of the power grid.
Under rainstorm conditions, through waterproof coating treatment and interface sealing design, the infrared thermal imager (operating humidity 95%) and partial discharge sensor (IP67 protection level) carried by the UAV work continuously for 2 hours in the simulated rainfall of 200 mm/h without data abnormality. In the strong wind test, the unmanned aerial vehicle with a six rotor aerodynamic optimization layout was able to maintain a hovering accuracy of 0.5 m and a patrol path deviation rate of 3% under wind conditions of level 8 (17.2–20.7 m/s). High temperature experiments have shown that the onboard computing unit, which has been modified with a heat dissipation module, can run continuously for 4 hours at an ambient temperature of 50∘C, and its fault diagnosis algorithm processing speed only decreases by 7%.
5 Conclusion
This study focuses on the key challenge of insufficient operational stability of distributed renewable energy grids in the context of global energy transition. A systematic integrated technology system was constructed, with unmanned aerial vehicle assisted live inspection as the data acquisition core, intelligent fault diagnosis algorithms as the analysis support, and grid resilience improvement as the goal. The research results have both theoretical innovation and engineering application value. In terms of inspection technology, by equipping a multi-sensor unmanned aerial vehicle platform and optimizing flight parameters, efficient and uninterrupted all-round detection of power grid equipment has been achieved. Long term on-site operation data has verified that its efficiency is more than three times higher than manual inspection, providing a high timeliness and fine-grained multi-source data foundation for fault diagnosis. In terms of diagnostic methods, by integrating CBAM attention mechanism, LSTM network, and sliding window error correction strategy, the accuracy and robustness of fault recognition and localization have been significantly improved, with an accuracy rate of 88.62% in the standard testing system and better performance than existing mainstream methods. To further promote the transformation of research results into engineering practice, this study proposes a progressive implementation path of “pilot demonstration platform integration standard promotion”. It is recommended to select typical stations for system verification, build an integrated intelligent inspection platform compatible with the existing operation and maintenance system, and develop standardized operation procedures and personnel training mechanisms to promote the large-scale application of this technology system in the power industry, effectively enhancing the operational flexibility and sustainable operation and maintenance capabilities of distributed power grids.
The limitations of this study in terms of communication stability of unmanned aerial vehicles under extreme weather conditions, generalization ability of diagnostic models under complex fault modes, and real-time fusion efficiency of multi-source heterogeneous data still exist. In the future, adaptive diagnostic algorithms integrating meta learning or federated learning frameworks can be studied to improve the model’s autonomous adaptation and incremental learning ability in the absence of fault modes, providing a clear evolutionary path for subsequent research.
Acknowledgments
This work was supported by the science and technology project of State Grid ShaanXi Electric Power Company Limited (Contract No.: SGSNPXO0SPIS2500139).
References
[1] Persiani C A F, Sallazar F M, Inoue R S, et al. Drone-based fault recognition in power systems: a systematic review of intelligent methods[J]. Discover Applied Sciences, 2025, 7(5): 475.
[2] Korki M, Shankar N D, Shah R N, et al. Automatic fault detection of power lines using unmanned aerial vehicle (UAV)[C]//2019 1st International Conference on Unmanned Vehicle Systems-Oman (UVS). IEEE, 2019: 1–6.
[3] Qamar A, Uddin Z. Drone-assisted time-varying magnetic field analysis for fault diagnosis in grounding grids[J]. PLoS One, 2025, 20(6): e0325845.
[4] Ayoub, N., and Schneider-Kamp, P. (2020, July). Real-time On-board Detection of Components and Faults in an Autonomous UAV System for Power Line Inspection. In DeLTA (pp. 68–75).
[5] Nethravathi, S., and Murali, V. (2023). A Novel Knapsack Algorithm-Based Energy Routing in a Microgrid. Distributed Generation & Alternative Energy Journal, 641–668.
[6] Wong S Y, Choe C W C, Goh H H, et al. Power transmission line fault detection and diagnosis based on artificial intelligence approach and its development in uav: A review[J]. Arabian Journal for Science and Engineering, 2021, 46(10): 9305–9331.
[7] Lu X, Zhong S, Zhou C, et al. Self-powered real-time fault monitoring for drone blades[J]. Nano Energy, 2025: 111073.
[8] Kim S, Kim D, Jeong S, et al. Fault diagnosis of power transmission lines using a UAV-mounted smart inspection system[J]. IEEE access, 2020, 8: 149999–150009.
[9] Ayoub, N., and Schneider-Kamp, P. (2021). Real-time on-board deep learning fault detection for autonomous UAV inspections. Electronics, 10(9), 1091.
[10] Alsafasfeh M, Abdel-Qader I, Bazuin B, et al. Unsupervised fault detection and analysis for large photovoltaic systems using drones and machine vision[J]. Energies, 2018, 11(9): 2252.
[11] Foudeh H A, Luk P C K, Whidborne J F. An advanced unmanned aerial vehicle (UAV) approach via learning-based control for overhead power line monitoring: A comprehensive review[J]. IEEE Access, 2021, 9: 130410–130433.
[12] Iversen N, Schofield O B, Cousin L, et al. Design, integration and implementation of an intelligent and self-recharging drone system for autonomous power line inspection[C]//2021 IEEE/RSJ International Conference on Intelligent Robots and Systems (IROS). IEEE, 2021: 4168–4175.
[13] He Y, Liu Z, Guo Y, et al. UAV based sensing and imaging technologies for power system detection, monitoring and inspection: a review[J]. Nondestructive Testing and Evaluation, 2024: 1–68.
[14] Yangbing, Z., Xiao, X., Xing, W., Mingyue, C., and Lu, C. (2023). Stability Modeling and Analysis of Grid Connected Doubly Fed Wind Energy Generation Based on Small Signal Model. Distributed Generation & Alternative Energy Journal, 413–434.
[15] Cubukcu M, Akanalci A. Real-time inspection and determination methods of faults on photovoltaic power systems by thermal imaging in Turkey[J]. Renewable Energy, 2020, 147: 1231–1238.
[16] Li Z, Zhang Y, Wu H, et al. Design and application of a UAV autonomous inspection system for high-voltage power transmission lines[J]. Remote Sensing, 2023, 15(3): 865.
[17] Li, Ziran, et al. “UAV high-voltage power transmission line autonomous correction inspection system based on object detection.” IEEE Sensors Journal 23.9 (2023): 10215–10230.
[18] Guan H, Sun X, Su Y, et al. UAV-lidar aids automatic intelligent powerline inspection[J]. International Journal of Electrical Power & Energy Systems, 2021, 130: 106987.
[19] Kaitouni S I, Ait Abdelmoula I, Es-sakali N, et al. Implementing a Digital Twin-based fault detection and diagnosis approach for optimal operation and maintenance of urban distributed solar photovoltaics[J]. Renewable Energy Focus, 2024, 48: 100530.
[20] Roshanski I, Roshanski M, Kalech M. Real-Time Sensor Fault Detection in Drones: A Correlation-Based Algorithmic Approach[C]//35th International Conference on Principles of Diagnosis and Resilient Systems (DX 2024). Schloss Dagstuhl–Leibniz-Zentrum für Informatik, 2024: 17: 1–17: 20.
[21] Arenella A, Greco A, Saggese A, et al. Real time fault detection in photovoltaic cells by CBAMeras on drones[C]//International Conference on Image Analysis and Recognition. Cham: Springer International Publishing, 2017: 617–625.
[22] Mao, Tianqi, et al. “Development of power transmission line defects diagnosis system for UAV inspection based on binocular depth imaging technology.” 2019 2nd International Conference on Electrical Materials and Power Equipment (ICEMPE). IEEE, 2019.
[23] Reddy, B. R. S., Reddy, V. V., and Kumar, M. V. (2023). Design and Analysis of DC-DC Converters with Artificial Intelligence Based MPPT Approaches for Grid Tied Hybrid PV-PEMFC System. Distributed Generation & Alternative Energy Journal, 1307–1330.
[24] Siddiqui, Zahid Ali, and Unsang Park. “A drone based transmission line components inspection system with deep learning technique.” Energies 13.13 (2020): 3348.
[25] Diniz, L. F., Pinto, M. F., Melo, A. G., and Honório, L. M. (2022). Visual-based assistive method for uav power line inspection and landing. Journal of Intelligent & Robotic Systems, 106(2), 41.
[26] Jenssen, R., and Roverso, D. (2019). Intelligent monitoring and inspection of power line components powered by UAVs and deep learning. IEEE Power and energy technology systems journal, 6(1), 11–21.
[27] Ramasamy, Jayabharathi, et al. “Cloud-Enabled Isolation Forest for Anomaly Detection in UAV-Based Power Line Inspection.” 2024 2nd International Conference on Networking and Communications (ICNWC). IEEE, 2024.
[28] Deng, Fangming, et al. “Research on edge intelligent recognition method oriented to transmission line insulator fault detection.” International Journal of Electrical Power & Energy Systems 139 (2022): 108054.
[29] Langåker, Helge-André, et al. “An autonomous drone-based system for inspection of electrical substations.” International Journal of Advanced Robotic Systems 18.2 (2021): 17298814211002973.
[30] Baltac, Özge, et al. “Thermal image and inverter data analysis for fault detection and diagnosis of PV systems.” Applied Sciences 14.9 (2024): 3671.
[31] Lekidis, Alexios, Anestis G. Anastasiadis, and Georgios A. Vokas. “Electricity infrastructure inspection using AI and edge platform-based UAVs.” Energy Reports 8 (2022): 1394–1411.
[32] Ma, Yunpeng, et al. “Real-time detection and spatial localization of insulators for UAV inspection based on binocular stereo vision.” Remote Sensing 13.2 (2021): 230.
[33] Sivakumar, K., Jayashree, R., and Danasagaran, K. (2023). New Reliability Indices for Microgrids and Provisional Microgrids in Smart Distribution Systems. Distributed Generation & Alternative Energy Journal, 435–466.
[34] Zhang, Xingtuo, et al. “InsuDet: A fault detection method for insulators of overhead transmission lines using convolutional neural networks.” IEEE Transactions on Instrumentation and Measurement 70 (2021): 1–12.
[35] Li, Chuanjiang, et al. “A zero-shot fault detection method for UAV sensors based on a novel CVAE-GAN model.” IEEE Sensors Journal 24.14 (2024): 23239–23254.
[36] Ghazali, Mohamad Hazwan Mohd, and Wan Rahiman. “Vibration-based fault detection in drone using artificial intelligence.” IEEE Sensors Journal 22.9 (2022): 8439–8448.
[37] Guo, Kai, et al. “UAV sensor fault detection using a classifier without negative samples: A local density regulated optimization algorithm.” Sensors 19.4 (2019): 771.
[38] Li, Yi, Minzhe Ni, and Yanfeng Lu. “Insulator defect detection for power grid based on light correction enhancement and YOLOv5 model.” Energy reports 8 (2022): 807–814.
Biographies

Zhe Sun obtained his bachelor’s degree in Energy and Power Engineering from Kunming University of Science and Technology in 2010 and his master’s degree in Power Engineering from the same university in 2013. At present, he is working at the Training Center of State Grid Shaanxi Electric Power Co., LTD., and his research interests focus on intelligent operation and maintenance of transmission lines. He has successively published 8 scientific and technological papers, obtained over 40 authorized invention and utility model patents, and 13 software Copyrights. He has won the provincial company’s science and technology progress award, patent award, team innovation achievement award and Gold Award for innovation and creativity for many times.

Ruixue Yu graduated from Shaanxi University of Technology with a bachelor’s degree in Automation in 2012. Currently, I am working as a trainer at the Training Center of State Grid Shaanxi Electric Power Co., LTD. The research field is the maintenance and inspection of power grids using unmanned aerial vehicles and attached power equipment.

Guiqi Zhu obtained her bachelor’s degree in Electrical Engineering from Wuhan University in 2020 and her master’s degree in Electrical Engineering from Wuhan University in 2022. At present, she is working at the Training Center of State Grid Shaanxi Electric Power Co., LTD., and his research interests focus on intelligent operation and maintenance of transmission lines.

Qi Xue received the bachelor’s degree in Electrical Engineering and Its Automation (Electrical) from Xi’an University of Technology in 2012, the master’s degree in Power System and Its Automation from Xi’an University of Technology in 2015. He is currently working as an Trainer at the State Grid Shaanxi Electric Power Training Center. His research areas include Use of UAVs (Unmanned Aerial Vehicles) and Onboard Devices for Power Grid Inspection.
Distributed Generation & Alternative Energy Journal, Vol. 41_2, 271–300
doi: 10.13052/dgaej2156-3306.4122
© 2026 River Publishers