Integrating Water-Based Energy Solutions in Industrial Design for Sustainable Manufacturing
Xiaoxia Lu
School of Media and Design, Nantong Institute of Technology, Nantong, Jiangsu, China, 226002
School of Economics and Management, Nanjing University of Aeronautics and Astronautics, Nanjing, Jiangsu, China, 211106
E-mail: xiaoxialu01@outlook.com; 201705016@ntit.edu.cn
Received 20 November 2025; Accepted 24 March 2026
Abstract
The research elaborates on a Water–Energy Recovery System (WERS) that has been developed as a sustainable manufacturing enhancer by extracting hydraulic energy from industrial wastewater networks. The study uses an extensive dataset of a Full-Scale Wastewater Treatment Plant from six important industrial areas of Iran, and the framework goes through extensive data preprocessing which consists of noise reduction, normalization, and extraction of the main indicators like Specific Energy Consumption (SEC) and Flow Power Ratio (FPR) for the evaluation of hydraulic–energy relationships. Hydraulic head estimation, power calculation, and multi-criteria ranking that considers flow stability, installation feasibility, and cost-effectiveness are the methods used to unearth the potential recovery locations. The WERS that comprises of a pump-as-turbine arrangement for hydraulic energy conversion is also backed by storage and smart control units, and the measurement of environmental and economic performance is done through a Life Cycle Assessment (LCA) integrated with Techno-Economic Assessment (TEA). Non-dominated Sorting Genetic Algorithm II (NSGA-II) is the one that performs the multi-objective optimization by maximizing the annual recovered energy and minimizing the total system cost. The outcomes show a total recoverable energy potential of 6.8 GWh from 613 Hm3 of the industrial wastewater, the Caspian region being the highest contributor (3.2 GWh). The configured WERS with optimization results in a power of 31,110.72 kW, CO2 reduction of 2.23 108 kg annually, and strong economic viability indicated by payback and cost–benefit metrics. These results accentuate the remarkable potential of water-based energy recovery as a large-scale solution of future low-carbon and resource-efficient industrial operations.
Keywords: Water–energy recovery system, industrial wastewater, hydraulic energy recovery, specific energy consumption, techno-economic assessment, NSGA-II optimization, sustainable manufacturing.
1 Introduction
The use of water-based energy systems in industrial design has become a major technique to accomplish sustainable manufacturing during the time of concern for the environment [1]. The industrial sectors are responsible for a large part of the world’s energy use, which brings about a corresponding increase in carbon dioxide emissions and destruction of the environment. The installation of water-based generators, micro-hydropower systems, and piezoelectric energy harvesting systems basically reflect the capacity to change industrial activities [2]. These kinds of plants take advantage of both kinetic and potential energy from water streams and then supply the industry with clean electric power [3]. This trend not only lowers the overall fossil fuel requirements but also improves the efficiency of the power use in total. Moreover, eco-friendly manufacturing requires the waste to be kept to a minimum and the resources to be taken full advantage of, which is in line with worldwide sustainability objectives [4]. If water-based systems are combined with industrial design then the operation will not be interrupted, and the environment will be protected. The framework guides the area of industry to attain the goals of carbon neutrality and resource circularity [5]. Finally, this change of attitude leads to the transition from traditional power-hungry production methods to the self-sufficient, water-powered energy models.
Water-based energy integration is being driven largely by the demand for industrial energy to expand, the depletion of resources, and the increasing carbon footprints. Industrialization processes that are so fast have increased non-renewable sources use and they have caused very serious damages to the environment [6]. Water, having the characteristics of a resource that is both very available and very renewable, provides a sustainable substitute for fossil fuels and other forms of conventional energy. The present energy conversion systems are not efficient, and that is why they lose so much energy during the production process [7]. The industrial water waste streams that are normally discarded have an enormous amount of energy that is not being utilized. The developments in fluid dynamics, materials, and sensor-based monitoring have opened the door for using water-based energy harvesting in various scales [8]. All these factors have made it compulsory for industries to investigate the possibilities of renewable energy being mixed up in the manufacture of electricity [9]. Energy independence and lower operating costs are other factors that contribute to this transition. Therefore, creating a framework that will analytically introduce water-based energy systems into industrial processes is a technological as well as an environmental necessity [10].
Many approaches are there already that try to integrate sustainable energy solutions into the process of industrial manufacturing. However, each approach has some limitations. Micro-Hydropower Systems (MHPs), Triboelectric Nanogenerators (TENGs), and Piezoelectric Energy Harvesting (PEH) are some of the methods that have been tried for the conversion of water-driven energy [11]. Hydrokinetic Turbine-Based Systems are the ones that depend on the water flow, but they are still very costly in terms of both installation and maintenance. Fuel cells and other Electrochemical Energy Conversion Methods produce great energy output but at the cost of being very complex in their operational controls and requiring expensive catalysts [12]. Thermoelectric Recovery Systems are the ones that take the waste heat and turn it into power, but their application range is limited due to being fluid-based environments. Hybrid Photovoltaic-Hydropower Models are the ones that help in the sustainability aspect, but they are highly reliant on the fluctuating environmental conditions [13].
Microfluidic Energy Harvesting Systems produce energy localized to the area but are not good for large-scale industries [14]. Another point is that a lot of the systems still have not been adapted to existing industrial architectures which causes inefficiencies in the real-world deployment. Moreover, energy storage and conversion losses are still very critical challenges. Hence, a comprehensive and integrated water-based energy framework is necessary to eliminate these drawbacks and make industrial manufacturing sustainable [15].
Emphasized the growing role of distributed renewable systems and decentralized energy recovery frameworks in improving industrial sustainability. For instance, studies published in the journal have investigated the integration [16] of micro-hydropower technologies within existing water infrastructure to enhance distributed power generation efficiency. Other works have examined hybrid renewable configurations combining hydraulic and [17] alternative energy sources to ensure operational stability and economic feasibility. Furthermore, multi-objective optimization techniques for distributed generation planning have been [18] discussed to balance energy output, cost, and environmental performance. These contributions collectively highlight the importance of decentralized energy recovery systems in achieving low-carbon industrial transformation, thereby reinforcing the relevance of the proposed WERS framework within the context of distributed generation research.
The WERS proposed framework eliminates the main disadvantages of energy systems based on water by introducing a common industrial structure for both hydraulic energy recovery. Although the WERS is different from the conventional micro-hydropower or piezoelectric systems that depend solely on one energy source, it has the capability to extract kinetic, potential, and electrochemical energy from the water used in industries. The joining of two energy sources guarantees that the energy consumed is very efficient and stable during changes in flow and head conditions. It is easy to integrate the system’s modular design into the existing industrial infrastructures without affecting the operational processes. In addition to that, the intelligent control circuits and energy storage units contribute a lot to the conversion losses and energy management. The optimization of the system through the NSGA-II suggests the multi-objective adaptability of energy recovering, cost, and environmental performance is done in a balanced way. The significance of this research is thus in setting up an innovative and data-driven multi-energy hybrid recovery framework that guarantees cross-cutting benefits of operational excellence, cost-effectiveness, and long-term environmental sustainability in industrial manufacturing.
1.1 Key Contribution
Below are the primary contributions of this research:
• Developed a hybrid WERS system incorporating a pump-as-turbine and hydro unit for the purpose of energy recovery with high efficiency.
• Analyzed industrial wastewater datasets for the purpose of identifying areas with the highest energy recovery potential based on hydraulic parameters.
• Designed a multi-criterion ranking system for the purpose of evaluating the sites about the characteristics of flow stability, installation difficulty, and cost-effectiveness.
• Tuned the WERS setup via NSGA-II in a way that energy recovery was at a peak and the cost incurred during operation was at a minimum.
• The simulation proved the sustainability and efficiency of the system and pointed out its usefulness for carbon-cutting industrial processes.
The subsequent sections of the document are organized like this: In Section 2, a review of literature concerning sustainable manufacturing and energy recovery through water is given. The proposed WERS framework and the NSGA-II optimization are discussed in Section 3. The results and performance analysis are presented in Section 4, whereas Section 5 provides the conclusion of the study along with the indication of future improvements.
2 Related Works
Maldonado-Romo et al. [19] employed a systematic literature review through the Life Cycle Engineering framework and utilized both bibliometric and content analysis approaches to identify sustainable practices in the manufacturing sector. The research highlighted the main sustainability aspects, but it was restricted by secondary data dependence and lack of coverage on social sustainability. Tegtmeier et al. [20] reviewed the literature to modernize the herbal remedy production via eco-friendly chemical engineering and digitalization in a very thorough way. Yet, the study faced the restrictions of limited experimental validation and not wholly completed industrial scalability assessments. Xie et al. [21] presented a literature overview on the evaluation of eco-friendly design for kindergarten furniture that mainly focused on sustainability and child welfare. The researchers utilized AHP combined with GCA to rank different design options. Still, the research was limited by a small sample size and hence, the results were not applicable to different kinds of furniture.
Yao et al. [22] reviewed novel marker pen cap designs with the aim of avoiding both the loss of the cap and the evaporation of the ink. The study was underpinned by TRIZ, intrinsic safety principles, and universal design methods, with the evaluation being supported by SERVQUAL, Kano, and IPA analyses. Nonetheless, the study’s outcomes were restricted because of the testing of prototypes and the non-representative user sample. Thebuwena et al. [23] performed a methods for saving water in urban tall buildings that are deprived of water supply. The method employed was a case study using LEED green building guidelines for assessing sustainable water management strategies. Despite the above, the study was limited by its focus on a single building and no long-term performance evaluation. Niekurzak et al. [24] published the comprehensive recycling of crystalline silicon PV cells and modules. The study utilized a thermal delamination technique and a SWOT-based techno-economic analysis to assess recycling effectiveness and the economic side. However, it could not be helped that these limitations were the result of the laboratory-scale realization and the non-availability of full industry validation.
Khan et al. [25] performed the optimization of Microbial Electrochemical Cells for wastewater treatment, carbon capture, and hydrogen production. They implemented the Entropy-TOPSIS multi-criteria decision-making methodology to find out the best operational parameters. However, the study was limited to simulation conditions and did not validate its findings through large-scale experiments. Yang & Vezzoli [26] performed a green furniture innovation through LCD principles. The research was characterized by a design-based methodology that included case studies, workshops, interviews, and focus groups to create LCD guidelines and toolkits. Nevertheless, this kind of study has numerous limitations including boundary on geographical where cases were taken and subjective interpretation among their designers. Despeisse et al. [27] combined sustainability and digitalization in manufacturing. A bottom-up systematic review method was used in the study that analyzed 208 empirical studies to generate propositions and a Digitalized Sustainable Manufacturing framework. But the study had some limitations such as the presence of publication bias and the inability to conduct longitudinal industrial validation.
Remic et al. [28] assessed the environmental impacts of wood-based products by the CAD-integrated LCA tools. A comparative analysis method was applied in the study with SolidWorks, NX, Fusion, and SimaPro as the tools for life cycle impacts evaluation. However, material databases were limited, and the CAD tools were not able to cover the entire life cycle, thus the study was restrained. Zhang et al. [29] investigated the sustainability issue in the Yangtze River Delta by taking the Landscape Infrastructure concept as a base. The research utilized remote sensing, GIS analysis, and spatial modeling techniques to experiment with designing ecological corridors. The study, nevertheless, faced limitations such as being region-specific and the lack of long-term ecological validation. Khalid et al. [30] outlined the use of the ohmic heating-assisted extraction process to recapture some valuable substances from food industry waste. The study adopted a critical review and comparative analysis method to measure extraction efficiency throughout various waste sources. Nevertheless, the study was restricted by lack of consistency in the experimental conditions and absence of large-scale industrial validation.
2.1 Research Gap Summary
The accumulated evidence points out that the sustainable manufacturing, environmental design, and green technology applications fields have undergone substantial transformation; however, most of the current practices are still hindered by the analytical techniques that have been used so far and system integration that has been kept narrow [31]. The methods employed, such as bibliometric analysis, AHP-GCA, TRIZ, LEED-based case studies, and thermal delamination did provide important perspectives, but they were not able to allow for interoperability across domains, real-time adaptability, and dynamic assessment of lifecycle capabilities. Moreover, several papers relied on secondary or simulated data, which significantly limited the applicability of their research findings in the cases of industry or environment [32]. The limitations are a signal for the requirement of cumulative, hybrid data-driven analytical frameworks that can accommodate environmental, social, and economic sustainability metrics within one adaptable system simultaneously.
There are already some alternative and more powerful methods that can be used to fill the mentioned gaps. Hybrid Multi-Criteria Decision-Making models combined with machine learning, such as Fuzzy-DEMATEL–ANP–TOPSIS, can manage the uncertainty and sustainability inter-dependence much better [33]. System Dynamics modeling and Agent-Based Simulation can give continuous feedback on the environmental and economic interactions throughout the different life cycles. Moreover, the coupling of Digital Twin–enabled Life Cycle Assessment and AI-driven optimization frameworks will further the real-time monitoring, prediction, and process flexibility [34]. Thus, these methods will provide a comprehensive, scalable, and adaptive assessment of sustainability performance, therefore, closing the gap between the theoretical frameworks and the industrial applications.
2.2 Objectives
This research will achieve its aim through the following activities:
• Design a mixed WERS framework that will bring together pump-as-turbine for effective energy recovery from multiple sources.
• Gather and examine data sets linked to the industrial water-energy sector to determine the optimal locations for energy recovery fortuitously from the hydraulic conditions.
• Develop a multi-criteria site ranking model that will classify the possible recovery points considering the three aspects namely technical feasibility, reliability, and cost-effectiveness.
• Apply NSGA-II optimization to check which WERS configuration is the most eco-friendly one, by looking at the trade-off between energy recovery, cost, and environmental performance.
• By simulation and assessment, the system’s performance as a whole and the sustainability results will be judged and confirmed in the context of future use in industrial settings.
3 Water–Energy Recovery for Sustainable Industrial Wastewater Framework
The Water–Energy Recovery System (WERS) described in this paper consists exclusively of hydraulic energy recovery. It has the pump-as-turbine units that generate energy using the flow and pressure of industrial wastewater as its source. The methodology workflow Figure 1 suggested starts with industrial wastewater treatment plants, data collection and then the data preprocessing step involving cleaning, noise reduction, normalization, feature scaling, and statistical validation to confirm data quality.
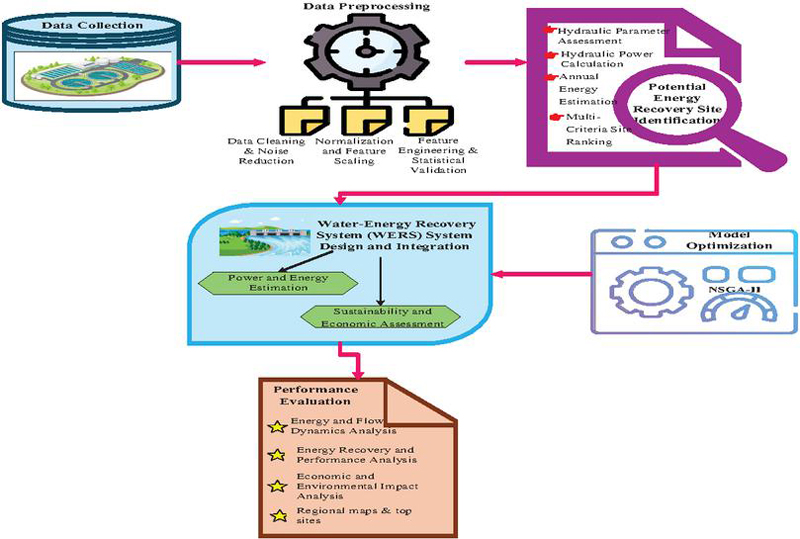
Figure 1 Water–energy recovery for industrial wastewater: methodology diagram.
The dataset after refining is then utilized for the potential energy recovery site identification phase which consists of hydraulic assessment, power estimation, and multi-criteria site ranking. After that, the WERS is designed and incorporated to predict power output and evaluate sustainability and economic feasibility. The entire process is subjected to model optimization via the NSGA-II algorithm to attain maximum efficiency and minimum cost. In the end, a comprehensive performance evaluation is carried out through Pareto analysis, CAPEX comparison, cumulative energy trends, and regional site performance visualization.
3.1 Data Collection
Dataset of the Full-Scale Wastewater Treatment Plant [35] that is presented in this study comprises a full set of time-series data from wastewater treatment plants in Iran. The data includes hydraulic flow rates, power usage, temperature, dissolved oxygen, and weather variables. It gives a main concern to hydraulic parameters, for instance, flow and pressure, energy consumption, and environmental conditions like temperature, as they are the main factors determining the hydraulic energy recovery potential.
3.2 Data Preprocessing
The preprocessing stage is the one that guarantees the industrial water–energy dataset is of good quality, consistent, and compatible with analytical modeling and simulation. The Dataset is subjected to three main preprocessing operations: (i) missing and noisy data are corrected by means of interpolation and smoothing filters that do not disrupt the continuity of the signal, (ii) normalization and feature scaling are applied through the min–max method to make variables with different physical units and magnitudes comparable in terms of range, and (iii) feature engineering and statistical validation are carried out to extract meaningful indicators like Specific Energy Consumption and Flow Power Ratio with the assurance that there is a strong correlation between the hydraulic and the energy parameters. The extractions of the preprocessing steps turn the raw industrial data into a clean, structured, and reliable format that can thus support the accurate energy recovery estimation and system optimization in the following modeling stages.
3.2.1 Data cleaning and noise reduction
Data in their raw form from industrial operations are sometimes subject to losses, shifts in sensor readings, random noise from the malfunctioning or temporary changes in the operation of the equipment. According to Equation (1), missing value imputation () for each time is accomplished through either linear interpolation or mean substitution.
| (1) |
Here, and represent the measured hydraulic flow or energy consumption values that were recorded just before and after, respectively, and is the value that has been computed. Furthermore, a moving average filter smoothing technique is applied to get rid of the short-term noise and to reveal the real operational trends, as described in Equation (2),
| (2) |
In this case, refers to the observation that is smoothed at time is the measured value at the -th interval preceding, and is the size of the window.
3.2.2 Normalization and feature scaling
Following the cleansing of the dataset, normalization and feature scaling techniques were applied with the intention of modeling and optimization so that all variables would be relatively equally important. The industrial water energy dataset contained parameters that were totally different from one another like flow rate (Q, m3/h), hydraulic head (H, m), temperature (T, ∘C), and energy consumption (P, kWh) which have very different units and magnitude as well. The min-max normalization method, following the formula in Equation (3), adjusted each variable to the range of 0 to 1,
| (3) |
Where, stands for the original value and and denote the minimum and maximum values, respectively. Thus, regression models, simulations, and optimization algorithms-such as NSGA-II for hybrid water-energy system design-can easily evaluate energy recovery potential, thereby promoting sustainable manufacturing via effective water-energy integration.
3.2.3 Feature engineering and statistical validation
Derived features are computed to boost the predictive power of the dataset as well as to tie down the connection between hydraulic behaviour and energy consumption. The Specific Energy Consumption, calculated as Equation (4), measures the energy needed per unit volume of treated water,
| (4) |
Where, is the energy consumption (kWh) and the water flow rate (m3/h). In contrast, the Flow Power Ratio calculates the energy intensity as per flow and is given by Equation (5),
| (5) |
These derived metrics expose the areas of the plant which energy recovery is the most and thus, help in the selection of sites for hybrid water-energy systems. A Pearson correlation coefficient is used to measure the reliability of the dataset by indicating the correlation between flow and power as shown in Equation (6)
| (6) |
Where, and are the average values of flow and power, respectively. A very strong correlation () indicates that the dataset is a reliable representation of the interaction between hydraulic parameters and energy consumption and that therefore subsequent energy-recovery modeling and hybrid system design will be based on consistent and physically meaningful data.
3.3 Potential Energy Recovery Site Identification
The process of finding out possible places for energy recovery started by checking the hydraulic and operational parameters of the industrial water network to find the high-energy zones that are most suitable for the installation of water-based energy systems. The main factors that are considered are flow rate, pressure, and available head and standard micro-hydropower equations are employed for the calculation of recoverable hydraulic power based on these factors. Potential sites are then categorized according to their power capability through the estimation of annual energy generation, which in turn sets a data-driven basis for the following design and integration of WERS in the industrial processes.
3.3.1 Hydraulic parameter assessment
In this phase, all the industrial water network’s process units or discharge channels are analyzed one by one to find out which ones can produce energy through their hydraulic potential. The flow rate (Qm3/s) is directly measured with process sensors, and the available head () is computed through the pressure at the respective point (), water density (), gravitational acceleration (), and elevation difference (z,m) according to Equation (7),
| (7) |
This analysis pinpointed the spots with enough hydraulic energy to power micro hydro power or hybrid water-energy systems. The pressing and height-driven energy contributions were quantified thus the evaluation only considers the sites for integration into the proposed industrial water-based energy recovery framework that are technically feasible and have high potential, hence supplying a trustworthy basis for later power estimation and design of hybrid systems.
3.3.2 Hydraulic power calculation
After identifying hydraulic parameters for every single process unit, the recoverable hydraulic power (P,W) is estimated to evaluate the energy potential of the related site. The micro-hydropower formula given in Equation (8) is applied for the calculation,
| (8) |
Where, Q (m3/s) represents the flowing rate, H (m) denotes the hydraulic head, (1000 kg/m3) is the density of water, g (9.81 m/s2) is the acceleration due to gravity, and (0.6–0.75) signifies the efficiency of the system. The sites that have a power output of 2 kW or more are considered technically feasible to integrate with the WERS. This process of power calculation gives a quantitative foundation for locating in the industrial water network the areas that are the most suitable for energy recovery.
3.3.3 Annual energy estimation
Next, a yearly energy output (E, kWh/year) is computed based on the site-specific hydraulic power, which is determined beforehand, and the yearly recoverable energy is quantified. This is computed as Equation (9),
| (9) |
Where, P(W) is the recoverable hydraulic power at the site, and t(h/year) represents the total operational hours of the industrial process. Converting power measurements at the instant of time into energy potential for the long term is what this calculation does, and it therefore provides a quantitative basis for comparison and prioritization of sites. It can give the maximum energy contribution but also aligns with the main objective of reaching a sustainable manufacturing pattern through an efficient water-energy integration.
3.3.4 Multi-Criteria site ranking
The evaluation of hydraulic power and annual energy potential for each site involves a multicriteria approach which is used to identify the best locations for WERS integration. The elements that are considered in this evaluation are: flow stability (Qvariation), ease of installation and the energy-to-cost ratio. These criteria are combined into a composite site score () for ranking which is delineated by Equation (10),
| (10) |
Where, relates to the score of the site, (W) indicates the recoverable power of the site, (W) represents the maximum power of all sites, denotes the coefficient of variation of flow which signifies stability, (kWh/year) is the expected annual energy, ($) is the cost of installation, and are the weight factors that show the relative importance of power, stability, and cost-benefit. The sites having the highest are the ones prioritized for integration, thus ensuring that the energy recovery from WERS deployment is maximized.
3.4 Water-Energy Recovery System (WERS) System Design and Integration
The WERS system is a novel concept that not only recovers the hydraulic energy but also captures the ionic energy of the industrial water networks by means of adopting pump-as-turbines, energy storage units, and smart control circuits. The setup works together to convert hydraulic pressure and ionic flow into electrical energy with great efficiency and at the same time provides a continuous supply through storage, and a real-time monitoring system. The modular arrangement is such that it facilitates smooth integration with the existing industrial pipelines and treatment plants, thus making the production process more environmentally friendly not only by recovering more energy but also raising the overall system efficiency.
Hydraulic Energy Conversion
The Pump-as-Turbine unit installed in the WERS converts the hydraulic energy of industrial water flow into mechanical energy first and then into electrical energy, thus making it possible to recover energy in a very efficient manner through the existing water pipelines. The power output of each location is determined using the standard micro-hydropower Equation (11),
| (11) |
Where, is the hydraulic power output in watts (W), is water density 1000 kg/m3), is gravitational acceleration (9.81 m/s2), is volumetric flow rate (m3/s), is the available hydraulic head (m), and is the turbine efficiency (0.6–0.75). The system is matched with the specific site’s flow and head conditions to maximize the amount of energy recovered while still allowing continuous water operation.
Energy Storage and Control
The Energy Storage Unit paired with the Smart Control Circuit take care of the surges from hydraulic to give a constant energy supply. The electrical energy coming from the micro hydropower turbine () can be stored in either batteries or supercapacitors, thus allowing for the surplus energy to be kept for later use and released when needed. The total hybrid power output is given as Equation (12),
| (12) |
Where, denotes total recoverable power (W), is the hydraulic power output (W). The smart control circuit oversees continuously monitoring and controlling flow rates, membranes and storage levels to ensure that efficiency is optimized, overloads are avoided and continuous operation maintained. The combination of storage and adaptive control leads to less dependency on the grid and to a higher energy efficiency which in turn supports the sustainable manufacturing processes in the industrial water network.
3.4.1 Power and energy estimation
In the WERS, the real-time power output from both the hydraulic turbine and membrane-based electro-hydro module is simulated under variable flow and head conditions using MATLAB, which allows for the site-specific energy recovery to be accurately estimated. The overall hybrid power is represented as Equation (13),
| (13) |
Where, is the total electrical power output (W), is water density (1000 kg/m3), is gravitational acceleration (9.81 m/s2), is volumetric flow rate (m3/s), is the hydraulic head (m), is the turbine efficiency, is the constant of proportionality that indicates the ionic conductivity, is the ionic concentration difference across the membrane, and is the membrane conversion efficiency. The total energy conversion efficiency of the WERS is then determined as Equation (14),
| (14) |
This calculation evaluates the performance of the hybrid system very accurately in terms of converting hydraulic energy into electricity, thus supporting the energy efficiency of the industrial sector and the sustainable manufacturing goals of the proposed framework. The simulation not only assesses the performance of the system, but it also facilitates the optimization of the system due to the consideration of its operation under diverse conditions of water flows, heads concentrations. Thus, it is ensured that the WERS design can recover the maximum amount of energy while at the same time being stable in operation.
3.4.2 Sustainability and economic assessment
The sustainability together with the economic performance of WERS are assessed through a combined Life Cycle Assessment and Techno-Economic Assessment framework which quantifies both environmental and financial viability. The environmental impact is represented by the emission reduction and is calculated according to Equation (15),
| (15) |
Where, representing the yearly energy recovered (kWh/year) and being the emission factor of the grid (). The economic scenario is depicted through the payback period (), while the Return on Investment is calculated as per Equation (16),
| (16) |
Where, stands for the total installation cost, denotes the annual savings in energy cost, and is the annual operational cost. This joint approach illustrates how much the WERS has reduced the carbon footprint while still being an economically viable option for the recovery of energy from industry. Integrating Life Cycle Assessment and Techno-Economic Assessment into the design evaluation, the framework guarantees an accomplishment of sustainable manufacturing goals through the mitigation of environmental impact and the utilization of energy in a cost-effective way.
3.5 Model Optimization Using NSGA-II
The multi-objective optimization with the aid of the NSGA-II is the main reason for the WERS being more efficient. This method not only fully recovers energy but also cuts down operating costs to the least possible level while complying with the given restrictions like flow rate, hydraulic head, and minimum power output. The approach assesses possible solutions through several generations, ordering them according to Pareto dominance which will yield the best compromise between efficiency and cost. Thus, it becomes possible to select WERS settings that are environmentally friendly and at the same time economically viable.
3.5.1 Maximization of total recovered energy
In the WERS, the total recovered energy () expresses the sum of electrical energy produced throughout the year by two sources: the hydraulic turbine () and the membrane-based module (). The total recovered energy is thus calculated as in Equation (17),
| (17) |
Where, is the hydraulic power output (W), is the ionic-membrane energy output (W), and is annual operational hours. To maximize means to let the WERS run in a way that no hydraulic energy goes to waste at the same time industrial processes are being carried out. This action is in line with the manufacturing sustainability goal of lessening grid electricity use and carbon emissions, while it also measures performance of different turbine and membrane combinations under different flow and head conditions as quantitatively.
3.5.2 Minimization of total cost
In WERS, it is very important to reduce the total system cost () to make it economically viable and practically implementable in the industrial water networks. The total cost is shown by Equation (18),
| (18) |
Where, denotes the initial installation cost of turbines, membrane modules, storage units, and control systems, whereas signifies the yearly operational expenditure that includes maintenance and energy management. The reduction of results in the WERS being a cost-effective energy recovery solution through high performance. This measure through optimization of system sizing and operational parameters not only supports the achievement of sustainable manufacturing objectives but also enables the industries to save on electricity, get quicker payback, and bring in renewable water-based energy sources without incurring a significant financial burden.
3.5.3 Constraint handling
In the WERS optimization, the constraints of the system guarantee a safe, feasible, and efficient operation within the industrial water networks. The limits are given by Equation (19),
| (19) |
Where, is the volumetric flow rate (m3/s), is the hydraulic head (m), and is the total hybrid power output (W). The restrictions in question, on the one hand, make it impossible for the turbines or membrane modules to get overloaded. On the other hand, they help stabilize the water operations and ensure that the power generation is always sufficient. When these limits are applied, the optimization then identifies the practical layouts that can recover the maximum energy while maintaining operational reliability, cost-effectiveness, and the sustainable manufacturing goals of the proposed framework in line.
3.5.4 Multi-Objective optimization using NSGA-II
The WERS optimization is achieved by the NSGA-II algorithm in an iterative selection, crossover, and mutation process among the population of candidate solutions for several generations. A fitness function that measures energy recovery and cost is defined as Equation (20) for evaluating each solution.
| (20) |
Where, is the fitness score, is the total recovered energy (kWh/year), is the total system cost ($), and are weight factors, and and are normalization constants. The algorithm ranks the solutions according to Pareto dominance, creating a non-dominated front that reveals the best trade-offs. The process results in the arrangement of the WERS, which consists of turbine sizing and storage allocation, thereby ensuring energy recovery maximized, cost minimized, and industrial operation sustainable in line with the objectives of the proposed water-energy framework.
| Pseudocode: NSGA-II Based Multi-Objective Optimization for WERS |
| Start |
| Initialize: |
| Np population size |
| Gmax maximum number of generations |
| Decision_Variables Q, H, T, M # flow rate, head, turbine, membrane |
| Constraints 0 Q Qmax, Hmin H Hmax, Ptot Pmin |
| Objectives maximize E_total, minimize C_total |
| Pareto_front |
| # Step 1: Population Initialization |
| Generate initial population P0 of Np feasible individuals |
| For each individual i P0: |
| Compute E_total(i) = (P_hydro + P_mem) t |
| Compute C_total(i) = C_install + C_operation |
| # Step 2: Non-Dominated Sorting |
| Sort population Pt into Pareto fronts F1, F2, …, Fk |
| Assign dominance rank r(i) to everyone |
| # Step 3: Crowding Distance Assignment |
| For each front Fj: |
| Compute crowding distance d(i) for all individuals |
| # Step 4: Selection Process |
| Apply binary tournament selection using rank r(i) and distance d(i) |
| Form mating pool Qt |
| # Step 5: Genetic Operations |
| Apply simulated binary crossover (SBX) and polynomial mutation on Qt |
| Generate offspring population Rt |
| Ensure offspring satisfy all constraints |
| # Step 6: Fitness Evaluation |
| For each individual i Rt: |
| Evaluate f1(i) = E_total(i) |
| Evaluate f2(i) = C_total(i) |
| # Step 7: Population Update |
| Combine parent and offspring populations: St = Pt Rt |
| Perform non-dominated sorting on St |
| Select best individuals from F1, F2, … until size Np is reached |
| Update Pt+1 |
| # Step 8: Termination Check |
| If t = Gmax: |
| Go to Output |
| Else: |
| Repeat Steps 2–7 |
| # Step 9: Output |
| Pareto_front final non-dominated solutions P* |
| Optimal_Parameters (Q*, H*, T*, M*) selected from P* based on preference |
| Output: |
| Optimal configuration of WERS |
| Performance trade-off (E_total vs. C_total) |
| End |
4 Results and Discussion
The results show that the Best-in-Class scenario produces the highest revenue, NPV, and the shortest payback period so it is the most profitable one. From the environmental perspective, the system reduces carbon emissions by 15,881.76 tons and saves 9,684 ML of water in 20 years. The above-mentioned numbers illustrate the enormous economic and ecological benefits of the system, as well as its ability to recover energy in a green way in industrial water systems.
To further evaluate the robustness and generalizability of the proposed WERS framework, a conceptual sensitivity perspective is considered. The system performance is primarily influenced by key parameters such as Specific Energy Consumption (SEC), Flow Power Ratio (FPR), hydraulic head availability, and wastewater flow variability. Variations in these parameters – due to climatic differences, industrial composition, or infrastructural conditions – may affect the estimated energy recovery potential. For instance, regions with higher wastewater flow rates and stable hydraulic head conditions may yield greater recoverable energy, whereas areas with lower flow stability or higher head losses may experience reduced system efficiency. Similarly, differences in industrial energy intensity and regional emission factors could influence both economic feasibility and CO2 reduction outcomes. Therefore, while the structural framework of WERS remains transferable, sensitivity to hydraulic, operational, and economic parameters should be assessed through region-specific calibration prior to large-scale implementation in diverse geographic contexts.
4.1 Experimental Setup
The experimental setup is showing the simulation of an energy recovery system is shown in Table 1. It contains the main system specifications, which include a 12th Gen Intel i5-12400 CPU with 8 GB RAM, operating in a Windows 11 Pro environment with Python 3.13.5 used for data analysis.
Table 1 Experimental setup and system specifications for energy recovery simulation
| Category | Value |
| Processor | 12th Gen Intel(R) Core (TM) i5-12400 (2.50 GHz) |
| Installed RAM | 8.00 GB (7.75 GB usable) |
| System Type | 64-bit operating system, x64-based processor |
| OS Edition | Windows 11 Pro |
| OS Version | 24H2 |
| Python Version | 3.13.5 |
| Total Records | 1,382 |
| Date Range | 2014-01-01 to 2019-06-27 |
| Time Span (days) | 2003 |
| Final Converged Value (avg_outflow) | 3.9306 |
| Average Outflow | 3.931 |
| Average Inflow | 4.506 |
| Average Temperature (∘C) | 15.0 |
The dataset is made up of 1,382 records that represent the time frame from 2014-01-01 to 2019-06-27 which is a total of 2,003 days. The main parameters are average outflow (3.931) and inflow (4.506), plus the average temperature of 15∘C that are facilitating energy modeling and system optimization.
4.2 Industrial Water-Based Energy Recovery and Micro-Hydropower Potential in Iran
The highest energy recovery potential at 3.2 GWh for the Caspian area, the lowest at 0.005 GWh/Hm3 for the Central, as well as the total of 6.8 GWh from 613 Hm3 are presented in Table 2, which also shows the regional energy recovery potential of six Iranian industrial zones: Caspian, Zagros, Kerman, Khuzestan, Sistan, and Central. The Caspian area comes at the top with respect to potential and volume, where the energy–volume ratio is 0.0291 GWh/Hm3, and then Khuzestan with 1.6 GWh at the same time with 180 Hm3 of water.
Table 2 Energy recovery potential across iranian industrial regions
| Region | Energy (GWh) | Volume (Hm ) | Energy/Volume Ratio |
| Caspian | 3.2 | 110 | 0.0291 |
| Zagros | 0.8 | 95 | 0.0084 |
| Kerman | 0.4 | 60 | 0.0067 |
| Khuzestan | 1.6 | 180 | 0.0089 |
| Sistan | 0.2 | 48 | 0.0042 |
| Central | 0.6 | 120 | 0.005 |
| Total/mean | 6.8 | 613 | 0.0111 |
The lowest flow rate and head resulted in Kerman and Sistan being in the lowest position of energy recovery. Accompanied by mean ratio of 0.0111 GWh/Hm3, the total recoverable energy of 6.8 GWh from 613 Hm3 was confirmed, thus showing the potential of water-based energy recovery in Iran’s industrial sectors to be integrated.
The illustration presents the categorization of hydrometric regions and the potential for energy recovery through Micro-Hydropower (MHP) in Iran. Major hydrological regions such as Caspian, Central, Zagros, Kerman, Khuzestan, and Sistan, were indicated with colored dots.
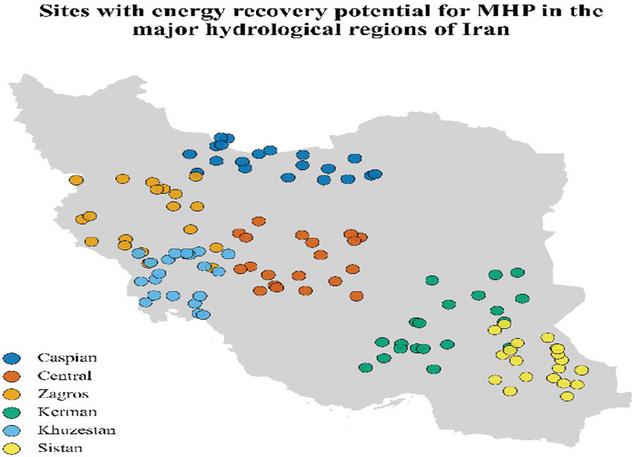
Figure 2 Energy recovery potential for micro-hydropower across Iran’s hydrological regions.
The Figure 2 delineates regions of high potential for energy recovery which are dependent on water flow and other criteria. The color representation not only shows different regions but also signals where it would be most advantageous to introduce the MHP. This visual tool is of great help to planners and renewable energy project developers in Iran as they can identify quickly where the best areas for MHP development are and hence they can easily carry out their activities in various regions of the country.
Table 3 presents the sector-wise industrial energy recovery potential divided among six regions in Iran. The Caspian region stands out with the largest total recoverable energy of 2767.46 MWh, which is mainly from the energy and construction sectors, followed next by Khuzestan with 1427.71 MWh. Zagros and Central regions have moderate recovery levels while Kerman and Sistan regions show lower outputs due to less industrial variety.
Table 3 Sector-Wise industrial energy recovery potential across iranian regions
| Minerals | |||||||
| Metals | Total | ||||||
| Region | Agri-Food | Energy | Construction | Paper | Chemicals | Others | (MWh) |
| Caspian | 42.35 | 1820.52 | 45.11 | 610.25 | 210.33 | 38.9 | 2767.46 |
| Zagros | 25.16 | 812.68 | 30.47 | 208.64 | 112.47 | 24.21 | 1213.63 |
| Kerman | 18.45 | 523.75 | 20.18 | 150.3 | 98.26 | 18.8 | 829.74 |
| Khuzestan | 31.72 | 910.48 | 28.6 | 289.57 | 141.9 | 26.44 | 1427.71 |
| Sistan | 12.64 | 348.29 | 10.54 | 100.62 | 66.83 | 11.37 | 550.29 |
| Central | 22.58 | 785.32 | 19.22 | 204.89 | 95.51 | 18 | 1145.52 |
| Total/Mean | 152.9 | 5200.04 | 154.12 | 1564.27 | 725.3 | 137.72 | 7934.35 |
However, it’s the energy and construction industries that are the largest contributors among all the sectors across all regions. To sum up the total recovery of 7934.35 MWh, it indicates that the water-based energy recovery potential is quite considerable in Iran’s industrial sector.
The map depicts the locations of sample sites in Iran, classified according to their power generation potential is shown in Figure 3. The locations that can produce 15 kW or more power are marked in blue, and the ones with a potential of less than 15 kW are shown in green.
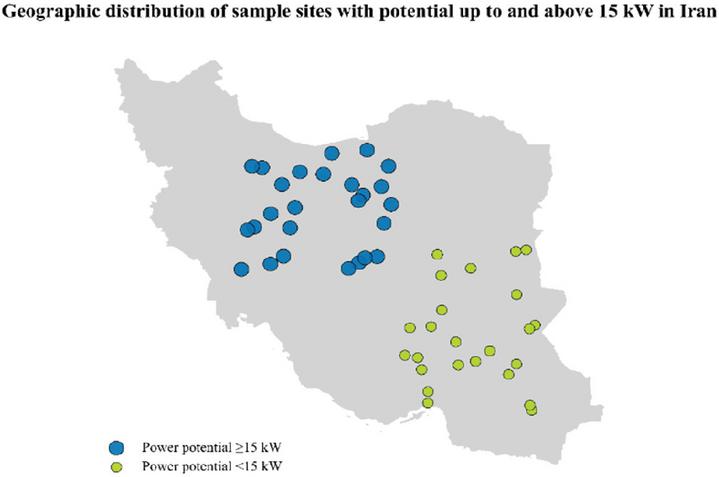
Figure 3 Distribution of micro-hydropower sites in Iran by power potential.
The map shows the whole country where it might be feasible to recover micro-hydropower energy, particularly in the north and west of Iran, where the more potential sites are located. This distribution gives very important information about places that may be the reason for considerable renewable energy generation suitable for the local water flow and other conditions.
4.3 Energy and Flow Dynamics Analysis
The Figure 4 shown shows the Water Treatment Plant Energy Consumption Analysis (2014–2019) and an illustration of the daily energy consumption of the plant for consecutive years. It consists of daily energy consumption (blue lines), the 30-day moving average (red line), and the linear trend (green dashed line) as three main parts. The daily consumption data clearly shows large swings that are due to seasonal changes and the operations of the plant.
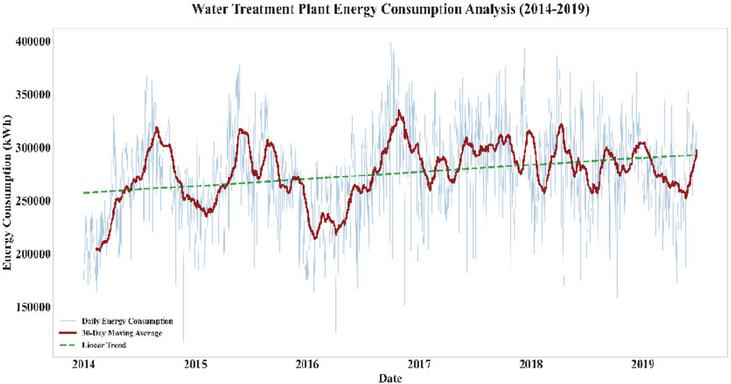
Figure 4 Trends in daily energy consumption at the water treatment plant (2014–2019).
Although the linear trend line shows the consumption of energy increasing yearly, the 30-day moving average is used to smooth the variations and in turn reveal the necessary trends. One of the objectives of this research is to pinpoint the electricity consumption peak periods, which not only helps in identifying the times but also provides useful information for the treatment plant’s operations in terms of energy recovery and efficiency improvement. It acts as a stepping stone for the future energy management strategies.
The upper chart presents the Convergence Plot for Average Outflow Over Time is displayed in Figure 5. The green line depicts the cumulative average of the average outflow from 2014 to 2019. The graph shows that the cumulative average slowly stabilizes over time, which is an indication that the system has already converged and is simply maintaining the steady state.
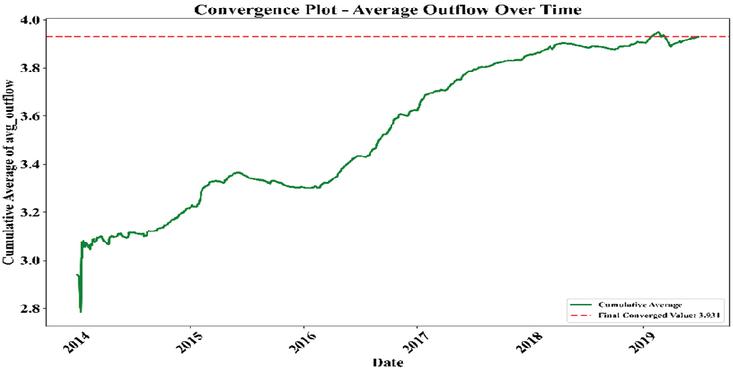
Figure 5 Convergence of average outflow over time (2014–2019).
The red dashed line indicates the final converged value of 3.931, which the system is getting closer to by the end of the analysis period. This plot is a clear indication of the outflow stabilization over time, and this is a factor that supports the evaluation of the reliability and consistency of the system in achieving the best energy recovery conditions.
The Figure 6 displayed above illustrates the Water Flow Balance Analysis, which indicates how the average inflow and outflow are connected through data points that are color-coded according to the energy consumption. The blue dashed line signifies the perfect balance where the inflow and outflow are equal, which means an optimal condition for managing energy efficiently.
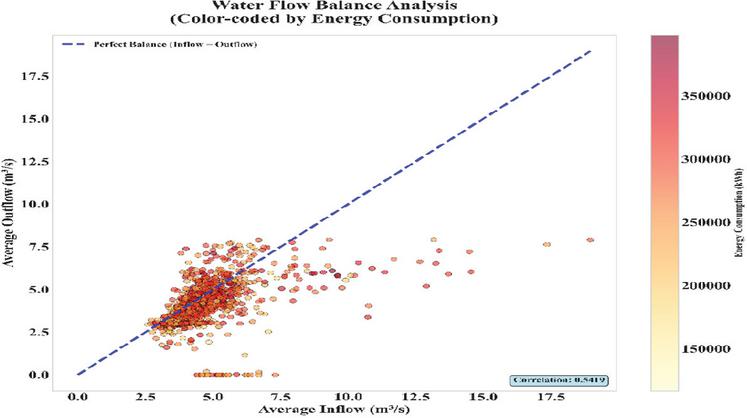
Figure 6 Water flow balance analysis: inflow vs outflow with energy consumption.
The color gradient from yellow to red indicates the energy consumption going up, and thus the highest energy usage corresponds to the highest flows and the lowest being just the other way around. The correlation coefficient value of 0.8419 points to a very strong and direct connection between inflow and outflow, meaning that the energy consumption is going up as the inflow and outflow do, which is the case in the areas where energy recovery can be optimized.
The Figure 7 presented above shows a 3D scatter plot depicting the correlation between energy, flow and temperature. The axes correspond to temperature (∘C), average outflow (m3/s) and energy consumption (kWh), and the data points are colored according to the energy consumed. When the temperature goes up, it is common for the energy usage to especially when the flow rates are high.
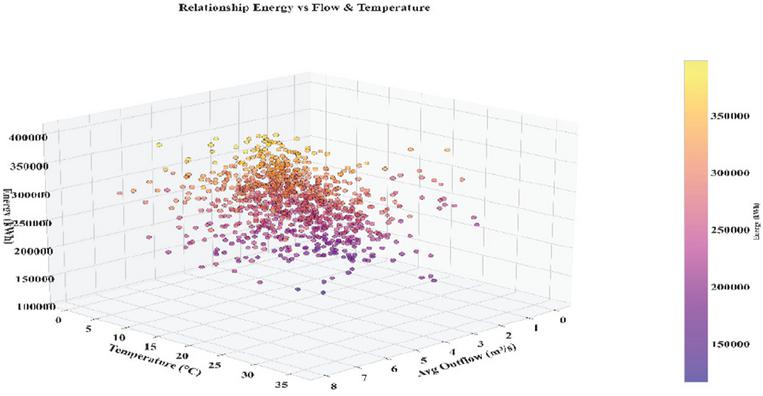
Figure 7 Relationship between energy consumption, flow, and temperature.
The color gradient going from yellow to purple shows that energy consumption is increasing, which is very much the case with both flow and temperature as they are the main contributors to energy use. This plot makes it easy to visualize the tangled relationship among these three factors and at the same time to see that increased temperatures and flow rates do not only imply but require more energy, which is an important factor in the process of water treatment with energy recovery.
The Figure 8 displays the Seasonal Energy Consumption Patterns for the water treatment plant, where the standard deviation is shown alongside the average energy consumption (in kWh) for each season. The different colors of the bars show average energy consumption of each season: Spring, Summer, Autumn, and Winter, whereas the error bars are for the standard deviation.
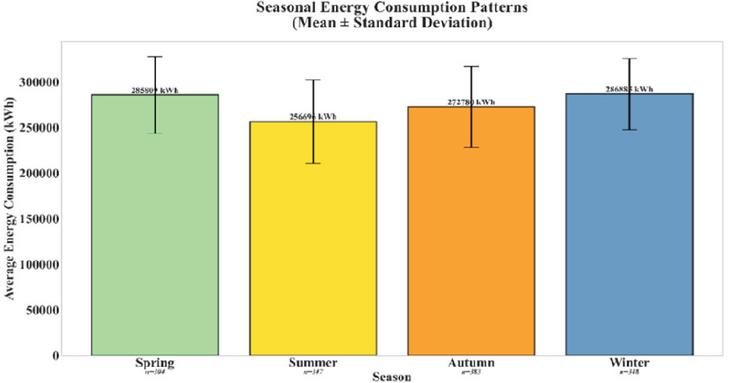
Figure 8 Seasonal variation in energy consumption (mean standard deviation).
Spring accounts for the greatest part of the total energy consumed with 288,809 kWh, and the next one is Winter with 268,558 kWh, then comes Autumn with 277,789 kWh, and lastly Summer with 266,694 kWh. The study demonstrates fluctuation of energy usage during different seasons, where Spring is the peak and the reason might be either high demand for operation or warmer climate.
4.4 Energy Recovery and Performance Analysis
The illustration Figure 9 displays a Pareto Chart for the Biochemical Oxygen Demand Distribution. The BOD values outside of certain ranges are illustrated with blue columns while the total percentage is represented with a red line. The data in the chart indicate in a very clear way that the distribution of BOD values is mainly found in the lowest BOD ranges, that is, 282–353 and 353–424, which therefore have also the highest frequencies.
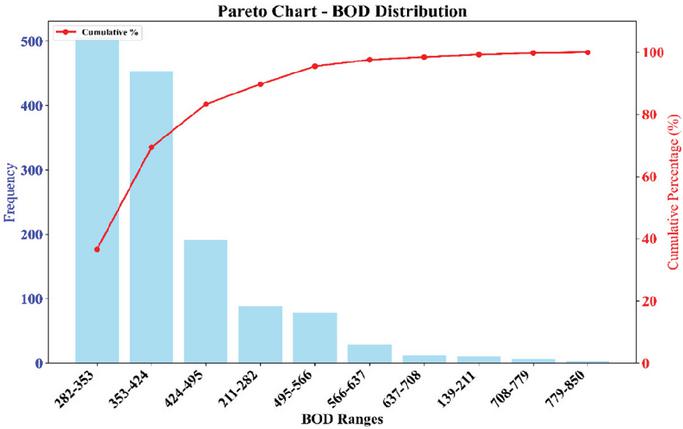
Figure 9 Pareto chart of BOD distribution and cumulative percentage.
The cumulative percentage curve highlights that just a few BOD ranges are responsible for most of the total BOD distribution, thus confirming the Pareto principle. This analysis opens the opportunity to pinpoint the BOD ranges that are to be treated and optimized for energy use the most.
The Table 4 illustrates the energy recovery potential of different places in a water treatment plant, characterized by the same hydraulic head, turbine efficiency, power potential, and annual energy production for each site. Locations such as Outlet Distribution and Inlet Pressure Station show more significant energy recovery potential, with the annual energy output of 260.5 MWh and 306.3 MWh, respectively.
Table 4 Energy recovery sites
| Site Location | Hydraulic Head (m) | Turbine Efficiency (%) | Power Potential (kW) | Annual Energy (MWh) | Grid Offset (%) | Installation Cost ($) | Payback Period (Years) | Priority Rank |
| Outlet Distribution | 4 | 80 | 35.28 | 260.5 | 8.5 | 105840 | 6.8 | 1 |
| Inlet Pressure Station | 5 | 75 | 41.48 | 306.3 | 10 | 124440 | 6.5 | 2 |
| Primary Treatment | 3 | 70 | 23.2 | 171.3 | 5.6 | 69600 | 7.2 | 3 |
| Secondary Treatment | 2.5 | 65 | 17.94 | 132.5 | 4.3 | 53820 | 7.5 | 4 |
| Tertiary Filtration | 2 | 60 | 13.25 | 97.8 | 3.2 | 39750 | 7.8 | 5 |
| TOTAL | – | 70 | 131.15 | 968.4 | 31.6 | 393450 | 7.16 | – |
Besides, the table gives such numbers as installation costs, payback periods, and priority ranks for each site, which indicate the economic feasibility of energy recovery arrangements. The priority rank derives from a mix of factors such as energy recovery capacity and economic viability, thus directing the selection of the site for the initiation of energy recovery projects.
The Figure 10 illustration illustrates the Energy Consumption Time Series Decomposition above and it separates the energy-consumption data from 2014 to 2019 into its basic elements. Original time series is shown in A, where emphasis is given to the changes in energy use. The long-term trend component which is B indicates a gradual and slight rise in energy consumption during the period. C, the seasonal component, is shown that alternating changes in energy use most likely due to the seasons.
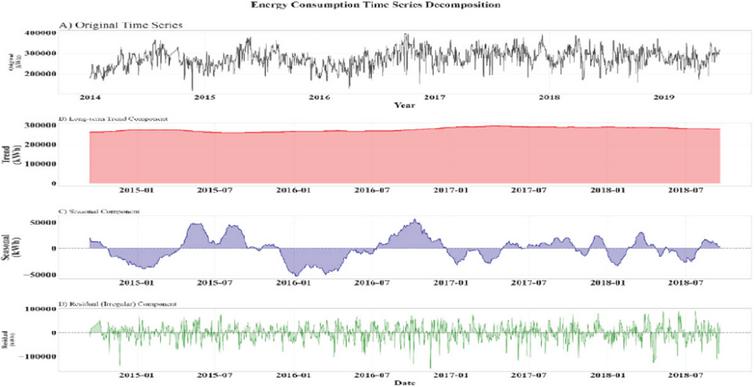
Figure 10 Decomposition of energy consumption time series (2014–2019).
The residual (irregular) component follows in D, and it is the part of the data that is considered just noise or irregularities. Decomposition of this kind is a very effective way of discovering patterns and trends, which in turn is a prerequisite for drawing up an efficient energy management strategy.
4.5 Statistical and Economic Analysis of Water Treatment and Energy Systems
The Figure 11 shows a Feature Correlation Matrix for the water treatment and energy system which demonstrates the correlation between different features. The described matrix contains the parameters: total_grid, avg_outflow, avg_inflow, BOD, COD, etc., along with their respective correlation coefficients in every cell. The right-side color gradient reveals the correlation strength where green denotes strong positive correlations, and red reveals negative correlations.
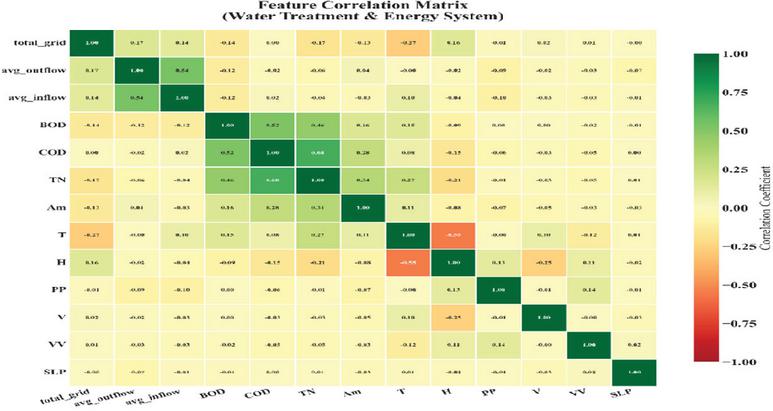
Figure 11 Feature correlation matrix for water treatment and energy system variables.
The correlation values that the matrix displays are from 1 to 1 with 1 being the highest positive correlation. Avg_outflow and avg_inflow have a strong positive correlation of 0.84, which is the case for H (hydraulic head) and T (temperature) connection giving a negative correlation of 0.53. This matrix is a tool that gives enlightening insights on the dependencies among the most important system variables, thereby facilitating energy savings and the use of the right treatment methods.
The demonstrates the interplay of energy consumption and temperature, and the degree of humidity is represented by colors is displayed in Figure 12. A polynomial fit (degree 3) has been applied to the data which clearly indicates the negative relationship between the two variables, i.e., the consumption of energy reduces with increase in temperature.
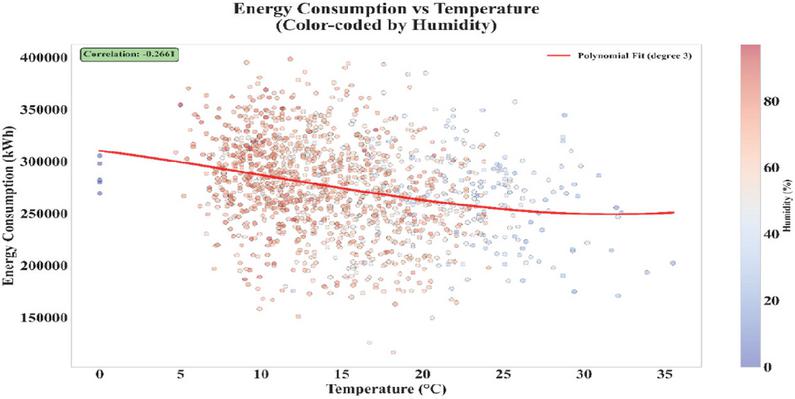
Figure 12 Energy consumption vs. temperature with humidity as a color code.
The correlation coefficient of 0.7661 marks the presence of a robust inverse correlation. The gradient of colors on the right side illustrates the different levels of humidity with red color representing high and blue low humidity thus making the role of environmental factors in energy consumption more visible.
Graph below shows a Figure 13 Monthly Energy Consumption (2014–2019) with signs of variation in each month. The blue line denotes the monthly mean energy consumption (kWh), and the lighted area marks the min-max range for all the months. The red error bars signify the 1 standard deviation, revealing the volatility in power usage.
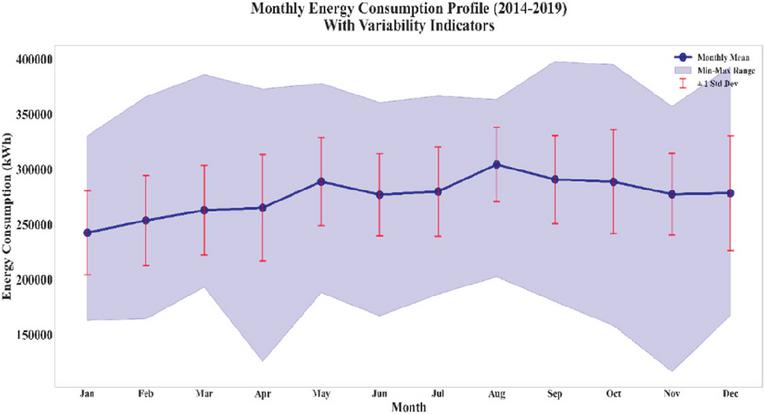
Figure 13 Monthly energy consumption profile (2014–2019) with variability indicators.
The plot displays patterns in energy consumption with changeability during different months, and it also assists in recognizing the times of maximum and minimum consumption which is very important in the application of energy management and optimization strategies.
The Figure 14 presents a Year-over-Year Energy Consumption Comparison from 2014 to 2019, with box plots used to visualize the data so to have a straightforward view of the reported energy consumption (kWh) by each year through the median (green line) and mean (red diamond) values. The box plots illustrate the interquartile range, while outliers are marked as circles.
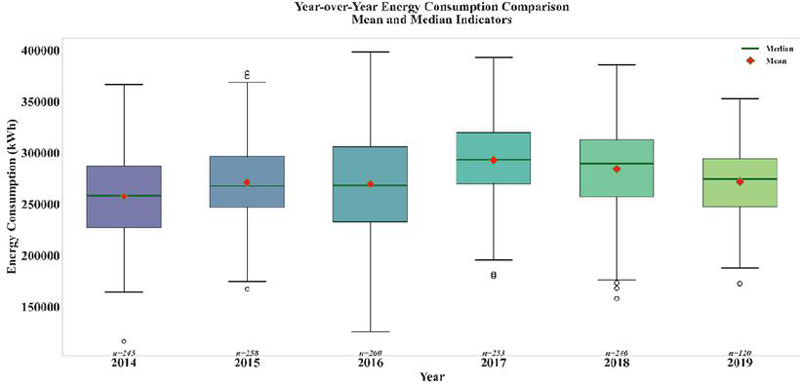
Figure 14 Comparison of yearly energy consumption: mean and median values (2014–2019).
Through this analysis, the distribution and variation in energy consumption are revealed, trends and changes in energy usage over the years are also pointed out, and thus, the consistency and fluctuations in the system’s performance are inferred.
4.6 Economic and Environmental Impact Analysis of Energy Recovery Scenarios
The Table 6 of economic analysis displays four distinct investment scenarios (Pessimistic, Base Case, Optimistic, and Best-in-Class) along with their respective CAPEX, installation costs, annual revenue, and net annual benefits. Additionally, it covers major financial indicators like payback period, Net Present Value, Internal Rate of Return (IRR), and Benefit-Cost Ratio (BCR).
Table 5 Economic analysis of energy recovery scenarios
| Scenario | Total CAPEX ($) | Installation Cost ($) | Total Investment ($) | Electricity Tariff ($/kWh) | Capacity Factor (%) | Annual Revenue ($) | Annual O&M ($) | Net Annual Benefit ($) | Payback Period (years) | NPV (15 years @ 8%) ($) | IRR (%) | BCR (Benefit-Cost Ratio) |
| Pessimistic | 420000 | 105000 | 525000 | 0.1 | 70 | 55188 | 10500 | 44688 | 11.7 | -142350 | 5.2 | 0.73 |
| Base Case | 393450 | 98363 | 491813 | 0.15 | 85 | 124155 | 9836 | 114319 | 4.3 | 486885 | 21.8 | 1.99 |
| Optimistic | 370000 | 92500 | 462500 | 0.2 | 90 | 175680 | 9250 | 166430 | 2.8 | 951730 | 34.5 | 3.06 |
| Best-in-Class | 350000 | 87500 | 437500 | 0.25 | 95 | 232163 | 8750 | 223413 | 2 | 1478265 | 49.1 | 4.38 |
Table 6 Environmental impact table
| Year | Annual Generation (MWh) | Cumulative Generation (MWh) | Annual Carbon Avoided (tCO2) | Cumulative Carbon Avoided (tCO2) | Net Carbon Benefit (tCO2) | Water Saved (ML) | Trees Equivalent | Homes Powered |
| 1 | 968.4 | 968.4 | 794.088 | 794.088 | 739.088 | 484.2 | 33594.91 | 121.05 |
| 5 | 968.4 | 4842 | 794.088 | 3970.44 | 3915.44 | 2421 | 177974.5 | 605.25 |
| 10 | 968.4 | 9684 | 794.088 | 7940.88 | 7885.88 | 4842 | 358449.1 | 1210.5 |
| 15 | 968.4 | 14526 | 794.088 | 11911.32 | 11856.32 | 7263 | 538923.6 | 1815.75 |
| 20 | 968.4 | 19368 | 794.088 | 15881.76 | 15826.76 | 9684 | 719398.2 | 2421 |
The Best-in-Class scenario out of the investment scenarios yields the highest annual revenue and NPV, as well as the shortest payback period indicating the best economic outcome, while on the other hand, the Pessimistic scenario shows the worst financial performance.
In a 20-year horizon, the environmental benefits of energy generation are depicted in the table through annual and cumulative generation, MWh, and carbon avoidance in tons of CO2, besides water savings in million liters. It also computes the number of trees equivalent, and houses powered.
The Table 6 reveal an impressive reduction in carbon and water usage with a total carbon avoidance of 15,881.76 tons for the cumulative water savings of 9,684 ML by the end of year 20, thus emphasizing the environmental contribution of the energy recovery system.
Limitations
This study is based on full-scale wastewater treatment plant data collected from six industrial regions in Iran. Therefore, the quantitative findings, including the estimated 6.8 GWh recoverable energy and regional potential rankings, reflect the specific climatic, hydraulic, and industrial structural conditions of these regions. The dataset may not fully represent industrial contexts in other climate zones, industrial compositions, or wastewater characteristics. Variations in seasonal flow behavior, wastewater temperature, organic load concentration, treatment technology, and hydraulic head availability could significantly influence energy recovery outcomes.
If the proposed WERS framework is extended to other regions such as China or Europe, recalibration of several key parameters would be required. These include Specific Energy Consumption (SEC), Flow Power Ratio (FPR), hydraulic head loss characteristics, turbine efficiency under local flow regimes, membrane performance parameters, regional electricity emission factors, and economic variables such as energy tariffs and infrastructure costs. Therefore, while the WERS methodology is transferable in structure, site-specific hydraulic modeling and techno-economic reassessment are essential before implementation in different geographic and institutional contexts.
5 Conclusion and Future Works
In this research, a detailed Water-Energy Recovery System framework was introduced to hydraulic energy extraction, multi-criteria site evaluation, and NSGA-II–based optimization, which all together formed a big support for sustainable industrial manufacturing. With real-scale wastewater treatment data from six Iranian industrial areas, the system was able to identify a recoverable energy potential of 6.8 GWh from 613 Hm3 of wastewater and among the regions Caspian was the biggest winner. The optimized arrangement produced a peak power generation of 31,110.72 kW and facilitated a yearly CO2 reduction of 2.23 108 kg, thus pointing at the combination of water-based energy systems in industrial locations as both technically viable and eco-friendly. Economic assessments additionally supported the results with their indications of short payback periods and high techno-economic viability. The study was influenced by multiple limitations. The dataset was confined to a specific area and thus might not be a complete representation of industrial systems having very different hydraulic conditions. Moreover, insufficient access to high-resolution hydraulic sensor data limited the accuracy of transient analysis. The economic evaluation did not consider long-term aging of components, possible outages, or tariff fluctuations, which all affect the financial investment returns.
Real-time hydraulic monitoring via smart sensors, Digital Twin models for continuous system calibration, and flexible optimization to deal with dynamic and very variable flows will be the main points of future research. Also, large-scale pilot projects in different industrial sectors, integration with automated control systems, and life-cycle costing will be the methods of testing the scalability and long-term reliability of hydraulic energy recovery systems based on the nature of the application.
Declaration
Data Availability
The datasets generated and/or analyzed during the current study are available from the corresponding author upon reasonable request.
Conflicts of Interest
The authors declare that they have no known financial or personal conflicts of interest that could have influenced the work reported in this paper.
Funding Statement
This work was supported by the following projects: Key Project of Jiangsu Social Science Fund (Grant No.: 23GLA003); Youth Program of Jiangsu Science and Technology Think Tank (Grant No.: JSKX 0125 098); 2025 Social Science Research Project of Nantong (Special Project on the Reform of Industrial Workers Team Construction, Grant No.: 59); 2025 Youth Work Research Project of Nantong (Grant No.: 20250022); Second Batch of Young and Middle-aged Backbone Teachers Training Project of Nantong Institute of Technology (Grant No.: ZQNGGJS202245). The authors also acknowledge Nantong Institute of Technology and Nanjing University of Aeronautics and Astronautics for providing necessary research infrastructure and support.
Author Contribution
Xiaoxia Lu contributed to the study conceptualization, methodology development, data preprocessing, analysis, system design, optimization modeling, and manuscript writing. The author reviewed and approved the final manuscript.
Ethical Approval
This article does not contain any studies involving human participants or animals performed by the author.
Consent to Participate
Not applicable.
Consent to Publication
The author consents to the publication of this manuscript.
Competing Interests
The author declares no competing interests.
Acknowledgment
The author would like to thank the industrial wastewater treatment facilities and local authorities for providing access to operational datasets that made this research possible. Appreciation is also extended to colleagues who offered technical insights during the development of the WERS optimization framework.
References
[1] Y. Tian, J. Wang, X. Hu, X. Song, J. Han, and J. Wang, “Energy Prediction Models and Distributed Analysis of the Grinding Process of Sustainable Manufacturing,” Micromachines, vol. 14, no. 8, p. 1603, Aug. 2023, doi: 10.3390/mi14081603.
[2] G. Marras, G. Carcangiu, P. Meloni, and N. Careddu, “Circular economy in marble industry: From stone scraps to sustainable water-based paints,” Constr. Build. Mater., vol. 325, p. 126768, Mar. 2022, doi: 10.1016/j.conbuildmat.2022.126768.
[3] C.-L. Hsieh and W.-H. Tsai, “Sustainable Decision Model for Circular Economy towards Net Zero Emissions under Industry 4.0,” Processes, vol. 11, no. 12, p. 3412, Dec. 2023, doi: 10.3390/pr11123412.
[4] X. Pei, M. Italia, and M. Melazzini, “Enhancing Circular Economy Practices in the Furniture Industry through Circular Design Strategies,” Sustainability, vol. 16, no. 15, p. 6544, July 2024, doi: 10.3390/su16156544.
[5] J. C. Lopes et al., “Reducing carbon footprint in grinding: exploring green manufacturing to mitigate CO2 emission from cutting fluids,” Int. J. Adv. Manuf. Technol., vol. 129, no. 11–12, pp. 5691–5708, Dec. 2023, doi: 10.1007/s00170-023-12676-4.
[6] R. Raman, D. Pattnaik, H. H. Lathabai, C. Kumar, K. Govindan, and P. Nedungadi, “Green and sustainable AI research: an integrated thematic and topic modeling analysis,” J. Big Data, vol. 11, no. 1, p. 55, Apr. 2024, doi: 10.1186/s40537-024-00920-x.
[7] B. Johansson et al., “Challenges and opportunities to advance manufacturing research for sustainable battery life cycles,” Front. Manuf. Technol., vol. 4, p. 1360076, Aug. 2024, doi: 10.3389/fmtec.2024.1360076.
[8] E. Santos, M. Carvalho, and S. Martins, “Sustainable Water Management: Understanding the Socioeconomic and Cultural Dimensions,” Sustainability, vol. 15, no. 17, p. 13074, Aug. 2023, doi: 10.3390/su151713074.
[9] A. Dev, R. Kumar, and R. P. Saini, “Experimental evaluation of performance of a hybrid solar photovoltaic (PV/T) panel integrated with effective cooling solutions with water base nanofluids and phase change materials,” Energy Sources Part A, vol. 44, no. 3, pp. 7287–7302, Sept. 2022, doi: 10.1080/15567036.2022.2107732.
[10] A. D. A. Bin Abu Sofian, H. R. Lim, K. W. Chew, and P. L. Show, “Advancing 3D Printing through Integration of Machine Learning with Algae-Based Biopolymers,” ChemBioEng Rev., vol. 11, no. 2, pp. 406–425, Apr. 2024, doi: 10.1002/cben.202300054.
[11] E. Baniasadi, A. Rezk, Y. B. Tola, A. Alaswad, M. Imran, and P. Humphries, “Renewable-driven hybrid refrigeration system for enhancing food preservation: Digital twin design and performance assessment,” Energy Convers. Manag., vol. 322, p. 119165, Dec. 2024, doi: 10.1016/j.enconman.2024.119165.
[12] D. Bruno, M. Ferrara, F. D’Alessandro, and A. Mandelli, “The Role of Design in the CE Transition of the Furniture Industry – The Case of the Italian Company Cassina,” Sustainability, vol. 14, no. 15, p. 9168, July 2022, doi: 10.3390/su14159168.
[13] K. Shen et al., “Life cycle assessment of lithium ion battery from water-based manufacturing for electric vehicles,” Resour. Conserv. Recycl., vol. 198, p. 107152, Nov. 2023, doi: 10.1016/j.resconrec.2023.107152.
[14] R. K. Nishan et al., “Development of an IoT-based multi-level system for real-time water quality monitoring in industrial wastewater,” Discov. Water, vol. 4, no. 1, p. 43, July 2024, doi: 10.1007/s43832-024-00092-y.
[15] B. Denkena, M. Wichmann, S. Kettelmann, J. Matthies, and L. Reuter, “Ecological Planning of Manufacturing Process Chains,” Sustainability, vol. 14, no. 5, p. 2681, Feb. 2022, doi: 10.3390/su14052681.
[16] C. D. Iweh, S. Gyamfi, E. Tanyi, and E. Effah-Donyina, “Distributed Generation and Renewable Energy Integration into the Grid: Prerequisites, Push Factors, Practical Options, Issues and Merits,” Energies, vol. 14, no. 17, p. 5375, Aug. 2021, doi: 10.3390/en14175375.
[17] G. Allan, I. Eromenko, M. Gilmartin, I. Kockar, and P. McGregor, “The economics of distributed energy generation: A literature review,” Renewable and Sustainable Energy Reviews, vol. 42, pp. 543–556, Feb. 2015, doi: 10.1016/j.rser.2014.07.064.
[18] C. L. T. Borges, “An overview of reliability models and methods for distribution systems with renewable energy distributed generation,” Renewable and Sustainable Energy Reviews, vol. 16, no. 6, pp. 4008–4015, Aug. 2012, doi: 10.1016/j.rser.2012.03.055.
[19] J. Maldonado-Romo et al., “Advancing sustainable manufacturing: a case study on plastic recycling,” Prod. Manuf. Res., vol. 12, no. 1, p. 2425672, Dec. 2024, doi: 10.1080/21693277.2024.2425672.
[20] M. Tegtmeier, L. Knierim, A. Schmidt, and J. Strube, “Green Manufacturing for Herbal Remedies with Advanced Pharmaceutical Technology,” Pharmaceutics, vol. 15, no. 1, p. 188, Jan. 2023, doi: 10.3390/pharmaceutics15010188.
[21] X. Xie, J. Zhu, S. Ding, and J. Chen, “AHP and GCA Combined Approach to Green Design Evaluation of Kindergarten Furniture,” Sustainability, vol. 16, no. 1, p. 1, Dec. 2023, doi: 10.3390/su16010001.
[22] K.-C. Yao et al., “An Eco-Innovative Green Design Method using the Theory of Inventive Problem Solving and Importance–Performance Analysis Tools – A Case Study of Marker Pen Manufacturing,” Sustainability, vol. 15, no. 19, p. 14414, Oct. 2023, doi: 10.3390/su151914414.
[23] A. C. H. J. Thebuwena, S. M. S. M. K. Samarakoon, and R. M. C. Ratnayake, “On the Necessity for Improving Water Efficiency in Commercial Buildings: A Green Design Approach in Hot Humid Climates,” Water, vol. 16, no. 17, p. 2396, Aug. 2024, doi: 10.3390/w16172396.
[24] M. Niekurzak, W. Lewicki, H. H. Coban, and A. Brelik, “Conceptual Design of a Semi-Automatic Process Line for Recycling Photovoltaic Panels as a Way to Ecological Sustainable Production,” Sustainability, vol. 15, no. 3, p. 2822, Feb. 2023, doi: 10.3390/su15032822.
[25] O. Khan et al., “Development of a novel energy efficient integrated system for concurrent waste water treatment, hydrogen production and carbon capture – A sustainable approach,” Int. J. Hydrog. Energy, vol. 137, pp. 1223–1234, June 2025, doi: 10.1016/j.ijhydene.2024.10.069.
[26] D. Yang and C. Vezzoli, “Designing Environmentally Sustainable Furniture Products: Furniture-Specific Life Cycle Design Guidelines and a Toolkit to Promote Environmental Performance,” Sustainability, vol. 16, no. 7, p. 2628, Mar. 2024, doi: 10.3390/su16072628.
[27] M. Despeisse et al., “A systematic review of empirical studies on green manufacturing: eight propositions and a research framework for digitalized sustainable manufacturing,” Prod. Manuf. Res., vol. 10, no. 1, pp. 727–759, Dec. 2022, doi: 10.1080/21693277.2022.2127428.
[28] K. Remic et al., “Environmental Assessment of Forest-Based Industry Products with CAD-Integrated LCA Tools: A Comparative Case Study of Selected Software,” Forests, vol. 15, no. 11, p. 1909, Oct. 2024, doi: 10.3390/f15111909.
[29] X. Zhang, X. Wang, C. Zhang, and J. Zhai, “Development of a cross-scale landscape infrastructure network guided by the new Jiangnan watertown urbanism,” Ecol. Indic., vol. 143, p. 109317, Oct. 2022, doi: 10.1016/j.ecolind.2022.109317.
[30] S. Khalid et al., “Recovery of valuable substances from food waste by ohmic heating assisted extraction – A step towards sustainable production,” Future Foods, vol. 9, p. 100365, June 2024, doi: 10.1016/j.fufo.2024.100365.
[31] C. De Ponte, M. C. Liscio, and P. Sospiro, “State of the art on the Nexus between sustainability, fashion industry and sustainable business model,” Sustain. Chem. Pharm., vol. 32, p. 100968, May 2023, doi: 10.1016/j.scp.2023.100968.
[32] A. M. A. S. Azad et al., “Advancing Economical and Environmentally Conscious Electrification: A Comprehensive Framework for Microgrid Design in Off-Grid Regions,” Glob. Chall., vol. 8, no. 11, p. 2400169, Nov. 2024, doi: 10.1002/gch2.202400169.
[33] K.-C. Yao et al., “Sustainable Packaging Solutions: Food Engineering and Biodegradable Materials,” Designs, vol. 8, no. 6, p. 133, Dec. 2024, doi: 10.3390/designs8060133.
[34] N. Von Drachenfels, J. Husmann, U. Khalid, F. Cerdas, and C. Herrmann, “Life Cycle Assessment of Battery Cell Production: Using a Modular Material and Energy Flow Model to Assess Product and Process Innovations,” Energy Technol., vol. 11, no. 5, p. 2200673, May 2023, doi: 10.1002/ente.202200673.
[35] F. Bagehrzadeh, “Full Scale Wastewater Treatment Plant Data,” vol. 1, Aug. 2021, doi: 10.17632/pprkvz3vbd.1.
Biography

Xiaoxia Lu, Born in Nantong, Jiangsu Province. Member of the Communist Party of China. Currently a doctoral candidate, Lecturer, Craft Artist, and Intermediate Economist. She serves as the Vice President and Deputy Secretary-General of the Nantong Industrial Design Association. Professor Lu has published more than 20 papers in various journals, presided over 15 research projects and participated in 6 others. She has co-compiled 2 textbooks and 1 monograph, and been granted 3 invention patents and 2 software copyrights. Research Interests: Industrial Design, Environmental Design, Ecological Environment Assessment and Governance.
Distributed Generation & Alternative Energy Journal, Vol. 41_3, 615–654
doi: 10.13052/dgaej2156-3306.4135
© 2026 River Publishers