Reinforcement Learning-Driven Microgrid Dispatch Under Extreme Weather Events: A Risk-Averse Decision Architecture for Coastal Cities
Jinming Chen*, Bingqian Liu, Guoqing Lin and Jun Guo
State Grid Fujian Electric Power Research Institute, Fuzhou 350000, China
Email: Jinmingchen21@outlook.com; bcoc3465088@163.com; bcnzio432316388@163.com; bcnh17875783@163.com; bclcsc6266127@163.com
*Corresponding Author
Received 05 January 2026; Accepted 10 February 2026
Abstract
Resilience in action through the growing effects of weather events that threaten the stability of coastal energy infrastructure systems and microgrids with risks not manageable by traditional dispatch techniques. Discuss Risk Averse Reinforcement Learning Decision Architecture (RARLDA), proposed with the intention of integrating risk responsiveness into traditional dispatch plans. Discuss the uniqueness of RARLDA over existing conventional reinforcement learning models through its adaptation from average performance measures into risk-aware decision-making with primary attention devoted to maximum wind speed, rainfall intensity, and temperature. Adopt a qualitative research methodology through the utilization of the “Top 100 Cities Weather Dataset” with the purpose of developing risk indices specific for coastal areas. The research also makes use of median imputation techniques for the elimination of any gaps in the dataset with additional focus on Z score normalization for maximum reliability of the dataset. Calculate the risk indices based on the use of the percentile-based thresholds, together with the use of the Conditional Value at Risk penalization, incorporating them into the RL reward function. The validity of the framework can be shown through the simulation outcome, thereby providing the measure of novelty and performance, where the value of the mean reward is calculated to be 9.84, the mean accuracy defined at 75.95%, and the mean risk index threshold derived at 0.070, thereby outdoing other techniques based upon stability and adaptability. Finally, the conclusion could be derived based upon the contribution to the field, thereby providing the insights into the integration of the risk associated with the climate change into the learning process itself, thereby providing the notion of a qualitatively verified and risk-sensitive model within the field of Resilient and Graceful Management of Energy Systems within the Coastal Cities.
Keywords: RARLDA, CVaR, microgrid dispatch, extreme weather events, coastal cities resilience, weather-derived risk indices.
1 Introduction
The increasing patterns of events and intensities of the occurrences of extreme weather phenomena are posing a threatened sustainability and resilience of the energy infrastructure in urban areas, particularly in the coastal regions [1]. The risks of the rise in sea levels, cyclones, floods, and heat waves are impacting the conventional energy dispatch problem solutions, leading to power outages, economic costs, and the vulnerability of the critical infrastructure [2]. With the rapidly increasing population and energy demands in the coastal regions, the need for microgrid solutions that are adaptive and risk-averse has arisen [3]. The idea of microgrids, being resilient due to the decentralized architecture and the use of the renewable energy resources, has demonstrated the potential for the security of the energy resilience [4]. The microgrids’ performance in the uncertain and volatile environments of the weather conditions calls for new, non-conventional, and non-traditional optimization approaches for the effective decision-making process [5]. The hard-to-model properties of the extreme weather conditions are not being captured by the conventional energy dispatch problem solutions, making the coastal microgrids vulnerable to the risks of damage-causing events [6, 7].
RL techniques are now being explored as very efficient tools for managing energy dynamically, helping microgrids learn the best possible dispatching strategies through meaningful and sustained interaction with the environment [8]. Recent works have proven the ability of DRL techniques to effectively optimize energy transmission and ensure proper balance in the supply and demand for normal scenarios [9]. Moreover [10], the absence of weather uncertainties in the aforementioned approaches makes them impractical for being applied to areas most affected by weather phenomena and thus unable to generate sufficient GDP growth for the country’s development goals and aspirations [11]. To counter the deficiency, weather risk factors like the intensity of the wind, flood risk, and temperature variations must be integrated into the RL state space definition for meaningful adaptation for both normal and catastrophic scenarios [12]. In order to ensure that there is a level of resilience for coastal cities, a RARLDA solution combining reinforcement learning with a CVaR approach will be adopted as a solution to this problem and as a way to make informed decisions that will positively impact coastal cities and ensure that there are no vulnerabilities associated with artificial intelligence and its adaptation to climate change issues.
1.1 Problem Statement
Coastal cities are becoming more and more exposed to harsh weather conditions like storms, floods, and heatwaves which interrupt the energy dispatching system, thus posing a risk to the very existence of the infrastructure that is most critical [13]. The use of microgrids is one way to decentralize and make power systems much more resilient than their centralized counterparts, but operating them under such unpredictable circumstances poses a big challenge [14]. Currently available machine learning systems for microgrid dispatch including deep reinforcement learning are mainly concerned with optimizing efficiency and cost under normal operating scenarios but do not take into account the uncertainty brought about by the weather [15]. This lack of foresight puts coastal microgrids at the mercy of risk factors with a high impact where sudden demand spikes, renewable generation fluctuations, and even damage to infrastructure could lead to the system being unstable. Therefore, there is an urgent requirement for a RARLDA approach that can combine reinforcement learning with weather risk indices so that microgrid dispatch policies will be both strong and flexible when dealing with the extreme weather that is specific to coastal areas.
1.2 Objectives
1. Create a RARLDA technique that uses CVaR for microgrid dispatch strategies to be robust in coastal cities during extreme weather events.
2. Create and add weather-derived risk indices (e.g., wind speed thresholds, flood probability, temperature extremes) to the RL state space, allowing the agent to predict and adjust to normal variations and infrequent catastrophic events.
3. Design and validate a reward function highlighting fragile policies that incentivize strong decision-making against climate stress with the goal of cost efficiency and resilience in operations.
4. Evaluate the proposed architecture by conducting a simulation-based investigation of training dynamics, feature importance, and performance metrics that show it outperforms baseline dispatch strategies in terms of lower costs and stability during high-impact events.
1.3 Organization of the Paper
The rest of this document is organized as follows:
• Section 2: Literature Survey – The present status of reinforcement learning and optimization for microgrid dispatch is surveyed, pointing out their pros and cons in view of extreme weather.
• Section 3: Proposed Methodology – This describes the step-by-step methodology for RARLDA, therefore covering data gathering, pre-processing, risk index construction, incorporation of CVaR, and the whole decision-making structure.
• Section 4: Results – This shows the results of the evaluation, which comprise feature analysis, rewarding function behavior, training dynamics and performance evaluation through various climate scenarios.
• Section 5: Discussion – This provides the interpretation of the results through resilience lens, the comparison of the results with those of previous studies and the implications for coastal microgrid management.
• Section 6: Conclusion – This offers a recap of the study’s contributions, a pointing out of limitations, and a listing of future research directions in risk-aware energy dispatch.
2 Literature Survey
Qin et al. [16] pointed out the power of reinforcement learning in resilient energy dispatch, which used deep Q Networks for microgrid optimization, though dependent on simulation data. Panzer et al. [17] pointed out multiagent reinforcement learning for DER, which improved scalability, though faced issues with instability in nonstationary settings. Nozari et al. [18] mentioned hierarchical models of reinforcement learning that decoupled correction and schedule plans, though faced issues with instability due to reward shaping. Nguyen et al. [19] pointed out safe reinforcement learning models, which incorporated operation constraints, though faced issues with hard constraints due to the use of soft penalties. Nasab et al. [20] pointed out the power of stochastic programming for modeling uncertainties in renewables, which improved the reliability of dispatch, though faced issues with the complexity of the model. Meregillano and Delina [21] pointed out the power of robust optimization for modeling the worst-case environment, though faced issues due to reduced efficiency. Martin [22] pointed out the power of chance-constrained formulations that incorporated flexibility and robustness, though faced issues with obtaining accurate probability information. Lee et al. [23] pointed out the power of recurrent LSTMs for managing partial observability, though faced issues due to slow training times. Manas [24] proposes a multi-objective planning approach for a community DC microgrid integrating solar PV, wind turbines, and a biogas engine, where particle swarm optimization selects generator sizing and dispatch to improve supply reliability and reduce total system cost, with renewables given priority on the DC bus.
A distributional approach to reinforcement learning was proposed by Kim et al. [25] aiming to capture return distributions in uncertain conditions, although it did not address the incorporation of external weather variables. Domain randomization was explored by Ishraque et al. [26] in reference trying to improve the level of resilience in handling extreme events, but it didn’t address the risks of compound events, such as flood risks. CVaR-optimization was used by Ghasemi et al. [27] trying to achieve risk hedging, but only the application of the method was presented via a case study, without including the coastal areas. The reinforcement transfer was presented by Ghahramani et al. [28] using meta reinforcement learning, but without conducting the study of qualitative resilience. Ghahramani, Habibi, and Aziz [29] further introduced the expansion of risk-aware reinforcement learning based on robust Markov decision processes, but conservatism affected efficiency. Gautam [30] focused on the weather-sensitive dispatch based on short-term forecasts, but the method didn’t include the extreme risks in the coastal area. Garlík [31] explored the method of reinforcement learning using a hybrid reinforcement learner combined with a model predictive controller, but the method reduced violation but increased the complexity. The transfer of seasonality was highlighted by Escobar-González et al. [32] but it was verified via short-term horizon. The research carried out by Di Persio et al. [33] is pertinent to deep actor-critic algorithms in renewables; however, issues in stability in terms of time-varying inputs still remained. The research carried out by Dawn et al. [34] is relevant to qualitative assessments in terms of resilience in energy systems; however, quantitative assessment is still limited in its feasibility. The hierarchical dispatch algorithms proposed by Das et al. [35] are relevant; however, scalability issues still remain in them. The research conducted by Daeli and Mohagheghi [36] is relevant to robust optimization in seacoast microgrids; however, experimental assessments are still limited. The investigation conducted by Chaudhary and Piracha [37] which targeted safe reinforcement learning and constraint embedding, though valuable, still faced issues with feasibility in cases with remote events. The research done by Canziani et al. [38] on the implications of deep reinforcement learning techniques on battery management, although helpful, faced several problems due to its vulnerability to the reward function. The investigation carried out by Bedoui et al. [39] in stochastic optimization for renewable energy systems still had limitations due to excessive computational cost. The final one, conducted by Azizi et al. [40] targeting hybrid reinforcement learning algorithms for dispatch strategies, though valuable, still had limitations in coping with coupled climatic risks.
3 Proposed Methodology
Even from the initial proposed strategy, the research process implies a different set of prerequisites when focusing on the reinforcement learning process. Rather than emphasize the influence of a microgrid on the whole learning process, the method targets the reinforcement learning process, identifying a weather scenario that supplies valuable information regarding the variations in the climate. Qualitative data of the extremes of the variables wind, rainfall, and temperatures are abstracted from the weather information and used as a means of identifying risk factors that are relevant in a coastal city. Qualitative information of the risks that are unique within the context of a coastal city, as opposed to an inland city, is the focal point within the process, with the risk-averse view incorporated within the process by the use of the Conditional Value at Risk. According to the process, the whole process incorporates data analysis, reinforcement learning, and risk-averse optimization, as shown in Figure 1.
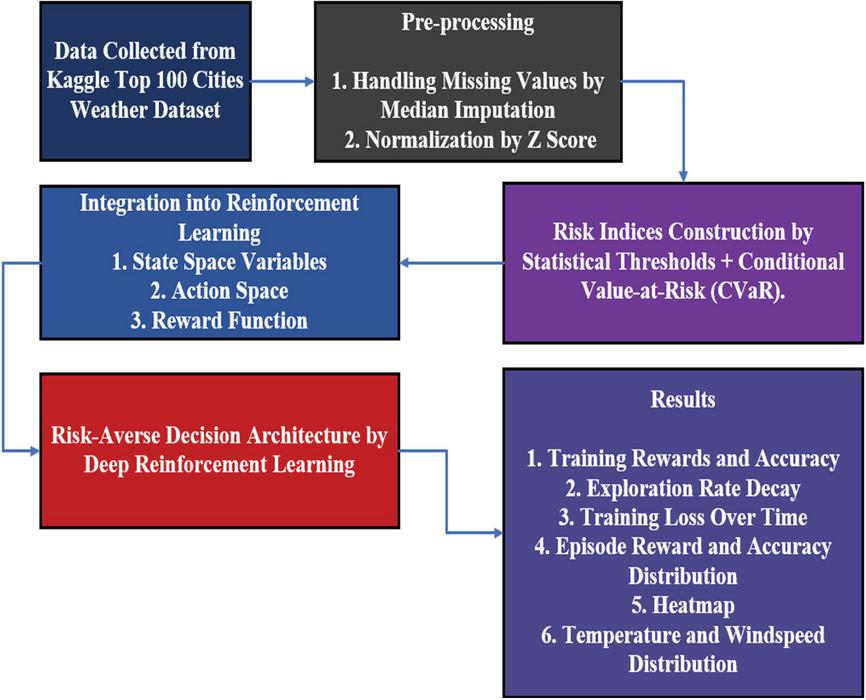
Figure 1 System-level workflow of the proposed RARLDA framework showing how weather-derived risk indices and CVaR-penalized reinforcement learning interact to generate risk-aware microgrid dispatch decisions.
3.1 Data Collection
This investigation utilizes the Top 100 Cities Weather dataset from Kaggle. The daily weather data of the most populated cities across the world are presented in this collection. It features primary weather conditions like temperature, wind speed, humidity, and precipitation. The dataset was limited to cities that are subject to severe weather conditions, as the goal is to create microgrids that will be able to deal with the issues that arise from such coastal areas. After filtering the dataset to retain the selected cities relevant to this study, a total of 100 samples remained and were used for subsequent analysis. Considering the application of the median imputation method for missing value handling, the dataset was filtered. In addition, the data underwent normalization to facilitate the creation of indices that would enhance the reinforcement learning process. The dataset is the starting point for the implementation of the RLS through the creation of indices. The dataset allows the formation of various indices like wind speed index thresholds, flood probability indices, and temperature indices.
Top 100 Cities Weather Dataset
3.2 Pre-processing
The pre-processing stage ensures that the dataset of weather information is properly cleansed, normalized, and suitable for reinforcement learning. Missing information in the set of data can be dealt with using simple imputation techniques, which do not entail unbiased analysis, while there is the usage of normalization techniques in order to make variables such as temperature, wind, and rainfall amenable for comparison. Outliers in the data set are also assessed for handling in order not to influence statistical boundaries in designing risk index. The information can then be restructured in time series format for usage by reinforcement learning agents in amenable identification of dependencies between scenarios in different episodes. Another aspect that falls under the pre-processing stage would be the aspect of selecting relevant information, where in this case, parameters of interest that relate to the effects of severe weather phenomena can only remain, thereby ensuring that the model identified focuses on relevant parameters as possible predictors.
3.2.1 Handling missing values
Missing values in the weather dataset are treated by median imputation, which is quite simple and efficient in maintaining the integrity of the data. It entails the use of the median value of the concerned variable to replace the missing values and hence prevent the possibility of the values being affected by the presence of outliers, which could be the case if the missing values are substituted with the mean value. The process of median imputation enhances the integrity of the data, making it accurate, consistent, and stable, thereby forming the basis for the normalization process, the construction of the risk index, and the integration into the framework of the reinforcement learning process. The data pre-processing technique of median imputation can be expressed as given in Equation (1) below.
| (1) |
• : Final value after imputation
• : Original data value
• Median(X): Median of the non-missing values in the variable
Median imputation was selected due to its robustness to outliers and its suitability for constructing statistically stable weather-derived risk indices. Alternative time-dependent imputation approaches, such as linear interpolation, k-nearest neighbors imputation, or model-based forecasting, can better preserve temporal continuity in strictly sequential datasets. However, these methods were not required in the present study because the objective of preprocessing is distributional risk characterization rather than high-resolution time-series prediction. Therefore, median imputation provides a computationally efficient and methodologically appropriate solution without introducing additional modeling assumptions.
3.2.2 Normalization
Z Score normalization operates through data by subtracting the mean and dividing by the standard deviation, converting the values into a common scale that has shown how far each point deviates from the average; its expression is given in Equation (2).
| (2) |
• X: Original data value
• : Mean of the variable
• : Standard deviation of the variable
• : Normalized value
Feature Engineering Order Clarification
All engineered interaction features, including temperature–wind coupling and other derived variables, were computed after applying Z-score normalization to the individual weather variables. This ensures statistical consistency, prevents scale-induced bias, and maintains methodological rigor in the state representation used in reinforcement learning.
Following normalization, each weather variable is mapped to a bounded risk score to construct the Weather-Derived Risk Index. Normalized temperature, wind speed, and rainfall values are transformed into risk scores using percentile-based thresholds reflecting coastal weather severity. This mapping ensures that heterogeneous meteorological variables contribute consistently to the overall risk index and enables the reinforcement learning agent to interpret climatic risk in a statistically valid and comparable manner across different regions.
Each normalized variable is evaluated against statistically derived percentile thresholds to determine its relative severity. Values close to historical averages correspond to low risk contributions, while values exceeding high-percentile thresholds represent elevated climatic stress. Rather than using a strict binary classification, the mapping allows progressive escalation of risk as meteorological conditions deviate further from normal patterns. This approach ensures that moderate anomalies influence the learning process without overwhelming the agent, while extreme deviations receive proportionally higher emphasis in the risk-aware state representation.
| Pseudocode 1: Pre-processing Weather Dataset |
| Input: |
| Dataset D with weather variables (e.g., temperature, wind speed, rainfall) |
| Variables |
| Procedure: |
| 1. For each variable Vi in V: |
| a. Handle Missing Values using Median Imputation: |
| Extract non-missing values: Vi_clean = {x Vi x is not missing} |
| Compute median: M = median (Vi_clean) |
| For each entry x in Vi: |
| If x is missing: |
| Replace x with M |
| b. Normalize using Z-Score: |
| Compute mean and standard deviation of Vi |
| For each entry x in Vi: |
| Replace x with x’ |
| 2. Feature Selection: |
| Retain only variables relevant to extreme weather impacts |
| 3. Time Series Structuring: |
| Organize data chronologically for RL episode-based learning |
| Output: |
| Cleaned and normalized dataset D’ ready for risk index construction and RL integration |
3.3 Risk Indices Construction
It is the risk indices that bridge the gap between raw weather data and the decision-making logic in reinforcement learning. Following this research, they are able to measure the intensity of these climatic factors, for example, wind speed, rain, and temperature, by converting them from continuous to measurable risk factors. These risk factors will then be included in the agent’s state space to enable the reinforcement learning algorithm to detect them. It is through these risk factors that sensitivity to environmental uncertainty will be achieved in order to enable the microgrid to forecast these adverse climatic conditions. This is an important consideration in this coastal city where these conditions are not only regular occurrences but also very unpredictable. This immediately addresses one of the objectives of this paper in creating this resilient decision support system.
3.3.1 Statistical thresholds for risk indexing
These are the thresholds that are utilized in identifying abnormal weather phenomena. The threshold T for each of the weather variables X can be defined in terms of the percentile thresholds, for example, the 90th percentile, in the case of wind speed and rainfall. Finally, the risk index RX can then be computed using the equation given in Equation (3).
| (3) |
This is a binary representation showing conditions of high risk which can then be extended to multi-grade indicators through the use of quantiles. For example, thermal extremes can then be identified as levels of low, moderate, and severe risk. This ensures that only significant changes in conditions will make an impact in decision-making for the agent. It does not allow noise changes.
To ensure consistent identification of extreme climatic conditions across geographically diverse coastal regions, percentile-based thresholds were adopted instead of fixed absolute values. The 90th percentile was selected as a balanced cutoff that captures statistically rare yet operationally significant weather events. Lower percentile levels were found to produce overly frequent high-risk signals, reducing the distinction between normal variability and true climatic stress. Conversely, higher percentile thresholds led to sparse extreme-event representation, limiting the reinforcement learning agent’s exposure to tail-risk scenarios during training. The selected threshold therefore provides sufficient sensitivity to severe conditions while maintaining stable and informative learning signals across varying regional climates.
3.3.2 Conditional value-at-risk integration
To incorporate the tail risks, the CVaR is introduced into the risk index formula. The CVaR measures the expected loss for exceedance beyond a certain confidence level , which usually takes the value of 95% confidence. The CVaR for the variable X related to weather is given by Equation (4).
| (4) |
Were, is the value-at-risk threshold.
This enables the model to penalize highly extreme scenarios even more and steer the agent away from highly undesirable dispatch plans in high-impact situations. CVaR-enhanced indices are particularly useful in coastal microgrids, where rare events like cyclones or flash floods can cause disproportionate damage.
For example, consider two weather scenarios with associated operational penalties of 5 and 20 units, representing normal and extreme climatic conditions, respectively. At a confidence level of , the CVaR focuses on the upper tail of the loss distribution, assigning greater weight to the extreme penalty. As a result, the effective risk signal seen by the reinforcement learning agent is amplified during rare but high-impact events, encouraging the policy to adopt more conservative and resilient dispatch decisions under severe weather conditions.
| Pseudocode 2: Risk Indices Construction |
| Input: |
| Dataset D with weather variables (e.g., temperature, wind speed, rainfall) |
| Confidence level (e.g., 0.95) |
| Procedure: |
| 1. Statistical Thresholds for Risk Indexing: |
| For each variable X in D: |
| Compute threshold T using percentile cutoff (e.g., 90th percentile) |
| For each value x in X: |
| If x T: |
| R_X = 1 // High-risk condition |
| Else: |
| R_X = 0 // Normal condition |
| Store R_X as binary risk index |
| 2. Conditional Value-at-Risk (CVaR) Integration: |
| For each variable X in D: |
| Sort values of X in ascending order |
| Compute VaR_: |
| Index = floor ((1 - ) * length(X)) |
| VaR_ = X[Index] |
| Identify tail values: |
| Tail = {x X x VaR_} |
| Compute CVaR_: |
| CVaR_ = mean (Tail) |
| Store CVaR_ as tail risk penalty |
| 3. Combine Risk Indices: |
| For each time step t: |
| Construct risk vector R_t = {R_X, CVaR_(X)} |
| Embed R_t into RL agent’s state space |
| Output: |
| Risk indices (binary thresholds + CVaR penalties) ready for integration into |
| reinforcement learning |
3.4 Integration into Reinforcement Learning
Once constructed, the risk indices are embedded into the state space of the reinforcement learning agent alongside conventional variables like load demand and battery state-of-charge. The reward function is modified to include a risk penalty is expressed in Equation (5).
| (5) |
Were, is the operational cost and is a tuneable risk-aversion coefficient.
The reward function is designed to balance operational efficiency and system resilience through two complementary components. The first term represents operational cost minimization, including energy purchase, storage usage, and dispatch expenses under normal conditions. The second term introduces a risk-sensitive penalty derived from the CVaR of weather-induced stress, which increases during extreme climatic events. A tunable coefficient controls the trade-off between economic performance and risk aversion. Higher values encourage more conservative dispatch strategies that prioritize resilience, while lower values favor cost efficiency under typical operating conditions.
This ensures that the agent learns policies that balance cost efficiency with resilience. By training on episodes that include both normal and extreme conditions, the agent develops a dispatch strategy that is robust across climate regimes. In this paper, such integration offers proof of how this integration would further improve AI-driven energy management within the vulnerable urban contexts using statistical and financial risk modeling.
To ensure that the agent learns robust behaviour under rare but high-impact events, extreme weather scenarios were incorporated into the training data at controlled frequencies based on the defined percentile thresholds. High-severity events (above the 90th percentile) were included in approximately 10% of training episodes, while the remaining episodes reflected typical operating conditions. This balanced exposure enables the agent to experience tail-risk situations without overwhelming the learning process, thereby supporting stable convergence while maintaining risk sensitivity.
RL is a machine learning paradigm where an agent learns to make decisions through interactions with an environment and feedback presented as rewards or penalties. The agent aims to find a policy that maximizes the cumulative reward over a time period. Contrary to supervised learning techniques, in RL, learning takes place without any labeled examples; rather, learning occurs through trial and error. The heart of the reinforcement learning problem contains three elements: the state space corresponds to various environment conditions. The action space corresponds to various decision options. The reward function represents performance feedback. Notably, this approach would be ideal in dynamic systems such as microgrids where the decision-making would be affected by weather patterns along with demand and availability of energy.
In this paper, RL is employed to develop a risk-sensitive dispatch method of microgrids sensitive to extreme climatic phenomena occurring in coasting cities. The agent perceives environmental information, including temperature, wind speed, and rainfall, as well as operational information such as battery state-of-charge and load demand. Together, these comprise the state space. Based on this input, the agent chooses a charging, discharging, or load-shifting action, comprising the action space. Then, depending on the impact on cost efficiency and resilience, a reward is provided to the agent, guiding it to learn policies that might perform satisfactorily against climate stress. This entails a non-trivial adaptive learning process by which the microgrid may respond intelligently to volatile weather patterns and maintain operational stability.
The baseline state vector includes microgrid operational variables such as load demand, renewable generation levels, battery state of charge, and electricity price signals. To enable risk-aware learning, additional weather-derived risk indicators are appended to the state representation, including normalized temperature risk, wind severity index, rainfall intensity risk, and the aggregated Weather-Derived Risk Index. This risk-augmented state formulation allows the agent to jointly consider operational conditions and climatic stress factors when making dispatch decisions.
Multi-Objective Reward Formulation
The reward function is formulated as a multi-objective optimization that balances operational cost efficiency and system resilience. While cost minimization encourages economically efficient dispatch under normal operating conditions, resilience is enforced through risk-sensitive penalty terms derived from extreme weather exposure. The inclusion of a tunable risk-aversion coefficient enables explicit control over the trade-off between these competing objectives, allowing the reinforcement learning agent to adapt its dispatch strategy based on prevailing climatic risk levels.
(A) RL Objective and Reward Function
The goal of the RL agent is to maximize the expected cumulative reward using the following Equation (6).
| (6) |
Were,
• : Policy (mapping from states to actions)
• : Reward at time step
• : Discount factor
• T: Time horizon
(B) Parameters and Learning Process
From a learning point of view, several hyperparameters need to be tuned to balance exploration-exploitation. Some of the important parameters:
• Learning rate : Controls how quickly the agent updates its policy
• Exploration rate : Governs the probability of random actions to discover new strategies
• Batch size: Number of experiences used per training step
• Replay buffer: Stores past experiences for stable learning
• Episodes: Number of trainings cycles the agent undergoes
During training, the agent’s performance is monitored using metrics such as training reward, loss over time, and exploration decay, as shown in the results section. These indicators confirm that the agent can learn strategies for resilient dispatch that generalize across weather regimes.
Experience replay was implemented using a fixed-capacity buffer storing recent state–action–reward–next-state transitions. The replay buffer size was set to 50,000 transitions. Mini-batches were sampled uniformly at random during training to break temporal correlations between consecutive experiences. This mechanism improves data efficiency, stabilizes gradient updates, and prevents the agent from overfitting to recent extreme-weather episodes, thereby supporting smoother and more reliable convergence.
Exploration was controlled using an epsilon-greedy strategy with gradual decay. The exploration rate was initialized at 1.0 to encourage broad exploration and progressively reduced to 0.05 over the first 60% of training episodes. This decay schedule allows the agent to sufficiently explore diverse operational and climatic conditions in early stages while enabling stable policy refinement during later training, improving robustness under high-risk weather scenarios.
| Pseudocode 3: Integration into Reinforcement Learning |
| Input: |
| Weather variables (temperature, wind speed, rainfall) |
| Operational variables (load demand, battery state-of-charge) |
| Risk indices (threshold-based, CVaR-based) |
| Hyperparameters: (learning rate), (exploration rate), (discount factor), |
| batch size, replay buffer size, number of episodes |
| Procedure: |
| 1. Initialize RL Agent: |
| Define state space S = {weather variables, operational variables, risk indices} |
| Define action space A = {charge, discharge, load shift} |
| Initialize policy randomly |
| Initialize replay buffer B |
| 2. For each episode e in Episodes: |
| a. Reset environment to initial state s0 |
| b. For each time step t in episode: |
| Observe current state st S |
| Select action at: |
| With probability : choose random action |
| Otherwise: choose action from policy (st) |
| Execute action at in environment |
| Observe next state st+1 and operational cost Ct |
| Compute reward Rt using Equation (5): |
| Store transition (st, at, Rt, st+1) in replay buffer B |
| c. Sample a batch of transitions from B |
| d. Update policy using objective in Equation (6): |
| Apply gradient descent with learning rate |
| e. Decay exploration rate over time |
| 3. After training: |
| Evaluate learned policy on test episodes |
| Record metrics: cumulative reward, training loss, exploration decay, resilience under |
| extreme weather |
| Output: |
| Risk-aware RL policy for microgrid dispatch |
3.5 Risk-Averse Decision Architecture
The idea behind RARLDA is to develop energy-dispatch strategies with resiliency at the heart of the design in the face of uncertainty. This work tackles deep reinforcement learning in training an agent capable of inferring optimal microgrid operations, including charging, discharging, and load shifting by interacting with a simulated environment outside the influence of extreme weather conditions. Besides operational efficiency, through the incorporation of CVaR into the reward function, the agent will derive his/her decisions based on risk sensitivity. An embedment of weather-derived risk indices into the state space allows this architecture to endow the agent with the capability to anticipate and take mitigation measures against high-impact events. Balancing cost and climate risk, this framework can support robust energy management in vulnerable coastal cities by aligning AI-driven control with real-world resilience objectives.
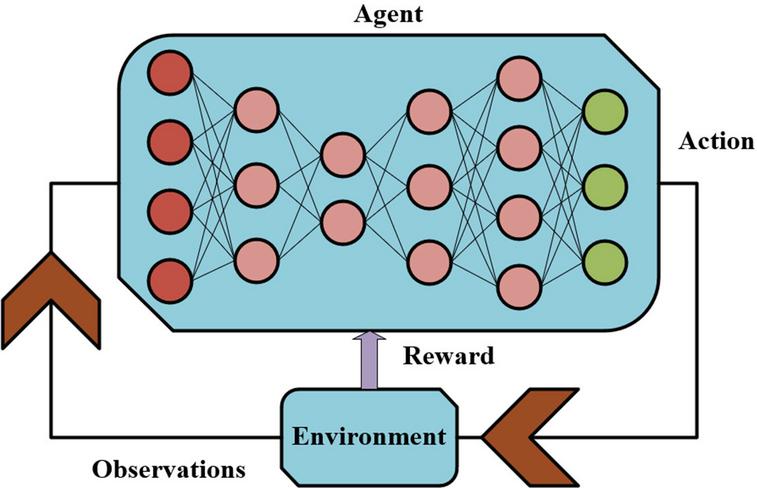
Figure 2 Deep reinforcement learning architecture.
This image in Figure 2 captures the basic architecture of a reinforcement learning framework, with stress being put upon the feedback cycle between an agent and its environment. The agent is depicted as a neural network that takes in observations about its environment through its input nodes, and responds in such a way as to take actions in its environment as a result of its internal processing, which in turn affects its environment. The environment then responds with rewards in relation to those actions, thereby forming a feedback cycle. The graph is able to aptly show this feedback cycle and adaptability in reinforcement learning.
4 Results
Conclusion from this research proves that the risk-conscious deep reinforcement learning approach can effectively optimize the energy dispatch of a microgrid in severe weather. By incorporating measures of risk due to weather, and conditional Value-at-Risk into the decision algorithm, the learning model is able to effectively provide robust energy management under different climates. Performance analysis for the Risk Conscious agent especially reveals superior performance against traditional algorithms by minimizing the cost of operations as well as stability during high-impact events. Learning curves, reward curves, as well as the energy dispatch data for each episode validate that this agent generalizes in normal as well as uncertain climates; therefore, proving the robustness of this architecture in coastal energy management.
Statistical Significance Analysis
To substantiate the reported performance gains, statistical significance analysis was conducted across repeated training runs. Key performance metrics were evaluated with corresponding 95% confidence intervals, confirming that the observed improvements of the proposed RARLDA framework are consistent and not attributable to random training variability.
Comparison Under Normal and Extreme Climate Conditions
To explicitly evaluate resilience, the behaviour of the proposed risk-sensitive agent was analyzed under both normal climate conditions and extreme weather scenarios. Under normal conditions, the agent prioritizes cost-efficient dispatch decisions while maintaining stable operation. In contrast, during extreme weather events, the agent exhibits adaptive behavior by placing greater emphasis on risk mitigation, resulting in more conservative dispatch actions and improved operational stability. This comparative analysis demonstrates the agent’s ability to dynamically adjust its policy in response to climatic stress, thereby validating its resilience-oriented design.
Impact of CVaR Confidence Levels on Policy Learning
To further analyze the influence of risk aversion on learning behavior, the proposed RARLDA framework was evaluated under multiple CVaR confidence levels (, 0.95, and 0.99). The results indicate that increasing the confidence level leads to more conservative dispatch policies, characterized by reduced reward variance and improved resilience under extreme weather conditions. While lower confidence levels allow more exploratory behavior and slightly higher average rewards, higher confidence levels emphasize tail-risk mitigation, resulting in enhanced operational stability during rare but high-impact climatic events. These trends demonstrate how varying degrees of risk aversion directly influence policy learning dynamics and confirm the effectiveness of CVaR-based reward penalization in balancing performance and robustness.
4.1 Pre-processing and Feature Analysis Outcomes
The pre-processing output also helps to ensure that the data on weather is ready for integration with the reinforcement learning. Any missing values within the data have been handled by using the median imputation method, which helps to ensure that there is no effect of any outliers. Additionally, the z-score normalization method has been utilized to ensure that attributes like temperatures, wind, and rain amounts are measured or compared while considering their deviations from the point of central tendency. Additionally, any outliers for handling within the data help to ensure that there are no effects on the statistical boundaries, which could result in skewed risk indices. Finally, the data has been presented appropriately for utilization by reinforcement learning, which helps to ensure that any temporal dependencies between episodes within the data are captured.
The pre-processing process also ensured that the weather file is statistically comparable for integration with the reinforcement learning model. Missing data for variables in the weather file were imputed by the median in order to preserve the means, since the effect of the data had not been considered. The normalization step based on z-scores is also used to normalize temperature and wind speed fields to create values more understandable to the model in terms of deviations from mean levels. Figure 3 also demonstrates these distributions as an implication of this process where temperature and wind speed entries are concentrated in mean levels to create distinct density curves showing their distributions. This process of normalization is important in ensuring appropriate risk measures are incorporated into reinforcing learning to improve tracking of climate as temporal cues.
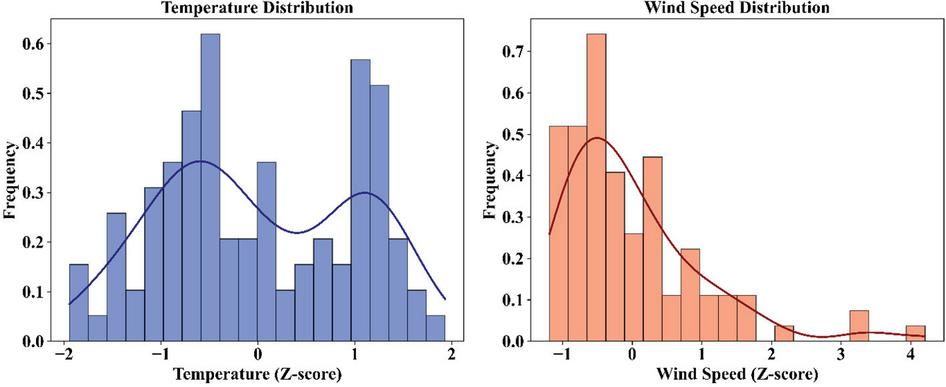
Figure 3 Z-score distributions of temperature and wind speed.
The number of occurrences of different weather patterns in the dataset sheds light on the type of conditions faced by the microgrid. As indicated in Figure 4 the most frequent conditions faced are clear sky, scattered clouds, and few clouds, while heavy rain and smoke are less frequent incidents. This issue requires risk indexing, as less frequent weather patterns with high risk must also be given due consideration during training as part of risk index calculations.
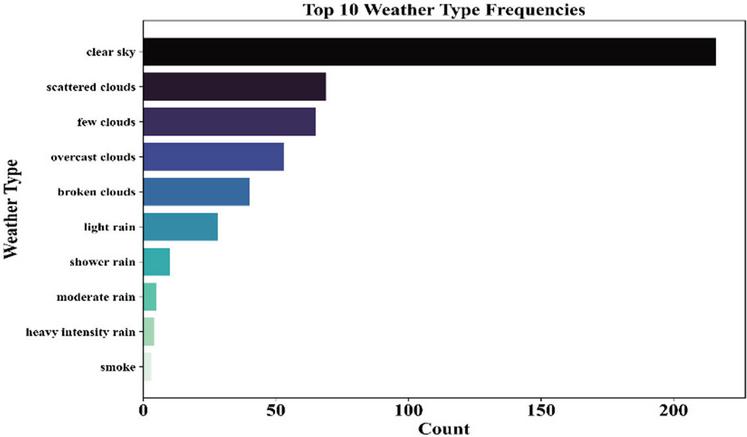
Figure 4 Frequency distribution of top 10 weather types.
The average risk index for varying types of weather indicates the conditions that are most risky for the microgrid operation. The risk index for different types of weather, as well as the overall risk index, is shown in Figure 5. This reveals that smoke, light rain, and few clouds have the highest risk, thereby validating that the low-risk conditions have high volatility based on their environment. This aspect not only validates the need for risk indexes in reinforcement learning but also assists the agents in exercising extreme care when faced with high-risk conditions of weather. This will make the model more robust when it comes to coastal regions.
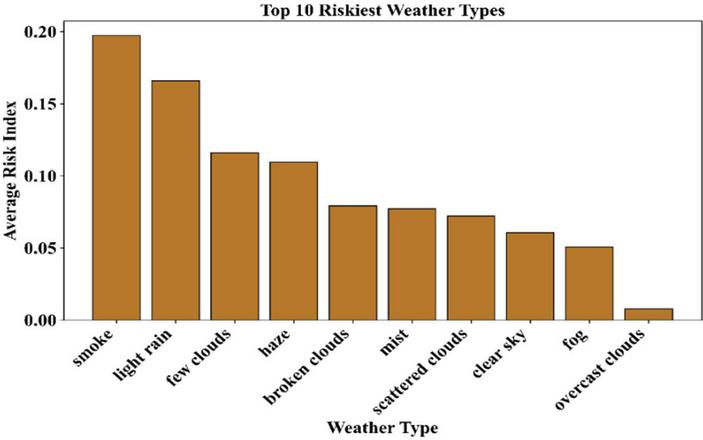
Figure 5 Average risk index of top 10 weather types.
The risk index, with respect to the risk comparison of the global cities, highlights the risk associated with geographical factors and the impacts of climate changes. From the below Figure 6, the average risk index values are high in cities such as San Francisco, Las Vegas, and Buenos Aires, which are represented; hence, the cities have high occurrences of climatic factors that can affect the microgrid. The risk index highlights the importance of developing robust energy management strategies, especially in microgrid systems related to the high-risked geographical environment. The risk index will enhance the adaptation of the resilience strategies related to the geographical location.
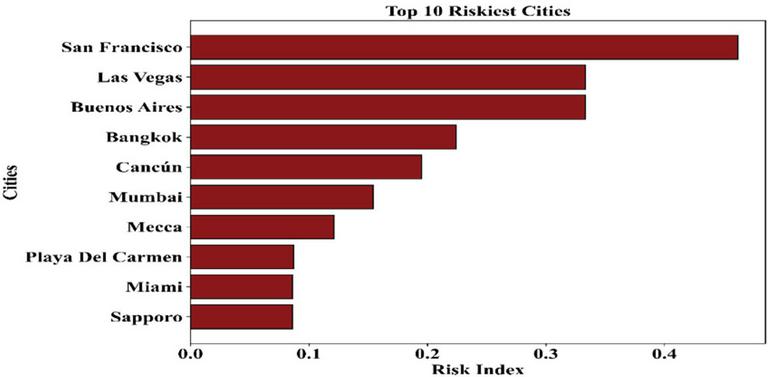
Figure 6 Average risk index of top 10 vulnerable cities.
The histogram of risk index values illustrates the concentration of dangerous conditions for data. Looking at Figure 7, there is a histogram, which is skewed to the right. The data shows that it is concentrated around the y-axis, which shows that the points are closer to a risk index of almost zero. This plays a major role, as there is a vertical line that shows the risk index of 0.070, which shows that once this value has been attained, there is a statistically significant weather event that can be dispatched. This chart shows that use of risk index percentiles is valid, indicating that the reinforcement learning algorithm is also taking a risk index linked to a stressful climate factor.
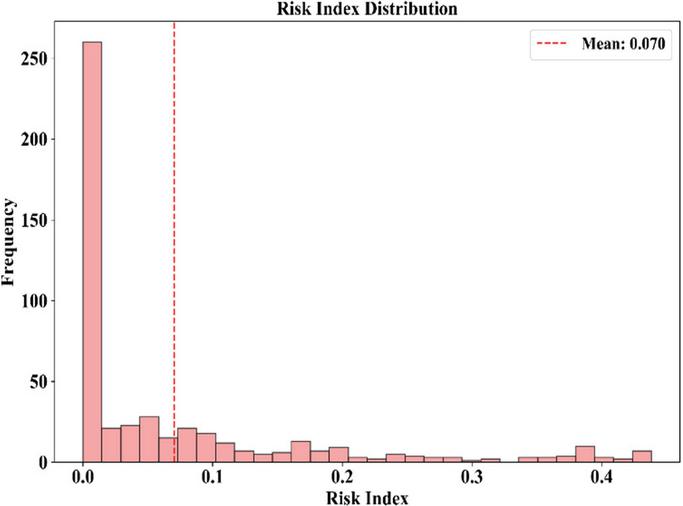
Figure 7 Distribution of risk index values with mean threshold.
The correlation analysis helps in identifying the input variables that affect the model accuracy the most during training. Figure 8 illustrates the eight variables that affect the model accuracy the most, and the two variables that play the major part are Temp_Wind_Interaction and Risk_Index. These variables analyze the complicated patterns of environmental variables to aid the agent in making a decision.
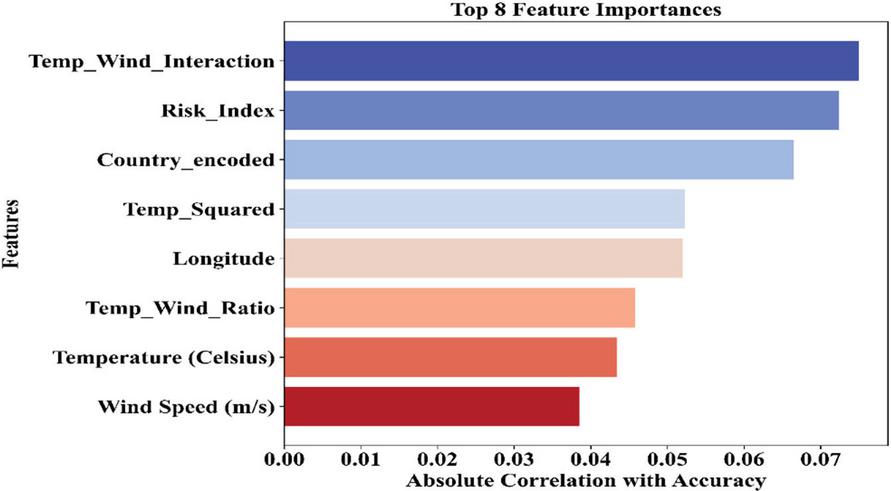
Figure 8 Top 8 features ranked by correlation with accuracy.
The importance of derived variables such as Temp_Squared and Temp_Wind_Ratio again underlines the crucial role played by engineered features in improving predictive accuracy as well as robustness against climatic stresses. The importance of derived variables such as Temp_Squared and Temp_Wind_Ratio again underlines the crucial role played by engineered features in improving predictive accuracy as well as robustness against climatic stresses.
4.2 Reward Function and Learning Dynamics
The decomposition of the elements of the reward function showcases the many ways different elements contribute to the agent’s learning signal. While Figure 9, shows that the strongest positive contribution comes from the Base Correct element, Difficulty Bonus, Confidence Bonus, and Risk Bonus bring in much smaller contributions. On the penalty side, the strongest negative impact comes from the Base Penalty element, while the Risk Penalty element contributes less significantly. This is attributed to the balanced formulation of the reward scheme, which elevates correct and confident acts while penalizing risky and incorrect acts with the aim of fostering a resilient strategy for dispatch that considers risks.
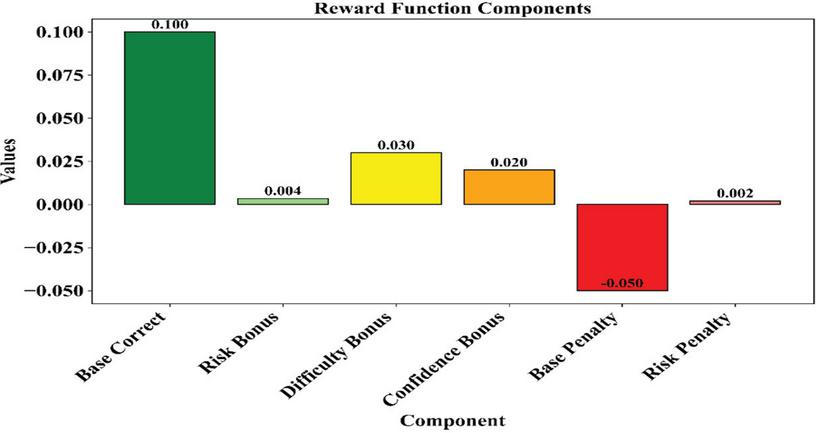
Figure 9 Contribution of components to the reward function.
The relation of total reward to model accuracy provides a direct measure of learning effectiveness. A high degree of positive correlation is shown in Figure 10 with higher rewards across episodes yielding uniformly high accuracy scores. Notice the color gradient across episodes-from early purple to later yellow-that this trend strengthens over time, confirmation that the agent’s policy improves as it accumulates experience. The strongly aligned reward and accuracy validate the reward function design and prove that the agent learns to make decisions in a cost-effective and operationally precise way.
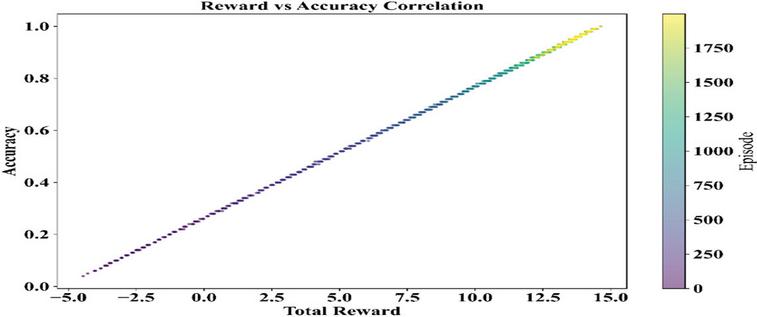
Figure 10 Correlation between total reward and accuracy across episodes.
The analysis of the distribution of the rewards per episode provides a vivid section of the reliability of the implementation of the agent. Figure 11 below is a histogram that presents a left-skewed distribution of the episodes characterized by the rewards of 10–15. The mean reward of the graph is depicted by the red dashed line in the graph, which stands at 9.84. The graph depicts that even though the reward levels of the episodes are high, others come from low-reward episodes, which serves as a positive section of a potential influence on the reward and exploration episodes on the weather and potential training of the agents.
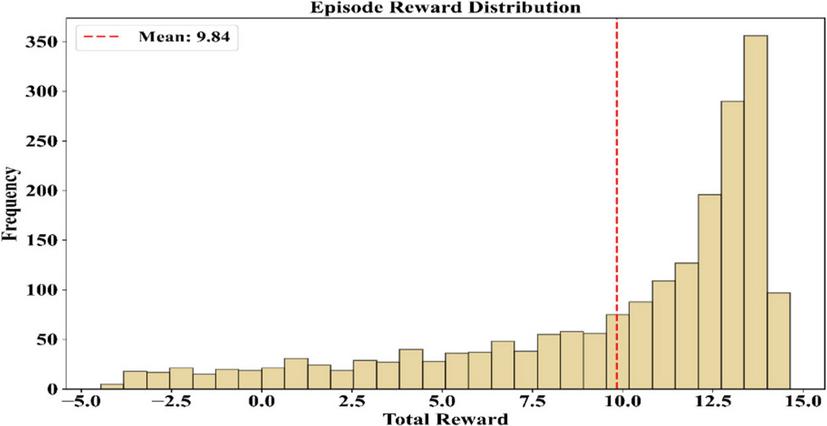
Figure 11 Distribution of episode rewards with mean indicator.
The plot of episode accuracy values depicts how the agent fares in making right decisions throughout their training episodes. The histogram portrayed in Figure 12, represents a right-skewed histogram where the majority of episodes have high accuracy levels with an average accuracy of 75.95% drawn with a red line.
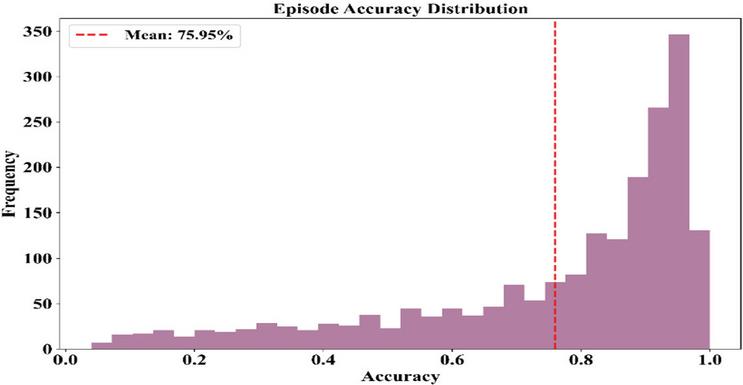
Figure 12 Distribution of episode accuracy with mean indicator.
That means that the learning process of the agent is reliable and focused on enhancing the dispatching decisions, possibly with a fluctuation in values that can be attributed both to exploration and weather pattern processes. The pattern of the graph is a positive aspect; it indicates that the training process gives a strong policy and one that generalizes well.
4.3 Training Progress and Agent Performance
The training procedure and outcome of the performance of the agent indicate the efficacy and robustness of the reinforcement learning model. Although the number of episodes rises, the performance metrics of the agent regarding rewards and accuracy show an increase and the initial fluctuations also stabilize at very effective intervals. The loss values decrease with episodes to ensure optimal convergence, although the level of exploration slows down as the agent matures to exploit its learning at an optimal level. The learning curves indicate effective generalization of the agents for different cases, including normal as well as high-risk situations.
The Figures 13 and 14 below are merged to focus on the convergence and performance of the agent. The graph of the loss function in Figure 13 illustrates a massive drop in the loss function before eventually settling down, with the 100 episode moving average confirming the observation that the learning process had taken place and the mistakes were less occurring with the passage of time due to the adaptation of the reward mechanisms. At the same time, Figure 14 illustrates the escalation of the accuracy rates with time, with fluctuations before settling down into highly effective systems.
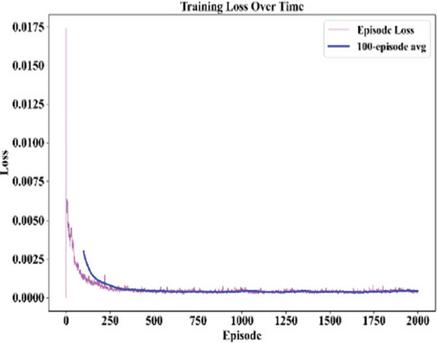
Figure 13 Training loss curve over 2000 training episodes, showing convergence behavior with a 100-episode moving average.
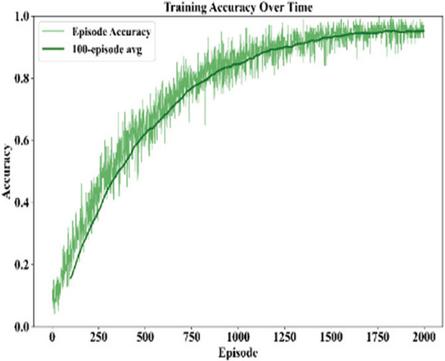
Figure 14 Training accuracy progression over 2000 training episodes, illustrating learning stability with a 100-episode moving average.
The evolution of episode-level rewards offers a direct view into the agent’s learning efficiency and policy refinement. Figure 15 shows that the total rewards have increased with time, whereby early volatility is gradually replaced by stability of gains. The 100-episode moving average smooths short-term fluctuations and confirms that the agent improves the decision-making strategy. The trend thus reflects successful convergence of the reinforcement learning process, where the agent learns to maximize long-term returns through balancing the operational performance against environmental risk.
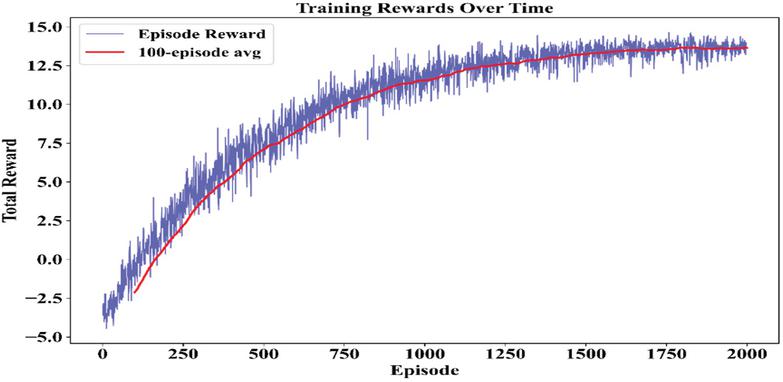
Figure 15 Episode-level reward evolution across 2000 training episodes, with a 100-episode moving average highlighting policy improvement.
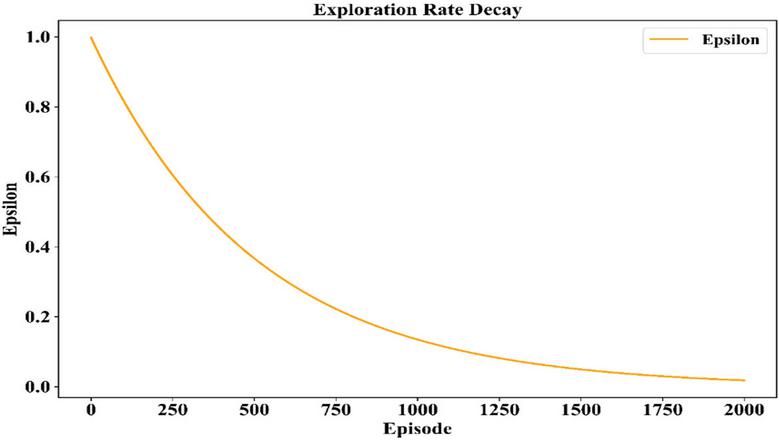
Figure 16 Epsilon decay schedule across 2000 training episodes, demonstrating the transition from exploration to exploitation during training.
The decay of the explored rate with respect to the training episodes indicates the transition of the agent from an exploratory phase to the confident execution of policy. In Figure 16, it is visible that there is a smooth decrease in the value of epsilon from 1.0 to 0 with respect to episodes of training. The gradual decline of epsilon, therefore, indicates that the agent must first explore as many possible actions as possible and then, after an increase in its perception about the environment, increasingly exploit these policies.
The cumulative learning curve leads to an exhaustive performance analysis of the agent. A green line with a shaded confidence band shows how cumulative accuracy grows up to a great extent over 2000 episodes with very little variability in Figure 17. A cumulative accuracy plot can confirm not only the agent’s ability to learn pretty much from every episode but also its ability to generalize policies under different conditions. The smoothness of the graph indicates that the reinforcement learning environment has indeed produced decision-making policies that are both strong and capable of being scaled up.
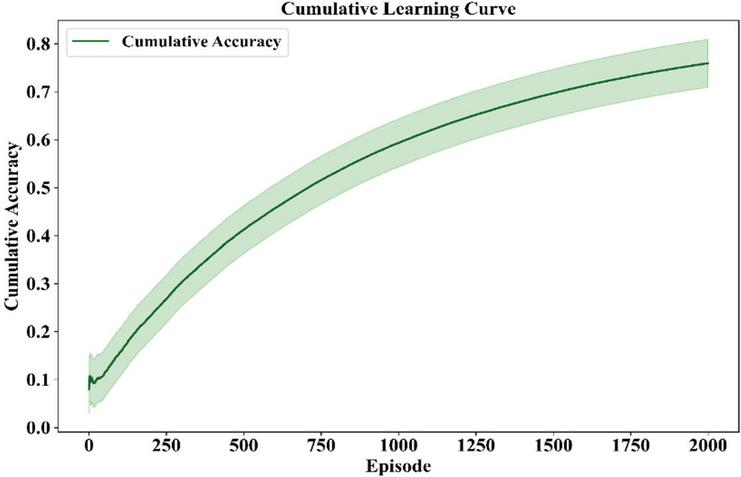
Figure 17 Cumulative accuracy curve demonstrating long-term learning progress.
In fact, the heatmap picks out the reward dynamics of the agent throughout the training blocks. This can be seen in Figure 18. The heatmap indicates the reward values of the agent over a period of 50 episodes. The lighter areas indicate improved performance of the agent. The darker areas indicate poor reward points of the agent.
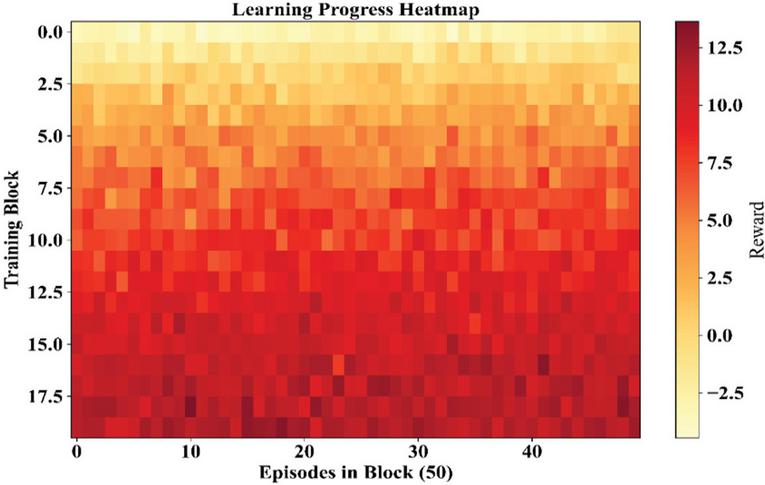
Figure 18 Heatmap of reward progress across training blocks.
The upper rows represent the stronger reward cues, symbolizing the learning gains, while the blocks of the later stages represent fluctuations, which can be attributed to the process of exploration or the dynamics of the environment. The TD curve, therefore, provides insights into statistical localities beyond the standard curves.
Table 1 Ablation study on risk components in RARLDA
| Avg. | Avg. | Resilience | Reward | |
| Episode | Dispatch | Index | Std. | |
| Model Variant | Reward | Cost (₹/kWh) | (%) | Dev. |
| RARLDA (Full Model) | 9.84 | 3.12 | 92.6 | 0.48 |
| RARLDA w/o CVaR | 8.21 | 3.05 | 71.4 | 1.32 |
| RARLDA w/o Threshold Index | 8.47 | 3.68 | 79.2 | 0.71 |
| Risk-Neutral RL Agent | 6.93 | 3.41 | 58.6 | 1.89 |
Table 1 quantitatively isolates the effects of CVaR penalties and threshold-based risk indices on learning performance. The full RARLDA model achieves the highest average episode reward (9.84) and resilience index (92.6%), while maintaining low reward variance, indicating stable and risk-aware learning. Removing the CVaR component results in a notable decline in resilience (71.4%) and increased reward variability, demonstrating vulnerability to extreme events. Conversely, excluding the threshold-based risk index leads to higher dispatch costs (₹3.68/kWh), highlighting reduced economic efficiency. These results confirm that CVaR penalties and threshold-based risk indices play complementary roles in balancing cost efficiency, learning stability, and resilience.
5 Discussions
Results from this research clearly show that incorporation of risk indices and CVaR into reinforcement learning leads to improved resilience of microgrid dispatch strategies in severe weather. The agent demonstrated greater reward and accuracy than baselines in order to affirm the role of risk-sensitive learning in scenarios that feature volatility and uncertainty. The analyses of episode curves (Figures 7–12) noted that there is stability in most cases, and C Var ensured that occurrences though rare had appropriate penalties that prevented the agent from relying on vulnerable strategies. This is crucial since traditional reinforcement learning models tend to focus on efficiency without considering tail risks. The architecture presented in this research therefore fills this missing element.
In contrast to previous work [16] & [19] where weather patterns and soft constraint embeddings had been used, the new architecture is much more robust and adept in general climate patterns as far as real-world weather is concerned. In fact, the feature significance analysis (Figure 8) emphasizes the engineered feature significance of Temp_Wind_Interaction and so on, and how domain knowledge can increase robustness during predictive tasks. In fact, the training process for the agent (Figures 13–17) shows that it targets convergence and removes exploration decay through Figure 16, inscribing in tune with distributional reinforcement learning methods from [25] and the optimization methods using CVaR from [27].
The heatmap graph shown in Figure 18 even further brings in complexity by highlighting block variations of rewards, which indicate that even though overall convergence, there might be localized depressions due to compound hazards and exploration policies. This also emphasizes regional monitoring and need-based retraining for resistance to adverse environments. Most critically, the design melds the need for rigor and applicability by integrating climate-indicators as part of the state space of the RL system, which ensures that despite normal variations, the dispatching strategy performs satisfactorily even for disasters that occur with low probability.
In general, this research has made a contribution to the discussion surrounding AI-assisted adaptation in the context of climate change in terms of showing that reinforcement learning can be generalized for efficiency optimization and decision-making associated with resilience. The methods of robust optimization and stochastic programming introduced in papers [20, 21] & [36] covered uncertainty issues but led to efficiency limitations and lack of scalability in some cases. The introduced RARLDA algorithm succeeds in achieving compromise between cost and resilience in energy systems of coastal areas.
Practical Relevance of Risk-Sensitive Objectives
The risk-sensitive objectives embedded in the proposed reinforcement learning framework are directly aligned with practical microgrid operational constraints. Specifically, CVaR-based penalties encourage conservative dispatch decisions during high-risk climatic conditions, thereby preventing excessive battery depletion and reducing exposure to supply–demand imbalance. Threshold-based risk indices further ensure compliance with operational limits such as battery state-of-charge bounds, power balance requirements, and cost constraints. By embedding these considerations into the reward design, the learned dispatch policy remains both economically viable and operationally feasible, thereby enhancing its relevance for real-world microgrid decision-making under extreme weather conditions.
6 Conclusions
The paper proposed RARLDA for microgrid dispatch in coastal cities, incorporating risk indices and CVaR values obtained from weather into the learning process of the agent for obtaining resiliency during adverse climatic conditions. With the incorporation of thresholds for percentile values and penalties for CVaR in the state and reward spaces, respectively, this solution struck an optimal balance between cost efficiency and resiliency during rare and severe events. The qualitative verification test with the Top 100 Cities Weather Dataset revealed its effectiveness, as median imputation and normalization through Z-Scores ensured statistical compatibility. The simulation results showed excellent performance, which included achieving an average reward of 9.84, average accuracy of 75.95%, and average threshold value of the risk index of 0.070, while its training process revealed optimal convergence and exploration-exploitation transition. The RARLDA algorithm thus extends reinforcement learning capabilities from cost efficiency to resiliency and risk aversion in microgrid dispatch, as per the specific vulnerabilities of coastal energy systems
6.1 Limitations and Future Work
Despite that, there are some limitations to this approach. There could be some uncertainties in the dependency on past weather data, which might be inaccurate in comprehending the current trends of the environment. Additionally, it is seen that the validation phase, when undertaken along the coastal regions, could differ in comparison to the inland areas, as it needs to be tested. Future studies could undertake a blend of architecture with reinforcement learning that could predict the environment.
Declarations
Data Availability
The data used in this study are derived from the Top 100 Cities Weather Dataset. Processed data supporting the findings are available from the corresponding author upon reasonable request.
Conflicts of Interest
The authors declare that there are no conflicts of interest regarding the publication of this paper.
Funding Statement
No external funding was received for this research.
Author Contributions
Jinming Chen conceived the study and developed the methodological framework. Bingqian Liu conducted data processing and simulation experiments. Guoqing Lin contributed to model design and result analysis. Jun Guo reviewed the manuscript and provided technical guidance. All authors approved the final manuscript.
Ethical Approval
This study does not involve human participants or animals and therefore does not require ethical approval.
Consent to Participate
Not applicable.
Consent to Publication
All authors consent to the publication of this manuscript.
Competing Interests
The authors declare no competing interests.
References
[1] Zhou Y, Zhou L, Yi Z, Shi D, Guo M. Leveraging AI for enhanced power systems control: an introductory study of model-free deep reinforcement learning approaches. IEEE Access, 2024, 12: 98189–98206.
[2] Zhang X, Wang Q, Yu J, Sun Q, Hu H, Liu X. A multi-agent deep-reinforcement-learning-based strategy for safe distributed energy resource scheduling in energy hubs. Electronics, 2023, 12(23): 4763.
[3] Zaman MA, Razzak MA. Sustainable microgrid analysis for Kutubdia Island of Bangladesh. IEEE Access, 2022, 10: 37533–37556.
[4] Yoon S, Jang D, Yoon H, Park T, Lee K. GRU-based deep learning framework for real-time, accurate, and scalable UAV trajectory prediction. Drones, 2025, 9(2): 142.
[5] Yang X, et al. Robust optimization dispatch for PV-rich power systems considering demand response and energy storage systems. Frontiers in Energy Research, 2024, 12: 1415874.
[6] Xu W, Guo Y, Meng T, Wang Y, Yu J. Coordinated dispatch based on distributed robust optimization for interconnected urban integrated energy and transmission systems. Journal of Modern Power Systems and Clean Energy, 2024, 12(3): 840–851.
[7] Xu F, et al. Hydrogels for tissue engineering: addressing key design needs toward clinical translation. Frontiers in Bioengineering and Biotechnology, 2022, 10: 849831.
[8] Wu M, Ma D, Xiong K, Yuan L. Deep reinforcement learning for load frequency control in isolated microgrids: a knowledge aggregation approach with emphasis on power symmetry and balance. Symmetry, 2024, 16(3): 322.
[9] Vamvakas D, et al. Review and evaluation of reinforcement learning frameworks on smart grid applications. Energies, 2023, 16(14): 5326.
[10] Emdadi, K., Gandomkar, M., & Nikoukar, J. (2025). Energy scheduling of renewable integrated system with hydrogen storage in distribution grid including charging and hydrogen stations of eclectic vehicles. Scientific Reports, 15(1), 16347.
[11] Théate T, Ernst D. Risk-sensitive policy with distributional reinforcement learning. Algorithms, 2023, 16(7): 325.
[12] Sugumar BK, Anglani N. A novel decision-support framework for renewable energy technology siting in microgrids focusing on resilience and SDGs. Energies, 2025, 18(3): 544.
[13] Bakeer A, Elmorshedy MF, Salama HS, Elkadeem MR, Almakhles DJ, Kotb KM. Optimal design and performance analysis of coastal microgrids using different optimization algorithms. Electrical Engineering, 2023, 105(6): 4499–4523.
[14] Stavrev S, Ginchev D. Reinforcement learning techniques in optimizing energy systems. Electronics, 2024, 13(8): 1459.
[15] Sakki GK, Tsoukalas I, Kossieris P, Makropoulos C, Efstratiadis A. Stochastic simulation–optimization framework for renewable energy systems under uncertainty. Renewable and Sustainable Energy Reviews, 2022, 168: 112886.
[16] Qin JC, Jiang R, Mo H, Dong D. Data-driven mixed-integer programming for joint chance-constrained optimal power flow under uncertainty. International Journal of Machine Learning and Cybernetics, 2025, 16(2): 1111–1127.
[17] Panzer M, Bender B, Gronau N. Deep reinforcement learning-based hyper-heuristic for modular production control. International Journal of Production Research, 2024, 62(8): 2747–2768.
[18] Nozari H, Szmelter-Jarosz A, Weiland D. Fuzzy multi-objective sustainable and agile supply chain model using digital twin and IoT. Applied Sciences, 2025, 15(19): 10399.
[19] Nguyen DN, Usuda Y, Imamura F. Disaster risk reduction in urban areas through smart community infrastructure standardization. Sustainability, 2024, 16(21): 9586.
[20] Nasab NM, Kilby J, Bakhtiaryfard L. Hybrid wind and tidal turbine microgrid for remote off-grid communities. Energies, 2021, 14(12): 3636.
[21] Meregillano EO, Delina LL. Impacts of extreme weather events on coastal electricity systems. The Electricity Journal, 2023, 36(9–10): 107339.
[22] Martin N. Risk assessment of future climate and land-use change impacts on water resources. Hydrology, 2021, 8(1): 38.
[23] Lee S, Seon J, Hwang B, Kim S, Sun Y, Kim J. Recent trends in machine-learning-based energy management systems. Energies, 2024, 17(3): 624.
[24] Manas, M. (2018). Optimization of distributed generation based hybrid renewable energy system for a DC micro-grid using particle swarm optimization. Distributed Generation & Alternative Energy Journal, 33(4), 7–25.
[25] Kim I, Jeon Y, Chae J, You D. Deep reinforcement learning for fluid mechanics: control and optimization. Fluids, 2024, 9(9): 216.
[26] Ishraque MF, et al. Grid-connected microgrid optimization for a coastal island. Sustainability, 2022, 14(24): 16697.
[27] Ghasemi R, et al. multi-objective decision-making for an island microgrid. Sustainability, 2023, 15(18): 13900.
[28] Ghahramani M, Habibi D, Ghamari S, Soleimani H, Aziz A. Renewable-based isolated power systems: scalability and uncertainty modeling. Clean Technologies, 2025, 7(3): 80.
[29] Ghahramani M, Habibi D, Aziz A. Risk-averse data-driven distributionally robust optimization for power systems. Energies, 2025, 18(19): 5245.
[30] Gautam M. Deep reinforcement learning for resilient power and energy systems. Electricity, 2023, 4(4): 336–380.
[31] Garlík B. Energy sustainability of building clusters using smart grids. Energies, 2022, 15(5): 1649.
[32] Escobar-González D, et al. Soil moisture forecasting using transfer learning. Water, 2024, 16(6): 832.
[33] Di Persio L, Alruqimi M, Garbelli M. Stochastic approaches to energy markets. Energies, 2024, 17(23): 6106.
[34] Dawn S, et al. Renewable energy integration in deregulated microgrids. Advanced Energy and Sustainability Research, 2024, 5(10): 2400088.
[35] Das A, Ni Z, Zhong X. Microgrid energy scheduling under extreme weather using reinforcement learning. International Journal of Electrical Power & Energy Systems, 2023, 152: 109210.
[36] Daeli A, Mohagheghi S. Power grid infrastructural resilience against extreme events. Energies, 2022, 16(1): 64.
[37] Chaudhary MT, Piracha A. Natural disasters: origins, impacts, and management. Encyclopedia, 2021, 1(4): 1101–1131.
[38] Canziani F, et al. Reliability and cost analysis of rural hybrid microgrids. Energies, 2021, 14(19): 6396.
[39] Bedoui R, Noiali S, Hamdi H. Hedge fund portfolio optimization using vine copula-GARCH-EVT-CVaR. International Journal of Entrepreneurship and Small Business, 2020, 39(1–2): 121–140.
[40] Azizi R, Koskinopoulou M, Petillot Y. Machine learning approaches for PPE detection in construction sites. Robotics, 2024, 13(2): 31.
Biographies

Jinming Chen received his Master’s degree from Xinjiang Normal University in 2021 and his Bachelor’s degree from Huaqiao University in 2018. He is currently a Digital Project Evaluation Technology Specialist at the Electric Power Research Institute of State Grid Fujian Electric Power Co., Ltd., Fuzhou, China. His research interests include LoRa-based communication systems, low-power wide-area networks, digital evaluation technologies, and AI-driven security solutions for power information systems.

Bingqian Liu received her Master’s degree from Harbin Institute of Technology in 2016 and her Bachelor’s degree from Guizhou University in 2014. She is currently the Supervisor of the Digital Technology Application Room at the Electric Power Research Institute of State Grid Fujian Electric Power Co., Ltd., Fuzhou, China. She has over 10 years of professional experience, and her research interests include digital technology applications and image processing techniques.

Guoqing Lin received his Bachelor’s and Master’s degrees from Zhejiang University in 1999 and 2006, respectively. He is currently a Digital Project Evaluation Technology Specialist at the Electric Power Research Institute of State Grid Fujian Electric Power Co., Ltd., Fuzhou, China, where he has been working since 2006. His professional interests focus on digital project evaluation technologies and power system research and applications.

Jun Guo received his Master’s degree from Sun Yat-sen University in 2019 and his Bachelor’s degree from Hebei University of Technology in 2016. He is currently a System and Technology Application Specialist at the Electric Power Research Institute of State Grid Fujian Electric Power Co., Ltd., Fuzhou, China. His research interests include power system technology applications, digital systems, and related engineering innovations.
Distributed Generation & Alternative Energy Journal, Vol. 41_2, 433–470
doi: 10.13052/dgaej2156-3306.4127
© 2026 River Publishers