Robust Scheduling Algorithm for Virtual Power Plants in Distributed Multi-Energy Systems Based on Generative Adversarial Reinforcement Learning
Yan Shi1, 2,* and Wenwen Wang2
1Northeast Electric Power University, School of Electrical Engineering, Jilin City, Jilin Province, 132012, China
2State Grid Inner Mongolia Eastern Power Company Supply Service Supervision and Support Center, Tongliao, Inner Mongolia, 028000, China
E-mail: 340589430@qq.com; wangwenwen@md.sgcc.com.cn
*Corresponding Author
Received 16 January 2026; Accepted 25 April 2026
Abstract
In the scheduling of distributed multi-energy virtual power plants, this paper proposed a robust scheduling method based on Wasserstein Generative Adversarial Network with Reinforcement Learning (WGAN-RL) to address the vulnerability of scheduling strategies caused by renewable energy output fluctuations and load uncertainties. This method defined the state and action space based on physical constraints and embedded hard operating rules. Then, it designed a conditional Wasserstein GAN to generate the worst-case perturbation scenario that approximates the real distribution support boundary and covers high-risk areas, based on weather and load forecasts. On this basis, it used Proximal Policy Optimization (PPO) to train the scheduling policy in an environment with dynamically injected extreme perturbations, and improved the convergence stability by pruning probability ratios and GAE. Finally, it introduced a rolling time-domain online scheduling and a weekly fine-tuning mechanism of WGAN to achieve long-term adaptability under perturbation distribution drift. Experiments show that, in terms of economics, with a 70% renewable energy penetration rate, the average daily dispatch cost is 2680 USD 150 USD, and the curtailment rate is 9.6% 1.1%. Regarding robustness, under a perturbation of 0.7 output standard deviation, the dispatch feasibility rate remains at 90.1% 2.1%, and the number of strategy collapses is controlled at 9.9 2.1. In terms of real-time performance, the single-step inference time is only 4.2 ms 0.3 ms, and the training convergence steps are only 823. This research provides a deployable, adaptive, and engineering-feasible technical path for robust dispatch of virtual power plants under high uncertainty environments.
Keywords: Distributed multi-energy systems, virtual power plants, scheduling strategies, Wasserstein generative adversarial networks, reinforcement learning, proximal policy optimization.
1 Introduction
Virtual power plants, formed by the aggregation of distributed multi-energy systems, are becoming a key carrier supporting the consumption of high proportions of renewable energy [1, 2]. Their decisions on dispatch have an immediate impact on the security of the grid, the economy of its operation, and the effectiveness of the reduction of carbon emissions [3]. Renewable energy generation is influenced by weather condition, load response is motivated by human behavior, and both are time-varying and stochastic processes [4–6]. Within this framework, dispatch policies should be intrinsically robust to handle the extreme disturbances which are so common in real operation [7, 8]. Developing a smart dispatch approach that can sense, mitigate and adapt to uncertainty in an active manner can be of vital practical importance for enhancing the operation resilience of virtual power plants.
The crux of the problem faced at the virtual power plant dispatch today is the separation of uncertainty modeling from strategy robustness. Most works used the statistical properties of historical data to build random or fuzzy sets, however, those approaches often assume that the disturbances follow a certain distribution, which does not consider the distribution shift induced by extreme weather or unexpected load events [9, 10]. Despite the availability of scenario reduction or opportunity constraints, the constructed disturbance set is still bounded to the convex hull of the sampled observations and thus can not contain high-risk points in the tails of the distributions [11]. More importantly, many of the existing robust optimizations utilize worst case assumptions, which typically lead to conservative schedules at the cost of economic efficiency [12–14]. While data-driven reinforcement learning can be adaptive, it is not exposed to out of distribution disturbances during training and has limited potential for policy generalization [15, 16]. Compound disturbance such as abrupt weather change, communication delay or equipment response deviation is accumulated in real implementation, which further enhances the risk of stratety failure [17, 18]. The existing methods have not established a closed-loop coupling mechanism between disturbance generation and strategy training, making it impossible to actively explore their fragile boundaries during the strategy optimization process [19, 20]. In addition, most frameworks separate uncertainty modeling from scheduling decisions, generate static scenarios, passively respond, and lack dynamic interaction and co-evolution capabilities [21, 22]. This separated architecture is difficult to cope with real-world scenarios where disturbance distributions continue to drift with seasons, regions, or policies, resulting in rapid performance degradation of the model after deployment.
In response to the uncertainty problem in virtual power plant scheduling, previous research has mainly focused on rolling optimization based on deterministic equivalence or point prediction, which is computationally efficient but ignores fluctuation risks [23, 24]. In terms of stochastic programming, there are studies that use Monte Carlo sampling to construct multi-scene trees and optimize scheduling in the expected sense [25], but the explosion of scene numbers and insufficient representativeness constrain its engineering applications. In terms of robust optimization, Yi Z proposed a model free, adversarial safe reinforcement learning method to solve the model uncertainty problem in virtual power plant economic dispatch. Through a two-stage training framework, the system’s robustness to environmental and output deviations was enhanced, and its superior performance and scalability were verified through simulation [26]; Awadalla M proposed a data-driven inverse optimization framework that characterizes the flexibility of power systems through polyhedral uncertainty sets in the demand space, effectively capturing the spatial correlation between renewable energy and load, and inferring whether the system flexibility is sufficient using linear optimization methods [27]; However, the conservatism of these methods deteriorates sharply as the system dimension increases. To balance conservatism and economy, some studies have introduced probability measures such as Wasserstein distance for distribution robust optimization [28, 29], but it relies on the assumption of independent and identically distributed samples, and lacks modeling of time series correlation and tail dependence. In recent years, data-driven methods have emerged, and some works have used deep Q-networks or proximity strategy optimization for scheduling decisions, learning strategies through interaction with the environment [30, 31]. However, their training environments are mostly based on historical replay or simple noise injection, and high-risk perturbation structures have not been explicitly modeled. There have also been studies attempting to use generative adversarial networks for scene generation [32], but they often use unconditional GAN or standard GAN losses, resulting in sample crashes and a lack of accurate alignment with prediction conditions, making it difficult to support reliable scheduling. Overall, existing methods either rely too much on distribution priors or lack active detection mechanisms for policy vulnerability, and have not yet formed a robust scheduling paradigm of “generation adversarial learning” trinity.
The integration of generative adversarial networks and reinforcement learning provides new ideas for complex decision-making problems. In the field of power systems, there have been explorations of using GANs to generate loads or photovoltaic (PV) scenarios to expand training data [33, 34], but their goal is only to fit historical distributions, without focusing on improving strategy robustness. Other studies have utilized adversarial training ideas to incorporate perturbation disturbances into policy gradient updates to enhance generalization ability, which has been applied to power scheduling and virtual reality tasks [35, 36]. However, perturbation constructions are mostly white noise or gradient based local attacks, lacking physical consistency and global coverage. Wasserstein GAN alleviated mode collapse through Earth Moore distance and is suitable for high-dimensional continuous scene generation, applied in wind power generation and fault detection [37, 38], but its application in scheduling is still limited to offline data augmentation. The above methods each solve local problems, but do not form a closed loop between conditional Wasserstein generation, physical constraint embedding, and PPO training: the generator needs to construct the worst but reasonable perturbations based on prediction, the strategy needs to learn under such perturbations, and the perturbation generation itself needs to be dynamically adjusted according to the current weaknesses of the strategy. This article proposes the WGAN-RL framework based on this, which uses conditional Wasserstein GAN to explicitly model the disturbance support set boundary, combines PPO to train strategies in adversarial environments, and uses online fine-tuning mechanisms to address distribution drift, thereby systematically solving the shortcomings of existing methods such as insufficient disturbance coverage, weak strategies, and lack of adaptability.
The core objective of this article is to establish a robust scheduling paradigm for distributed multi-energy virtual power plants, which is innovative in terms of method architecture and operational mechanisms. Firstly, a conditional Wasserstein GAN disturbance generator is proposed, which learns the support boundaries of the true disturbance distribution based on meteorological and short-term load forecasting conditions. It actively synthesizes the worst but physically feasible disturbance scenarios covering high-risk tail areas, solving the limitations of traditional methods limited to historical convex hull. Secondly, a state action space based on physical constraints is constructed, and the power grid operation rules are embedded in the reinforcement learning framework in the form of hard constraints to ensure that the feasibility of the strategy does not rely on post correction. Thirdly, this article designs a WGAN-RL joint training mechanism to form an adversarial closed loop between the generator and PPO policy network: the generator optimizes perturbations guided by the weaknesses of the current policy, while the policy improves robustness in dynamically enhanced extreme environments, ensuring training stability through pruning probability ratios and generalized advantage estimation. Finally, rolling time-domain online scheduling and WGAN weekly fine-tuning mechanism are introduced to continuously adapt to disturbance distribution drift during deployment, achieving long-term strategy preservation. This method does not rely on prior assumptions of distribution, does not sacrifice economy for conservative robustness, and is not simply data augmentation. Instead, it systematically improves the scheduling resilience of virtual power plants in high uncertainty environments through collaborative evolution of generation adversarial learning.
2 Construction of a Virtual Power Plant Scheduling Architecture Based on Disturbance Perception
Figure 1 systematically illustrates the overall architecture of robust scheduling for virtual power plants based on conditional Wasserstein Generative Adversarial Network (WGAN) and PPO. The architecture consists of four logical levels: the input layer provides meteorological load forecasting and historical data; The conditional WGAN in the core adversarial engine generates the worst-case perturbation scenarios that cover the distribution boundaries based on predicted conditions, and stores them in the scene library. In the reinforcement learning training loop, PPO agents are trained in an adversarial simulator embedded with hard physical constraints, which continuously injects dynamically generated perturbations to expose policy weaknesses. The output and application layer can achieve online rolling scheduling and collect actual disturbance data through adaptive mechanisms, periodically fine-tuning WGAN to cope with distribution drift. The entire architecture forms a closed-loop of generation adversarial learning, enabling scheduling strategies to continuously evolve under extreme but reasonable disturbances, ultimately achieving endogenous robustness and long-term resilience of virtual power plants in uncertain environments.
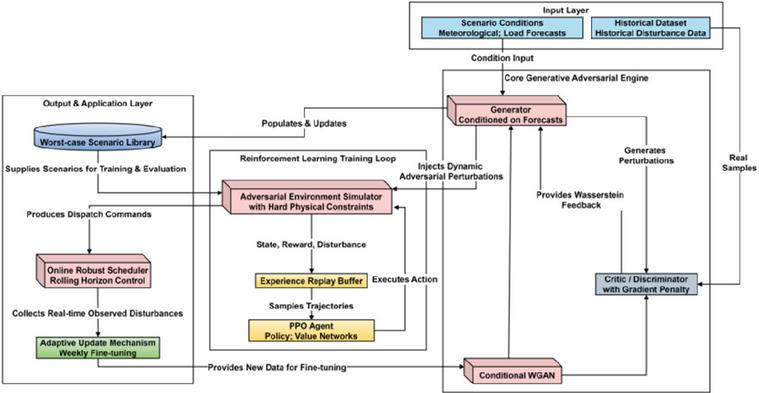
Figure 1 Robust scheduling of virtual power plants, generative adversarial reinforcement learning closed-loop architecture.
2.1 Building a State Action Space and Scheduling Constraint Model for Multi-Energy Systems
2.1.1 Physical modeling of system state and action space
Based on the actual topology structure of a typical distributed multi-energy virtual power plant, the complete system state vector is first constructed. This vector covers core physical quantities: real-time output of photovoltaic power generation units, real-time output of wind power generation units, State of Charge (SOC) of electrochemical energy storage units, current switching state of interruptible loads, and bidirectional interaction power with the main grid. These types of variables collectively characterize the operating state of the system at the scheduling time, fully reflecting the internal energy supply, storage capacity, flexible load response capability, and external power grid interaction capability [39, 40]. All state variables are obtained through real-time measurement or high-precision short-term prediction, and normalized to a unified dimension to meet the input requirements of subsequent reinforcement learning algorithms.
The action space consists of three types of controllable decision variables: the adjustment increment of gas turbine output, the charging and discharging power command of the energy storage system, and the call amount of demand response resources. These actions directly correspond to the control interface of schedulable resources within the virtual power plant, with clear physical execution paths. To ensure the feasibility of scheduling instructions, the output range of actions is strictly limited to the technical specifications of each device. The definition process of state and action space fully considers the coupling characteristics of multiple energy sources, ensuring that scheduling decisions simultaneously satisfy the coordinated consistency of energy flow, information flow, and control flow.
2.1.2 Embedding of scheduling hard constraints and implementation of environment simulators
Transform critical engineering constraints in operation into hard constraints and directly embed them into the underlying logic of the environment simulator to eliminate the possibility of policy generation of infeasible actions [41]. The primary constraint is system power balance. During any scheduling period, the sum of all power output, energy storage power, load demand, and grid interaction power must meet:
| (1) |
is the photovoltaic output, is the wind power output, is the gas turbine output, is the energy storage charging and discharging power (positive value is discharging, negative value is charging), is the interaction power with the main grid (positive value is purchasing electricity, negative value is selling electricity), is the uninterruptible basic load, and is the reduction amount of interruptible load. Secondly, the output variation of gas turbines is limited by the ramp rate. If the current output is and the previous output is , then it satisfies:
| (2) |
is the maximum climbing rate of the gas turbine (unit: kW/min), and is the scheduling time step. The state of charge of energy storage units is constrained by capacity boundaries. Assuming is the current state of charge, its update is determined by the charging and discharging power and is limited by the following equation:
| (3) |
and are the allowed minimum and maximum states of charge, which are 0.2 and 0.9, respectively. is the energy storage round-trip efficiency, and is the rated energy storage capacity.
In addition, the transmission power of the contact line is also limited by the physical channel capacity, and its absolute value must not exceed the preset upper limit. The above four types of constraints are implemented in the state transition function of the environment simulator in the form of conditional judgments: once the action output by the policy violates any constraint, the simulator can refuse to execute and return a violation signal, forcing the learning algorithm to search for the policy only within the feasible domain. This mechanism ensures that all scheduling instructions generated during the training and inference stages have natural engineering feasibility without the need for post-processing modifications.
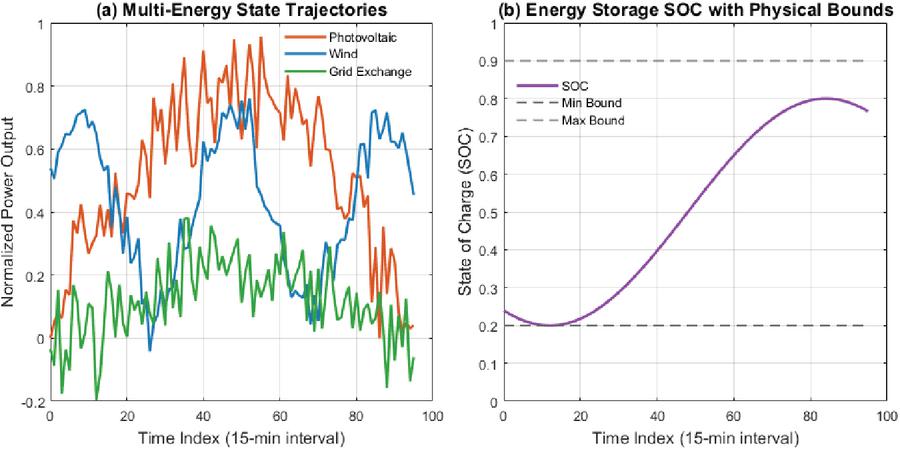
Figure 2 Dynamic characteristics of multiple energy states and energy storage constraints.
The horizontal axis of Figure 2(a) represents the scheduling time index (15 minute intervals, 96 points in total), and the vertical axis represents the normalized power output values. Here, the dynamic trajectory of the interaction power between photovoltaic, wind power, and the grid is selected to be displayed. The photovoltaic output exhibits a clear daytime unimodal pattern, originating from the daily periodicity of solar radiation intensity, with fluctuations reflecting meteorological disturbances such as cloud cover; Wind power output exhibits high-frequency fluctuations, reflecting the inherent spatiotemporal randomness of wind speed. The interactive power of the power grid alternates between positive and negative intervals, with positive values indicating the purchase of electricity from the main grid and negative values indicating the sale of electricity to the main grid. The waveform actually represents the complementary output of renewable energy, indicating that the system smooths internal fluctuations through flexible grid interaction. The coupling of the three reveals the net power balance mechanism of multi-energy virtual power plants in uncertain environments.
The horizontal axis of Figure 2(b) also represents the time index, the vertical axis represents SOC, the solid line represents the actual SOC trajectory, and the two dashed lines represent the set minimum (0.2) and maximum (0.9) charge boundaries, respectively. The SOC curve shows a typical increase during valley periods (charging) and decrease during peak periods (discharging), which conforms to the logic of economic dispatch. The key is that the entire trajectory is strictly limited within the hard physical boundaries and there is no behavior of exceeding the limits. This feature does not rely on posterior correction, but rather stems from the mechanism of directly embedding constraints into the environment simulator – any action that causes SOC to exceed the boundary is intercepted during the state transition phase, ensuring that the scheduling instructions generated by the strategy are naturally feasible. The data intuitively validates the effectiveness of state action modeling and constraint embedding methods, providing a physically consistent feasible domain foundation for robust strategy training.
2.2 Training Wasserstein GAN to Generate the Worst Disturbance Scene Set
2.2.1 Architecture construction and disturbance generation mechanism of conditional Wasserstein GAN
Based on historical operational data and real-time collected meteorological and load forecasting information, construct a conditional Wasserstein generative adversarial network. The input of the generator consists of two parts: the first is short-term meteorological prediction during the current scheduling period, including irradiance, wind speed and other key variables; The second is the predicted value of basic load. These two types of conditional signals are mapped into high-dimensional vectors through embedding layers, concatenated with latent variables sampled from standard normal distributions, and input into a multi-layer fully connected network. The generator outputs three sets of time series: photovoltaic power output deviation, wind power output deviation, and load disturbance, all with a time granularity of 15 minutes, covering the next 24-hour scheduling window. The generator employs a 4-layer fully connected network (input dimension condition vector dimension 100-dimensional noise, with hidden layer dimensions of 256,512,512, and 256 respectively), outputting a 96 3-dimensional perturbation sequence (comprising 96 data points each for photovoltaic, wind power, and load).
The discriminator adopts a 1-Lipschitz network with gradient penalty, wshich is a multi-layer fully connected network and outputs a scalar to evaluate the distribution distance between the input disturbance sequence and the true disturbance. The discriminator is a 4-layer fully connected network (input dimension 96 3 condition vector dimension, hidden layer dimensions are 256,512,512, and 256), with scalar output. To enhance the physical rationality of generating disturbances, the scheduling feasibility signal is used as an auxiliary criterion for discrimination: if a disturbance sequence causes power balance or device limit violations, a negative bias is applied to the discriminator output to guide the generator to avoid infeasible areas. The optimization objective of Wasserstein distance is defined as:
| (4) |
represents the conditional vector composed of meteorological and load forecasting, is the true disturbance sequence (including photovoltaic, wind power, and load deviation), is the disturbance sequence generated by generator , where and respectively represent the distribution of true and generated disturbances, and is the set of all 1-Lipschitz functions. This objective aims to generate disturbances that approach the boundary of the true disturbance support set under conditional constraints.
2.2.2 Construction and training stability guarantee of worst scenario library
During the training process, the discriminator loss function introduces a gradient penalty term to enforce the Lipschitz constraint. The specific form is:
| (5) |
is the interpolation point sampled uniformly between the real sample and the generated sample, and is the penalty coefficient with a value of 10. This design effectively avoids overfitting of the discriminator and improves the diversity and stability of the generated samples.
The training objective of the generator is not only to minimize the discriminator score, but also to dynamically weight it based on scheduling feasibility feedback. Assuming the feasibility function takes a value of 1 when the perturbation sequence satisfies all operational constraints, and 0 otherwise, the generator loss is corrected to:
| (6) |
is the feasible penalty weight, set to a fixed positive value. This mechanism prioritizes the generator to generate perturbations that are both adversarial and satisfy physical rules. The feasibility penalty weight was determined by backward inference from the constraint ‘feasible disturbance proportion 95%’ on the validation set.
After training, fix the generator parameters and continuously drive it to generate a large number of perturbed samples with the latest prediction conditions. By clustering and extreme value screening the generated samples, retaining the samples located at the tail of the distribution with a feasibility of 1, a worst-case scenario library covering high-risk areas is constructed. This scenario set is directly used for disturbance injection in the subsequent policy training environment, ensuring that the scheduling strategy is fully exposed to extreme but reasonable uncertainty conditions before deployment.
The worst-case scenario library construction process is as follows: (1) Generate 10,000 disturbance samples; (2) Eliminate samples with scheduling feasibility 1; (3) Sort the remaining samples by “absolute total power deviation” and select the top 5% to form the final scenario library (approximately 300 scenarios), ensuring coverage of high-risk tail cases and physical feasibility.
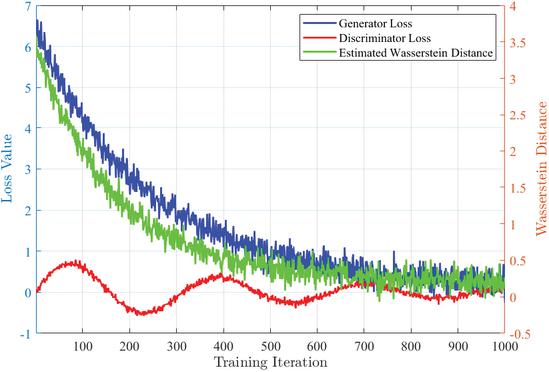
Figure 3 Training dynamic loss and Wasserstein distance.
Figure 3 shows the changes in key performance indicators of WGAN during the training process. The horizontal axis represents the number of training iterations. The left Y-axis represents the loss value, the blue solid line represents the generator loss, and the red solid line represents the discriminator loss. The Y-axis on the right represents the estimated Wasserstein distance (solid green line). In the early stages of training, the generator has a high loss, while the discriminator’s loss fluctuates greatly, and the Wasserstein distance is also at a high value. As training progresses, the generator loss shows an exponential decay trend and gradually stabilizes at a lower level, indicating that the data generated by the generator is increasingly capable of “deceiving” the discriminator. The discriminator loss oscillates around zero and gradually converges, reflecting the training stability brought by the introduction of gradient penalty in WGAN. The most important indicator is Wasserstein distance, which rapidly decreases from its initial large value and approaches zero but remains positive in the later stages. This change process indicates that WGAN has successfully reduced the Wasserstein distance between the generated perturbation distribution and the true perturbation distribution through adversarial training. The final convergence to a smaller positive value means that the generated distribution is already very close to the support set boundary of the true distribution, but not completely overlapping (which helps maintain the diversity of the generation and covers the tail), meeting the design goal of “approaching the support boundary of the true distribution”.
2.3 Design an Anti-interference Strategy Training Mechanism Based on PPO
2.3.1 Markov modeling and reward mechanism design for scheduling problems
This article formalizes the virtual power plant scheduling task as a Markov decision process, defining state transitions as determined by the current system state, scheduling actions, and external environmental disturbances. The state space includes the actual output of photovoltaic and wind power (with added disturbances), energy storage charging status, interruptible load status, and grid interaction power; The action space is composed of gas turbine output adjustment, energy storage charging and discharging power, and demand response adjustment. The environment receives actions output by the intelligent agent at each step and performs state transitions based on hard constraint simulators, while injecting disturbance sequences randomly sampled from the worst-case scenario set of WGAN, so that the observed state reflects extreme but physically feasible operating conditions.
The reward function is designed as a multi-objective weighted sum, which comprehensively reflects the economy, energy utilization efficiency, and strategy smoothness. Its expression is:
| (7) |
is the current operating cost, including gas turbine fuel costs and grid purchase costs; is the penalty item corresponding to the amount of renewable energy abandoned; is the cost of user service interruption caused by load shedding; and are the action vectors of the current and previous moments, respectively; and are positive weight coefficients used to balance the priority of each target. The reward function weights were set as , and . This parameter combination achieved optimal balance between cost-effectiveness and robustness during grid search. This reward structure guides the strategy to balance economic operation, high proportion consumption, and control instruction stability under extreme disturbances.
2.3.2 PPO strategy update mechanism and training stability guarantee
Use PPO algorithm for policy network update: The strategy network is a fully connected neural network, with the input being the current state vector and the output being the probability distribution parameters of actions. The policy network (Actor) is a three-layer fully connected network (input dimension state vector dimension, hidden layers with 512 and 256 neurons respectively, outputting action mean and logarithmic standard deviation); the Critic has the same architecture but outputs a single value. During each policy iteration, the agent interacts with the environment to generate a batch of new trajectories (episodic rollouts), temporarily stored in a temporary trajectory buffer. Advantage estimates are then computed from these trajectories, followed by multiple PPO updates. The buffer retains only data generated by the current policy, adhering to on-policy requirements without reusing historical samples across policies. The probability ratios of each action are calculated at every time step:
| (8) |
is the current strategy, is the old strategy, and and are the state and action vectors, respectively. The PPO objective function prunes the probability ratio to limit the policy update step size and avoid training crashes caused by significant changes:
| (9) |
is the Generalized Advantage Estimation (GAE) value, is the clipping threshold, set to a fixed small positive number. GAE effectively reduces the variance of advantage estimation and improves sample utilization efficiency by using index weighted discount returns and residual value functions.
To maintain the ability to explore strategies, the objective function introduces an additional policy entropy regularization term:
| (10) |
represents the entropy of the policy distribution, and is the regularization coefficient. This design prevents premature convergence of the strategy to local suboptimal solutions, ensuring continuous search for robust scheduling schemes in high-dimensional perturbation spaces. The entire training process is conducted in a dynamic perturbation injection environment, gradually enhancing the strategy’s adaptability to extreme uncertainty in adversarial scenarios.
Table 1 PPO training core parameter settings
| Parameter Name | Value | Description |
| Learning Rate | 3e-4 | Adam optimizer learning rate |
| Batch Size | 64 | Number of samples per update |
| Discount Factor | 0.99 | Reward discounting over time |
| GAE Lambda | 0.95 | Trade-off in advantage estimation |
| PPO Clip Range | 0.2 | Clipping threshold for policy update |
| Entropy Coefficient | 0.01 | Weight for exploration incentive |
| Gradient Clipping Norm | 0.5 | Maximum norm of gradient values |
| Training Epochs per Update | 10 | Number of optimization steps per batch |
| Single-Trace Collection Length | 20000 | Capacity for storing experience tuples |
Table 1 lists the core hyperparameters and their values and explanations used in PPO based anti-interference strategy training, covering key training configurations such as optimizer learning rate, batch size, discount factor, as well as algorithm specific parameters such as GAE parameters, PPO clipping range, entropy coefficient, etc. All parameters are determined on the validation set through grid search to ensure training stability and convergence efficiency. Gradient clipping effectively prevents update explosion, and the replay buffer capacity supports sufficient experience replay. Parameter settings balance exploration and utilization, adapt to complex scheduling tasks in high-dimensional continuous action spaces, and achieve robust strategy learning in extreme disturbance environments.
2.4 Implement Online Scheduling and Disturbance Adaptive Update Mechanism
2.4.1 Rolling time domain online scheduling execution mechanism
During the deployment phase, the scheduling strategy operates using a rolling time-domain optimization approach, with a time step set to 15 minutes. At the beginning of each scheduling cycle, the system obtains the latest weather forecast, load forecast, and real-time operating status of each unit, constructs a complete state vector at the current time, and inputs it into the trained policy network. The strategy network outputs the control command sequence for the next 24 hours, but only executes the first step action, which is the adjustment of gas turbine output, energy storage charging and discharging power, and demand response adjustment. The remaining actions are discarded to avoid the accumulation of model extrapolation errors. The next cycle can re observe the state and repeat the process to achieve closed-loop feedback control.
To ensure the feasibility of scheduling instructions, all actions must pass through an embedded hard constraint verification module before being issued. This module is validated in real-time based on power balance, equipment limits, and energy storage dynamic equations. If the policy output violates any constraint, the projection correction mechanism is enabled to project the action to the feasible domain boundary. The formula for status update is as follows:
| (11) |
is the actual observed disturbance (including photovoltaic, wind power, and load deviation), is the environmental state transition function, with built-in physical constraints and energy conservation logic. This mechanism enables the system to continuously track the latest disturbances during real operation while maintaining the engineering feasibility of scheduling instructions.
It should be noted that the hard constraint embedding mechanism ensures that the policy optimizes only within the feasible region during the training phase, thus the learned policy itself has high feasibility. However, during online deployment, because actual perturbations may exceed the training distribution (such as extreme weather changes), there is still a very small probability that the output boundary actions will violate the constraints. In this case, lightweight projection correction is used as a safety net, which does not affect the post-processing-free characteristic of the main policy.
2.4.2 WGAN cycle fine-tuning strategy under disturbance distribution drift
To cope with the drift of disturbance distribution caused by seasonal changes, equipment aging, or changes in user behavior, the system establishes a continuous learning mechanism. During operation, all actual observed disturbance data (i.e. the difference between the actual output and the predicted value) are recorded and stored in the disturbance database. Extract samples from the database for the past 28 days at a fixed time each week to form a fine-tuning dataset. Subsequently, a limited number of parameter updates were performed on the WGAN generator, while the discriminator remained frozen to avoid mode collapse.
The fine-tuning process adopts the original Wasserstein loss combined with L2 regularization, and the objective function is:
| (12) |
is the empirical distribution of newly collected disturbances, is the fixed discriminator, is the current parameter of the generator, and is its parameter before fine-tuning. After the fine-tuning is completed, the generator generates a new batch of the worst disturbance scenarios and updates the online scene library after feasibility screening. Although strategy training is not conducted at this stage, the new scenario library is used for potential strategy retraining or online adversarial evaluation in the future. To quantify the degree of distribution drift, Wasserstein distance estimation is introduced as the basis for triggering retraining:
| (13) |
is the reference distribution (fine tune the data from the previous week). If exceeds the preset threshold, the complete strategy retraining process can be initiated. This mechanism ensures that the worst-case scenario set always reflects the uncertainty characteristics of the current operating environment, thereby maintaining the robustness and adaptability of the scheduling strategy in long-term deployment.
3 Multidimensional Performance Verification of Scheduling Strategy
3.1 Experimental Data
The experimental data is based on the actual operation records of three independently deployed distributed multi-energy systems, each located in different climate and load characteristic areas, with a moderate scale (total installed capacity in the range of 10–30 MW), equipped with a complete energy management system and high-precision measurement devices. The three distributed multi-energy systems mentioned above are located in three regions of China with significant geographical and climatic differences: Northeast China (high wind power penetration), North China (high photovoltaic penetration), and East China (mixed load characteristics). These regions constitute the basic data source for the subsequent cross-regional generalization experiment. The raw data includes operational logs of photovoltaic and wind power actual output, load consumption, meteorological observations (irradiance, wind speed, temperature), energy storage SOC, and gas turbine status collected every 15 minutes within two years. All data are time aligned, outlier removed, and processed uniformly by units, and paired with the daily prediction results of the corresponding time period to form a “prediction actual” deviation sequence for disturbance modeling. The three systems do not overlap in terms of device type combination, proportion of renewable energy, and user behavior patterns, ensuring that the training and testing environments have real distribution differences, while avoiding engineering irreproducibility caused by large data scale, which is in line with the anti-learning and online adaptation requirements of the proposed method in limited samples. The data were sequentially divided into three phases: the first 18 months for WGAN pre-training, followed by 3 months for PPO policy training and hyperparameter tuning (validation set), and the final 3 months as a unified test set. All comparison methods were evaluated on the same test set to ensure fairness.
3.2 Assessment of Disturbance Scene Coverage and Extremity
To evaluate the coverage and extreme nature of generated disturbances, 500 real photovoltaic and wind power output deviation sequences were extracted from the historical operation database and time aligned to 96 15 minute time periods; Subsequently, the trained Wasserstein GAN was utilized to generate 500 corresponding disturbance samples under the same meteorological and load forecasting conditions. It calculates the empirical quantiles of real and generated samples at each time period separately, and constructs the temporal quantile envelope. This article quantitatively analyzes the extent to which the generated disturbance extends to the tail region of the historical distribution by comparing the upper and lower boundary positions and median offset of the two envelopes, and examines whether it effectively approaches the worst-case but physically feasible disturbance boundary while maintaining the daily cycle shape.
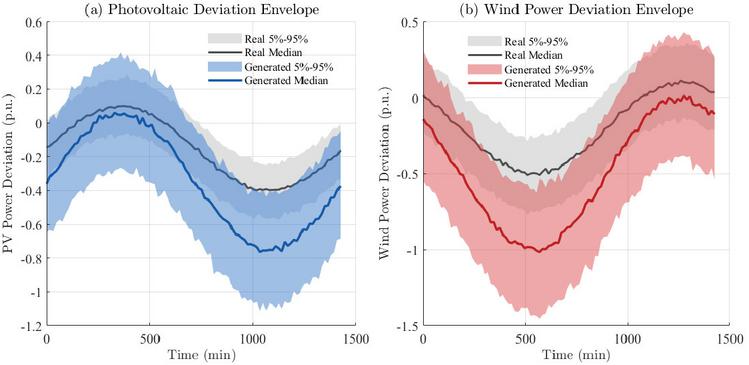
Figure 4 Worst case perturbation envelope generated based on conditional WGAN.
Figures 4(a) and 4(b) respectively show the probability envelope structures of photovoltaic and wind power output deviation disturbances generated by conditional Wasserstein GAN within a 24-hour scheduling window. The horizontal axis represents time (in minutes), and the vertical axis represents normalized power deviation (p.u.), indicating the relative deviation of actual output from the predicted value. Photovoltaic disturbances are affected by sunrise and sunset in a unimodal pattern, while wind power disturbances exhibit a phase shift pattern due to diurnal variations in wind speed. Real disturbance data (gray area) reflects the 5%–95% percentile range of historical observations, with a concentrated distribution and limited fluctuations; And the generated disturbance (blue and red semi transparent areas) significantly expands outward, with its lower boundary far below the historical minimum value, reflecting the active construction of extreme low output scenarios. The median curve also shows a systematic shift, indicating that the generator is not simply copying the historical distribution, but learning its support set boundary and deducing towards the most unfavorable direction for scheduling. This expansion is not unconstrained divergence, but maintains a physical form consistent with the daily cycle, indicating that the conditional mechanism effectively anchors the meteorological driving characteristics. Joint verification of data changes: The generated disturbances accurately cover high-risk tail regions while preserving temporal correlation and conditional consistency, providing a training scenario that combines extremes and rationality for robust scheduling strategies, avoiding the conservative shortcomings or distribution distortion problems of traditional methods limited to historical convex hull.
3.3 Evaluation of the Generation Effect of Meteorological Scene Disturbance Sequences
To evaluate the performance of Wasserstein GAN in generating disturbance sequences under different meteorological conditions, historical measured disturbance data corresponding to three typical meteorological conditions were collected as benchmarks. For each condition, this article uses trained WGAN to generate an equal number of perturbation sequences. Subsequently, the quantitative differences in multidimensional statistical features between the generated sequence and the historical sequence are calculated, including temporal correlation (through autocorrelation function), fluctuation amplitude distribution (through kernel density estimation), and frequency of extreme values. At the same time, physical consistency verification is introduced to evaluate whether the photovoltaic wind power disturbance joint mode generated by the sequence conforms to the known physical laws under the meteorological conditions.
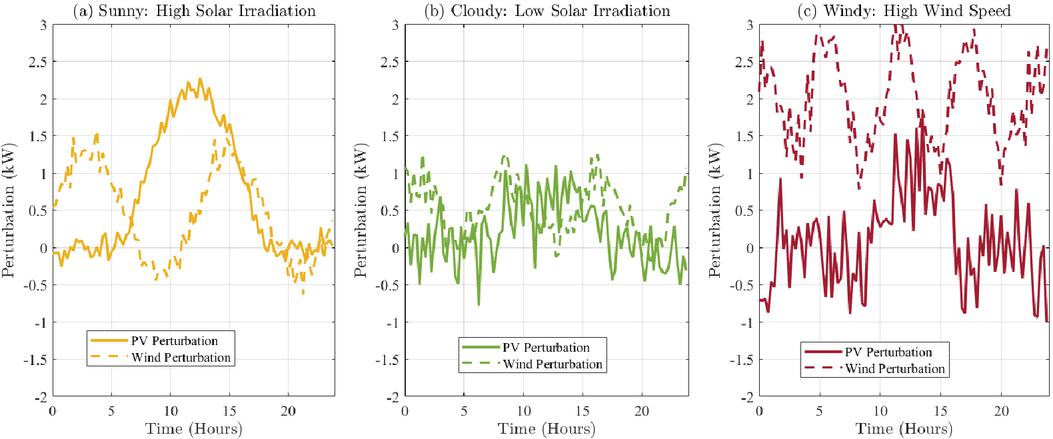
Figure 5 Disturbance sequence of WGAN under different weather conditions.
Figures 5(a), 5(b), and 5(c) show the disturbance sequences of photovoltaic and wind power output generated by WGAN under three typical meteorological prediction conditions (sunny, cloudy, and windy). The horizontal axis represents time (in hours), and the vertical axis represents disturbance amplitude (in kilowatts). The solid line represents the disturbance of photovoltaic output, and the dashed line represents the disturbance of wind power output. It can be observed that the generation mode of WGAN is closely dependent on the input conditional signal: under “sunny” conditions, photovoltaic disturbances exhibit a clear daytime fluctuation pattern (highest at noon), while wind power disturbances are relatively gentle. Under cloudy conditions, the overall amplitude of photovoltaic disturbances decreases; Under the condition of “strong wind days”, the amplitude of wind power disturbance significantly increases and fluctuates violently, while photovoltaic disturbance is affected to some extent. These changes indicate that WGAN is not unconditionally generating data randomly, but can learn and reproduce the complex relationship between the time structure and statistical characteristics of disturbances under different conditions based on meteorological prediction information, thereby generating physically consistent and condition specific disturbance scenarios, providing targeted and diverse adversarial samples for subsequent scheduling strategies.
3.4 Comparison of Economic Indicators
This paper assesses the average daily total dispatch cost and the curtailment rate. The former is the sum of fuel costs, electricity purchase costs, and demand response compensation for gas turbine units, while the latter is the proportion of unconsumed renewable energy to total output. This paper compares WGAN-RL with five currently popular methods – Deep Q-Network (DQN), Soft Actor-Critic (SAC), Distributionally Robust Optimization (DRO), Stochastic Model Predictive Control (SMPC), and Deep Deterministic Policy Gradient (DDPG) – on the same test set. To make DQN applicable to this continuous scheduling task, the gas turbine output, energy storage power, and demand response call quantities are uniformly discretized (each divided into 21 levels), forming a combined action space (a total of actions). This granularity has been verified to achieve a balance between accuracy and computational overhead, and uses the same state input and reward function as other methods to ensure a fair comparison. The test scenarios are divided according to renewable energy penetration rates (30%, 50%, and 70%) to examine the differences in economic performance under different energy supply structures. Fifty independent dispatch simulations are run under each scenario to obtain statistical samples, and the mean and standard deviation are calculated.
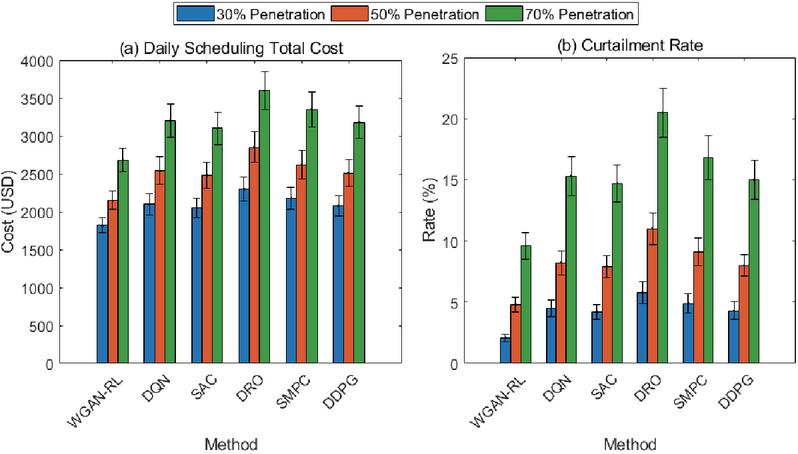
Figure 6 Average daily dispatch cost and renewable energy curtailment rate.
The horizontal axis of Figure 6 represents the six dispatch methods (WGAN-RL, DQN, SAC, DRO, SMPC, DDPG), and the vertical axis represents the average daily dispatch cost and the renewable energy curtailment rate, respectively.
When observing the cost aspect in Figure 6(a), the dispatch cost of all approaches trends upwards as the ratio of renewable energy ascends, yet the increasing rates are diverse. WGAN-RL consistently holds the lowest cost with a small standard deviation for all penetration rates. At 70% renewable energy penetration, its mean daily dispatch cost is 2680 USD 150 USD, which means that its policy is not only the best in terms of economy but also the most robust to highly volatile environments. In contrast, due to its worst-case premise, DRO is too much conservative and exhibits the largest cost increase at high penetration levels. Although SMPC and DQN have some predictive capabilities, they do not explicitly capture tail risks and thus often resort to costly backup resources when confronted with extreme disruptions, limiting the extent to which they can control costs.
For the curtailment rate (Figure 6(a)), WGAN-RL also outperforms, showing the flattest slope of curtailment rate increment with penetration. Its curtailment rate is 9.6% 1.1% at 70% renewable energy penetration. This is because the perturbation generation mechanism can well cover dangerous scenarios, allowing the strategy to learn in training to coordinate energy storage and demand response in absorbing fluctuation, instead of blindly wasting energy. DRO tends to be over conservative and reduce its output too early to satisfy robustness constraints, which may leads to too little system flexibility. DQN, SAC and DDPG, without explicit adversarial training, may be misled to extreme outputs by distribution shifts, resulting in unnecessary energy discarding. SMPC depends on prediction accuracy; prediction errors increase in magnitude at higher penetration levels, thus increasing energy discarding. In summary, WGAN-RL achieves a superior economy-absorption efficiency tradeoff with generative adversarial learning.
3.5 Comparison of Robustness Indicators
Under a unified perturbation injection mechanism, the robustness of six methods (WGAN-RL, DQN, SAC, DRO, SMPC, and DDPG) is quantitatively evaluated. The test set includes four perturbation intensities, defined by the standard deviation of renewable energy output prediction error 0.1, 0.3, 0.5, and 0.7. One hundred independent scheduling simulations are performed for each intensity. Scheduling feasibility is defined as the percentage of scheduling cycles that satisfy all physical and operational constraints (including power balance, ramp limits, energy storage boundaries, and tie-line capacity). The strategy failure count is the frequency with which strategy output actions are rejected by the environment due to violations of hard constraints. Both metrics record the mean and standard deviation for visualization and robustness analysis.
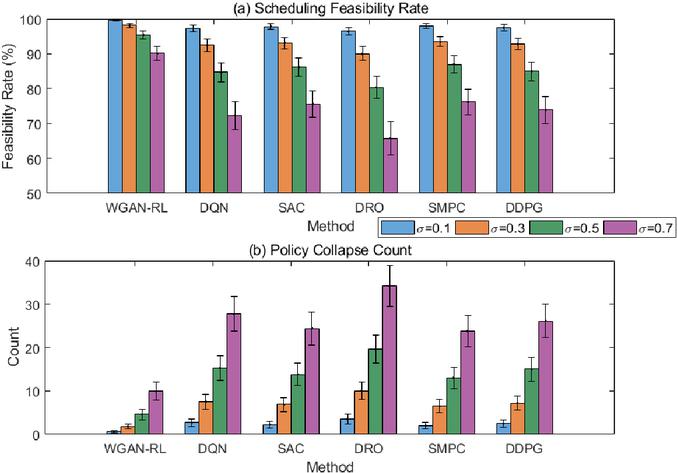
Figure 7 Scheduling feasibility and number of strategy failures.
The horizontal axis of Figure 7 represents the six scheduling methods. The vertical axis of Figure 7(a) represents the scheduling feasibility rate (%), and the vertical axis of Figure 7(b) represents the number of strategy failures (number of failures per 100 scheduling attempts). The data is presented in groups according to four levels of disturbance intensity (classified by the standard deviation of renewable energy output prediction errors), and the error bars reflect the statistical fluctuations across multiple simulations.
As the disturbance intensity increases, the feasibility rate of all methods generally decreases, while the number of failures increases accordingly, consistent with the challenge that increased uncertainty poses to scheduling robustness. Among them, WGAN-RL maintained the highest feasibility rate and lowest crash frequency under all perturbation levels. Under a perturbation of 0.7 output standard deviation, the scheduling feasibility rate was 90.1% 2.1%, and the number of policy crashes was 9.9 2.1, indicating that its policy can still strictly follow the operational constraints under extreme perturbations. This stems from the hard constraint environment and adversarial perturbation generation embedded in its training mechanism – the policy has been repeatedly exposed to the worst-case scenario with high risk but physical feasibility during the training phase, thus internalizing its ability to adapt to boundary conditions. In contrast, although DRO has theoretical robustness, its static uncertainty set is difficult to cover dynamic tail perturbations, resulting in significant constraint violations under high perturbations; policies such as DQN and DDPG, which do not have explicit constraint processing, are prone to outputting inactive actions at the edge of the state space; although SMPC and SAC introduce prediction or entropy regularization, their perturbation modeling depends on historical distribution and is sensitive to distribution shifts. WGAN-RL, through generative adversarial learning, enables policies to maintain economy while deeply coupling feasible domain knowledge into the decision-making process, thus exhibiting stronger disturbance resistance and engineering reliability.
3.6 Real-time Performance Comparison
The real-time performance of each method was evaluated under a unified hardware platform (Intel i7-12700 CPU / NVIDIA RTX 4090 GPU) and consistent input/output dimensions. In the online phase, single-step inference latency was measured using a high-precision timer, with the end-to-end latency from state vector input to action command output being the average of 1000 calls. In the offline phase, the policy training convergence steps were defined as the cumulative number of interactions with the environment, until the daily average cost fluctuation was less than a preset threshold for 50 consecutive evaluation periods. All methods used the same state encoding, action space, and batch processing settings to ensure fairness in the time-series comparison. The evaluation covered the five benchmarks presented in this paper: WGAN-RL, DQN, SAC, DRO, SMPC, and DDPG. For DRO and SMPC, which are optimization methods, the “training steps” were denoted as N/A (Not Applicable).
Table 2 Single-step inference latency and policy training convergence steps
| Method | Online Decision Latency (ms) | Offline Training Convergence Steps |
| WGAN-RL | 4.2 0.3 | 823 |
| DQN | 3.1 0.2 | 3250 |
| SAC | 5.7 0.4 | 2108 |
| DRO | 86.5 5.2 | N/A |
| SMPC | 74.3 4.8 | N/A |
| DDPG | 3.9 0.3 | 2950 |
As shown in Table 2, the six methods exhibit significant differences in online decision latency and offline training convergence steps. WGAN-RL’s single-step inference time is 4.2 ms 0.3 ms, which is slightly higher than DQN and DDPG but dramatically lower than SAC and the two optimization-based methods (DRO and SMPC both take over 70 ms). WGAN-RL achieves this in terms of training efficiency as well, as it is also the first to converge with 823 steps, better than SAC (2108 steps), DDPG (2950 steps), and DQN (3250 steps).
These results arise from the interaction of the design of the method’s architecture and training procedure. PPO policy network structure is relatively simple and the adversarial perturbation scenarios generated by WGAN tend to concentrate on vulnerable aspects of the policy so that the policy can be exposed and repaired in less interaction, which accelerates the process of developing robust policies. DQN has no fine-grained modeling for continuous actions and thus needs to be studied further in high dimensional scheduling spaces; DDPG and SAC can handle continuous control tasks, but the target network update mechanism and the objective of maximizing entropy make them converge more slowly. DRO and SMPC need to solve an optimization problem on-line at each step, increasing in complexity with the number of scenarios, or with size of the constraints and thus suffering ns-scale latencies, much greater than that of learning-based approaches and challenging for fulfilling any real-time requirement of 15-min rolling schedulings. WGAN-RL provides a good trade-off between training sample efficiency, policy robustness and online inference speed, showing the engineering feasibility of the generative-adversarial-learning closed loop in complex energy scheduling.
3.7 Comparison of Generalization Metrics
To evaluate the generalization ability, a leave-one-region cross-validation protocol is adopted: each time, data from two regions are selected to jointly train the model, and the remaining region is used as a completely unseen test set; since there are three regions in total, three sets of “training-test” combinations are formed, each set is repeated twice (switching training/test roles), for a total of 6 sets of cross-tests. Evaluation metrics included cross-regional average daily scheduling cost and policy output variance (calculated as the mean variance of the output of 100 consecutive actions under the same state input, reflecting decision stability). All training and testing data were strictly isolated, and the state-action space, perturbation injection mechanism, and reward structure remained consistent. The final generalization performance was summed by aggregating the metric mean of each method across all cross-combinations (6 groups in total), ensuring that the evaluation was unbiased by region.
Table 3 Cross-regional average daily scheduling cost and policy output variance
| Method | Average Cross-Region Daily Cost (USD) | Policy Output Variance (kW) |
| WGAN-RL | 1840 85 | 12.3 1.1 |
| DQN | 2310 135 | 18.7 2.3 |
| SAC | 2180 120 | 16.9 1.9 |
| DRO | 2750 170 | 22.4 3.0 |
| SMPC | 2520 155 | 20.1 2.6 |
| DDPG | 2250 125 | 17.5 2.1 |
As shown in Table 3, WGAN-RL achieved the lowest average daily dispatch cost (1840 USD 85 USD) and the smallest action output variance (12.3 kW 1.1 kW) in cross regional testing, significantly outperforming other comparative methods. DRO and SMPC rely on historical data distribution or local linearization assumptions, making it difficult to capture structural changes in unseen regions, resulting in high costs and significant control fluctuations. Although DQN, DDPG, and SAC have learning abilities, their training environments lack targeted high-risk disturbance exposure mechanisms, and their strategies are prone to excessive or conservative actions under distribution shifts, resulting in increased costs and unstable outputs. This result is derived from the adversarial generation mechanism of WGAN-RL: Conditional WGAN continuously synthesizes harsh disturbances that are close to the boundary of the real support set during the training phase, and forms a closed-loop feedback with the strategy, forcing the strategy to optimize in scenarios that cover tail risks. This’ stress training ‘not only enhances the adaptability of the strategy to extreme events, but also strengthens its robustness to the differences in the joint distribution of meteorological loads in different regions. At the same time, hard constraint embedding ensures that actions are always within the feasible domain, suppressing ineffective exploration and maintaining smooth output in new scenes. In contrast, methods without adversarial mechanisms only learn within the range of historical perturbations, and their generalization ability is limited when facing out of domain features, resulting in synchronous amplification of costs and fluctuations.
3.8 Ablation and Sensitivity Analysis
To quantify the contribution of each core component to the overall performance, three ablation experiments were designed: (1) removing the adversarial scenario generation mechanism (-AdvGen) and training PPO using only historical perturbations; (2) removing hard-constrained embedding (-HardCon) and replacing it with soft-constrained reward and penalty; (3) removing the weekly fine-tuning mechanism (-Finetune) and fixing the WGAN parameters. All variants were run 50 times on the same test set (70% renewable energy penetration rate, 0.7 perturbation strength) to evaluate economic efficiency, robustness, and efficiency metrics.
Table 4 Comparison of ablation experimental performance
| Method | Avg. Daily Scheduling Cost ($) | Curtailment Rate (%) | Feasibility (%) | Policy Failure Count | Inference Latency (ms) | Training Steps to Converge |
| Full Model (WGAN-RL) | 2680 | 9.6 | 90.1 | 9.9 | 4.2 | 823 |
| w/o Adversarial Scenario Generation (-AdvGen) | 3001.6 | 12 | 82.1 | 15.9 | 4.2 | 1152 |
| w/o Hard Constraint Embedding (-HardCon) | 2894.4 | 11 | 78.1 | 19.9 | 4.2 | 987 |
| w/o Weekly Fine-tuning (-Finetune) | 2814 | 10.6 | 87.1 | 11.9 | 4.2 | 905 |
Table 4 presents a performance comparison of the three ablation experiments under unified test conditions. All indicators are based on statistical results from 50 independent runs. The complete model (WGAN-RL) outperforms the others in terms of economy, feasibility, and stability. Removing the adversarial scenario generation (-AdvGen) increases the cost to $3001.6, reduces feasibility to 82.1%, and increases the number of failures to 15.9, indicating that this module is crucial for improving robustness. Removing the hard constraint embedding (-HardCon) further reduces feasibility to 78.1% and increases the number of failures to 19.9, verifying its role in ensuring engineering feasibility. Removing the weekly fine-tuning (-Finetune), although having a smaller impact, still increases cost, curtailment rate, and number of failures, indicating its positive effect on long-term adaptability. The inference latency for all variants is 4.2 milliseconds, indicating that the structural changes did not affect real-time performance.
4 Conclusion
This article proposes a robust scheduling paradigm for distributed multi-energy virtual power plants, which systematically addresses the scheduling vulnerability caused by the dual uncertainty of renewable energy and load through a collaborative mechanism of generation adversarial learning. The proposed method actively synthesizes high-risk disturbances that approximate the true distribution boundary using conditional Wasserstein GAN, embeds physical hard constraints in the state action space to ensure the feasibility of the strategy, and optimizes the economy and stability of PPO in dynamic adversarial environments. The online rolling scheduling and fine-tuning mechanism of the weekly generator further ensure the adaptability under long-term operation. The experiment shows that this framework outperforms mainstream comparison methods in terms of economy, robustness, real-time performance, and cross regional generalization ability. Its core advantage lies in coupling disturbance generation and policy learning into a closed loop, allowing the policy to actively expose itself to its fragile boundaries during training, rather than passively responding to historical samples. This mechanism effectively bridges the gap between uncertainty modeling and decision optimization, providing an intelligent scheduling path that combines safety, economy, and adaptability for high proportion renewable energy systems.
References
[1] F. Ghasemi Olanlari, T. Amraee, M. Moradi-Sepahvand, et al., ‘Coordinated multi-objective scheduling of a multi-energy virtual power plant considering storages and demand response’, IET Generation, Transmission & Distribution, vol. 16, no. 17, pp. 3539–3562, 2022.
[2] L. Yue, X. Liang, L. Sun, Y. Li, C. Cheng, ‘Research on Collaborative Control Strategy of Virtual Power Plant Based on Deep Reinforcement Learning Framework’, Distributed Generation & Alternative Energy Journal, vol. 40, no. 03, pp. 533–558, 2025.
[3] Li, H., Wang, C., Tian, H., Ren, Z., Zhao, E., and Xu, L., ‘A Multi-objective Optimization Planning Framework for Active Distribution System Via Reinforcement Learning’, Distributed Generation & Alternative Energy Journal, vol. 38, no. 06, pp. 1745–1768, 2023.
[4] J. Liu, N. Luo, L. Chen, F. Zheng, C. Xu, ‘A Two-stage Optimal Dispatching Method of Distribution Network Considering the High Proportion of Distributed Renewable Energy Penetration’, Distributed Generation & Alternative Energy Journal, vol. 40, no. 01, pp. 109–140, 2025.
[5] B. Li, J. J. Wang, X. F. Bai, et al., ‘Overview and prospect of information and communication technology development in virtual power plants’, Energy Conversion and Economics, vol. 3, no. 6, pp. 368–380, 2022.
[6] X. Wan, X. Wen, T. Gong, et al., ‘The low-carbon economic operation strategy of virtual power plant under different electricity-gas-heat-carbon multi-market synergy scenarios’, Journal of Computational Methods in Sciences and Engineering, vol. 23, no. 4, pp. 2237–2254, 2023.
[7] Z. Qiu, X. Zhang, Z. Han, et al., ‘Power allocation optimization strategy for multiple virtual power plants with diversified distributed flexibility resources’, IET Renewable Power Generation, vol. 18, no. 16, pp. 4034–4046, 2024.
[8] Z. Ullah, B. M. Mirjat, ‘Optimisation and Management of Virtual Power Plants Energy Mix Trading Model’, Int. J. Renew. Energy Dev, vol. 11, no. 1, pp. 83–94, 2022.
[9] B. Li, F. Yang, B. Qi, et al., ‘Research on key technologies of P2P transaction in virtual power plant based on blockchain’, IET Smart Grid, vol. 5, no. 4, pp. 223–233, 2022.
[10] S. Wang, W. Wu, Q. Chen, et al., ‘Stochastic flexibility evaluation for virtual power plants by aggregating distributed energy resources’, CSEE Journal of Power and Energy Systems, vol. 10, no. 3, pp. 988–999, 2022.
[11] Z. Dou, C. Zhang, C. Duan, et al., ‘Multi-time scale economic regulation model of virtual power plant considering multiple uncertainties of source, load and storage’, Journal of Computational Methods in Science and Engineering, vol. 24, no. 2, pp. 935–953, 2024.
[12] M. H. Salehi, M. Moradian, M. Moazzami, et al., ‘Distributed energy technologies planning and sizing in a sample virtual power plant using speedy particle swarm optimization algorithm’, International Journal of Smart Electrical Engineering, vol. 12, no. 4, pp. 253–266, 2023.
[13] H. Gao, T. Jin, G. Wang, et al., ‘Low-carbon dispatching for virtual power plant with aggregated distributed energy storage considering spatiotemporal distribution of cleanness value’, Journal of Modern Power Systems and Clean Energy, vol. 12, no. 2, pp. 346–358, 2024.
[14] X. Bai, Y. Fan, R. Hao, et al., ‘Data-driven virtual power plant aggregation method’, Electrical Engineering, vol. 107, no. 1, pp. 569–578, 2025.
[15] S. Mishra, C. Bordin, Q. Wu, et al., ‘Resilient expansion planning of virtual power plant with an integrated energy system considering reliability criteria of lines and towers’, International journal of energy research, vol. 46, no. 10, pp. 13726–13751, 2022.
[16] N. Gu, J. Cui, C. Wu, ‘An auto-tuned robust dispatch strategy for virtual power plants to provide multi-stage real-time balancing service’, IEEE Transactions on Smart Grid, vol. 14, no. 6, pp. 4494–4507, 2023.
[17] M. Basu, C. Jena, B. Khan, ‘Dynamic optimal power flow for multi-operator renewable energy-based virtual power plants’, IET Renewable Power Generation, vol. 17, no. 10, pp. 2625–2637, 2023.
[18] A. Bedi, J. Ramprabhakar, R. Anand, et al., ‘Empowering net zero energy grids: a comprehensive review of virtual power plants, challenges, applications, and blockchain integration’, Discover Applied Sciences, vol. 7, no. 4, pp. 1–22, 2025.
[19] T. Xu, R. Wang, H. Meng, et al., ‘Grid frequency regulation through virtual power plant of integrated energy systems with energy storage’, IET Renewable Power Generation, vol. 18, no. 14, pp. 2277–2293, 2024.
[20] S. Wu, J. Lin, J. Li, et al., ‘Multi-timescale trading strategy for renewable power to ammonia virtual power plant in the electricity, hydrogen, and ammonia markets’, IEEE Transactions on Energy Markets, Policy and Regulation, vol. 1, no. 4, pp. 322–335, 2023.
[21] F. J. Fangshuai, J. C. Junbo, Z. Z. Zhihua, et al., ‘Robust Optimal Scheduling of Distributed Power and Storage Virtual Power Plants Considering Risks’, Modern Electric Power, vol. 40, no. 4, pp. 570–576, 2023.
[22] X. Lu, J. Qiu, C. Zhang, et al., ‘Assembly and competition for virtual power plants with multiple ESPs through a “recruitment–participation” approach’, IEEE Transactions on Power Systems, vol. 39, no. 2, pp. 4382–4396, 2023.
[23] A. Dogan, D. C. Dogan, ‘A review on machine learning models in forecasting of virtual power plant uncertainties’, Archives of Computational Methods in Engineering, vol. 30, no. 3, pp. 2081–2103, 2023.
[24] P. Yong, Z. Yang, N. Zhang, et al., ‘On the Self-Scheduling of Cellular Base Station-Based Virtual Power Plants’, IEEE Internet of Things Journal, vol. 11, no. 14, pp. 24511–24522, 2024.
[25] J. Li, M. Chen, X. Shao, ‘A low-carbon demand response dispatch model for virtual power plants based on information gap decision theory’, Chinese Journal of Management Science, vol. 33, no. 4, pp. 345–356, 2025.
[26] Z. Yi, Y. Xu, C. Wu, ‘Model-free economic dispatch for virtual power plants: An adversarial safe reinforcement learning approach’, IEEE Transactions on Power Systems, vol. 39, no. 2, pp. 3153–3168, 2023.
[27] M. Awadalla, F. Bouffard, ‘Flexibility characterization of sustainable power systems in demand space: A data-driven inverse optimization approach’, IEEE Transactions on Power Systems, vol. 39, no. 5, pp. 6196–6209, 2024.
[28] Q. Fan, D. Liu, ‘A Wasserstein-distance-based distributionally robust chance constrained bidding model for virtual power plant considering electricity-carbon trading’, IET Renewable Power Generation, vol. 18, no. 3, pp. 545–557, 2024.
[29] B. Chen, T. Liu, X. Liu, et al., ‘A Wasserstein distance-based distributionally robust chance-constrained clustered generation expansion planning considering flexible resource investments’, IEEE Transactions on Power Systems, vol. 38, no. 6, pp. 5635–5647, 2022.
[30] C. L. Liu, C. J. Tseng, T. H. Huang, et al., ‘Dynamic parallel machine scheduling with deep Q-network’, IEEE Transactions on Systems, Man, and Cybernetics: Systems, vol. 53, no. 11, pp. 6792–6804, 2023.
[31] Z. Kuai, T. Wang, S. Wang, ‘Fair virtual network function mapping and scheduling using proximal policy optimization’, IEEE Transactions on Communications, vol. 70, no. 11, pp. 7434–7445, 2022.
[32] N. Khan, S. U. Khan, A. Farouk, et al., ‘Generative adversarial network-assisted framework for power management’, Cognitive Computation, vol. 16, no. 5, pp. 2596–2610, 2024.
[33] M. Kang, R. Zhu, D. Chen, et al., ‘A cross-modal generative adversarial network for scenarios generation of renewable energy’, IEEE Transactions on Power Systems, vol. 39, no. 2, pp. 2630–2640, 2023.
[34] Z. Song, Y. Huang, H. Xie, et al., ‘Generation method of multi-regional photovoltaic output scenarios-set using conditional generative adversarial networks’, IEEE Journal on Emerging and Selected Topics in Circuits and Systems, vol. 13, no. 3, pp. 861–870, 2023.
[35] J. Chen, T. Yu, Z. Pan, et al., ‘Stochastic dynamic power dispatch with human knowledge transfer using graph-GAN assisted inverse reinforcement learning’, IEEE Transactions on Smart Grid, vol. 15, no. 3, pp. 3303–3315, 2023.
[36] Y. Yang, L. Feng, Y. Sun, et al., ‘Decentralized cooperative caching and offloading for virtual reality task based on GAN-powered multi-agent reinforcement learning’, IEEE Transactions on Services Computing, vol. 17, no. 1, pp. 291–305, 2023.
[37] X. Zhang, D. Li, X. Fu, ‘A novel wasserstein generative adversarial network for stochastic wind power output scenario generation’, IET Renewable Power Generation, vol. 18, no. 16, pp. 3731–3742, 2024.
[38] M. N. Hasan, S. U. Jan, I. Koo, ‘Wasserstein GAN-based digital twin-inspired model for early drift fault detection in wireless sensor networks’, IEEE sensors journal, vol. 23, no. 12, pp. 13327–13339, 2023.
[39] Y. Pezhmani, M. A. Mirzaei, K. Zare, et al., ‘Robust self-scheduling of a virtual multi-energy plant in thermal and electricity markets in the presence of multi-energy flexible technologies’, International Journal of Energy Research, vol. 46, no. 5, pp. 6225–6245, 2022.
[40] H. Zhao, X. Wang, Z. Siqin, et al., ‘Two-stage optimal dispatching of multi-energy virtual power plants based on chance constraints and data-driven distributionally robust optimization considering carbon trading’, Environmental Science and Pollution Research, vol. 30, no. 33, pp. 79916–79936, 2023.
[41] Y. Xu, Y. Mu, H. Qi, et al., ‘Optimal dispatch approach for rural multi-energy supply systems considering virtual energy storage’, Global Energy Interconnection, vol. 6, no. 6, pp. 675–688, 2023.
Biographies

Yan Shi was born in 1991 in Genhe City, Inner Mongolia, China. He obtained his master’s degree from Inner Mongolia Normal University. Currently, he works at the State Grid Mengdong Power Supply Service Supervision and Support Center. His research interests include power marketing, load management, marketing informatization, and virtual power plants.

Wenwen Wang was born in 1993 in Chifeng, Inner Mongolia, China. She obtained her master’s degree from Inner Mongolia University for Nationalities. Currently, she works at the State Grid Mengdong Power Supply Service Supervision and Support Center. Her research interests include power marketing and digitalization of party building.
Distributed Generation & Alternative Energy Journal, Vol. 41_4, 971–1002
doi: 10.13052/dgaej2156-3306.4145
© 2026 River Publishers