Multi-agent Reinforcement Learning-based Basic Data Collection and Dynamic Information Evaluation for Power Station Primary Frequency
Tianxiong Huang*, Zhongming Dong, Chuhui Li and Yinchuan Liang
China Yangtze Power Co., Ltd. Wudongde Hydropower Plant, Kunming 651580, Yunnan, China
E-mail: tianxiong_huang@outlook.com
*Corresponding Author
Received 19 January 2026; Accepted 06 March 2026
Abstract
Primary Frequency Regulation (PFR) of power stations is faced with challenges such as intensified frequency dynamic fluctuations, complex coordinated control of multiple power sources, and unbalanced operating economy. Traditional data collection methods are difficult to meet the demand for precise control of PFR. This study intends to establish a multi-dimensional data collection system to improve the accuracy of primary frequency regulation dynamic information evaluation and strategy optimization effects. It first designs a multi-source acquisition framework covering grid-side frequency indicators and power station-side equipment operation data, and combines time series interpolation and outlier detection for data preprocessing. Then, a dynamic information evaluation model based on multi-agent proximal strategy optimization is built to achieve multi-power collaborative evaluation through centralized training and decentralized execution mode. Finally, an improved particle swarm optimization algorithm is used to optimize the frequency regulation strategy. Based on the on-site measured data of a provincial-level integrated energy power station (including 4 types of power sources and continuous operation for 30 days), the research results show that the data integrity of the proposed data collection system was improved to 98.7%, and the frequency deviation prediction error of the dynamic evaluation model was controlled within 0.02 Hz. The optimization strategy increased the lowest point of frequency by 0.03–0.05 Hz, and reduced the total cost of frequency regulation by 12.3%. The study provides accurate data support and efficient control solutions for PFR of power stations, which has important practical significance for improving the frequency stability and operating economy of the power system.
Keywords: Primary frequency regulation, renewable integration, multi-energy system coordination, data-driven grid flexibility, low-carbon power system operation, real-time performance assessment, industrial-scale frequency control.
1 Background
With the large-scale integration of new energy into the grid and the diversified development of electricity loads, the power system is characterized by complex coordinated control of multiple power sources and intensified dynamic frequency fluctuations. The frequency regulation mode based on traditional thermal power is difficult to adapt to the operation scenario of high proportion of renewable energy, resulting in increasingly prominent problems such as delayed frequency regulation response and unbalanced operating economy [1, 2]. At the same time, traditional data collection methods mostly rely on single-link transmission, are susceptible to communication interruptions and equipment failures, and lack data integrity and accuracy, making them unable to provide reliable support for precise frequency regulation control. In terms of data processing, traditional interpolation and outlier detection methods have insufficient adaptability and are difficult to meet the demand for high-integrity and high-precision data in primary frequency regulation. At the level of strategy optimization, existing algorithms often have shortcomings such as static parameter settings and easy falling into local optima, making it difficult to adapt to dynamically changing load disturbances and equipment states [3, 4]. The core reason for this series of problems lies in the insufficient perception, processing, and application capabilities of the basic data of Primary Frequency Regulation (PFR) of the power station. Power station PFR basic data refers to a full-dimensional core data collection that supports the realization of the PFR function of the power system. These data are the core basis for PFR strategy formulation, dynamic status assessment, and collaborative control execution. Its completeness, accuracy and real-time performance directly determine the rapidity of frequency regulation response, control accuracy, and operating economy, and are the basic premise for solving the current problems faced by PFR such as difficulty in responding to dynamic fluctuations, weak coordination of multiple power sources, and economic imbalance [5, 6].
With the large-scale integration of wind turbine units into the power grid, utilizing their active power to actively participate in the grid frequency regulation has become a research hotspot. However, traditional frequency control strategies usually adopt fixed gains, which are difficult to flexibly adjust the rotor kinetic energy release according to the real-time operating status of the wind turbines, and cannot achieve effective coordination among multiple wind turbines within the wind farm. To address these issues, Liang et al. modeled the coordinated frequency regulation problem of all wind turbines in the wind farm as a decentralized partially observable Markov decision process (Dec-POMDP), and solved it using a multi-agent deep reinforcement learning algorithm. Simulation results show that the proposed method effectively suppresses the system frequency drop while significantly reducing the mechanical loads of key components such as tower frames and transmission chains. Compared with traditional control strategies, it has better frequency support performance and structural friendliness [7]. With the large-scale integration of renewable energy into the interconnected power system, traditional reinforcement learning algorithms encounter problems such as slow convergence speed and poor suppression effect of regional control error (ACE) in load frequency control (LFC). To address this, Yang et al. proposed a data-driven LFC method for multi-agent reinforcement learning that integrates an attention mechanism. Simulation verification on the IEEE three-area interconnected system shows that the proposed method can effectively suppress the ACE caused by load fluctuations and the uncertainty of renewable energy output, and significantly improve the training efficiency of the algorithm [8]. In response to the collaborative control challenges faced by isolated microgrids with a high proportion of renewable energy in terms of frequency stability and power generation economy, Li et al. proposed a data-driven coordinated load frequency control (DC-LFC) method, aiming to coordinate the dynamic interaction between controllers and power distributors in the system. The results showed that it effectively suppressed frequency deviations while significantly reducing the total power generation cost of the system, demonstrating good engineering applicability and promotion potential [9]. In view of the insufficient PFR capability of nuclear coupled hydropower plants when dealing with high penetration rates of intermittent renewable energy in the power grid, Wu Q et al. developed a dynamic model of hydropower plants. They proposed two new strategies, the constant turbine power method and the Proportional-Integral (PI) decoupling method, to enhance its PFR capability. Both strategies could keep the reactor running at full power during the PFR process, and both were better than the original strategy [10].
Compared with the existing multi-agent reinforcement learning (MARL) methods that have limitations such as local perception, slow training convergence, and insufficient collaborative decision-making accuracy in multi-power source coordinated frequency regulation, this study adopts the multi-agent proximal policy optimization (MAPPO) approach. By integrating global state information through a centralized valuation network, it breaks through the decision bottleneck of traditional decentralized MARL that relies solely on local observations. At the same time, it introduces a multi-dimensional reward function based on frequency control accuracy, multi-agent collaboration degree, and economy, solving the problem of imbalance between frequency regulation effect and operational economy caused by a single reward mechanism. Moreover, this method enhances the exploration ability of agents through the entropy regularization term and improves training stability by combining batch update strategies. Its improvement ideas are not only applicable to the primary frequency regulation scenario of power stations but can also be transferred to multi-agent decision-making fields such as microgrid coordinated control and multi-energy complementary dispatch, and have strong universality.
2 Methods
This study builds a multi-dimensional data collection system covering the grid side and power station side and completes data preprocessing through linear interpolation, Grubbs criterion outlier detection, and sliding window filtering. A MAPPO optimized Dynamic Information Evaluation (DIE) model is built based on the centralized training and distributed execution architecture. Improved Particle Swarm Optimization (IPSO) is proposed to dynamically adjust the key parameters of frequency regulation of each power supply to achieve global optimization of frequency regulation effect and economy.
2.1 Multi-dimensional Basic Data Collection and Preprocessing for PFR of Power Stations
This study builds a multi-dimensional data collection system covering frequency dynamic parameters on the grid side and the operating status of multiple power sources on the power station side. The grid side collects data at a 25 ms sampling interval through a synchronized Phasor Measurement Unit (PMU) [11, 12]. The data acquisition system adopts a hierarchical deployment architecture: at the bottom layer, 12 synchronous PMUs (with a sampling frequency of 50 Hz), 8 intelligent meters (with a sampling frequency of 1 Hz), and 4 sets of equipment status monitoring terminals are deployed, respectively collecting real-time operational data such as grid-side frequency and equipment active power output; at the middle layer, data is aggregated to the edge computing node through industrial Ethernet (with a transmission rate of 100 Mbps), completing data format conversion and preliminary filtering; at the upper layer, data storage and backup are achieved through the cloud platform, with a storage period of 90 days. To address missing data due to communication interruption or equipment failure during the collection process, this study uses a linear interpolation method based on time series similarity to complete the data. It allocates interpolation weights by calculating the time weight coefficients of the data at each moment before and after the missing data, as shown in Equation (1).
| (1) |
In Equation (1), is the complementary data value of time . and are valid data values adjacent to the missing period. is the time weight coefficient. During the data collection process, outliers are easily introduced due to electromagnetic interference and sensor errors. This study uses an outlier detection method based on the Grubbs criterion and combines the statistical distribution characteristics of power station PFR data to identify and eliminate abnormal data [13, 14]. First, the mean and standard deviation of the data sequence are calculated, and then the test statistic is constructed to determine whether the data is an outlier, as shown in Equation (2).
| (2) |
In Equation (2), is the Grubbs test statistic. and are the maximum and minimum values in the data sequence to be detected. is the mean of the data series. is the standard deviation of the data series. When is greater than the critical value corresponding to the sample size at the 95% confidence level, the data are determined as an outlier, and the median of the data at five adjacent moments are used to replace it to reduce the impact of outliers on subsequent evaluations. The designed multi-dimensional data collection framework includes a three-level structure of perception layer, transmission layer and pre-processing layer, as shown in Figure 1.
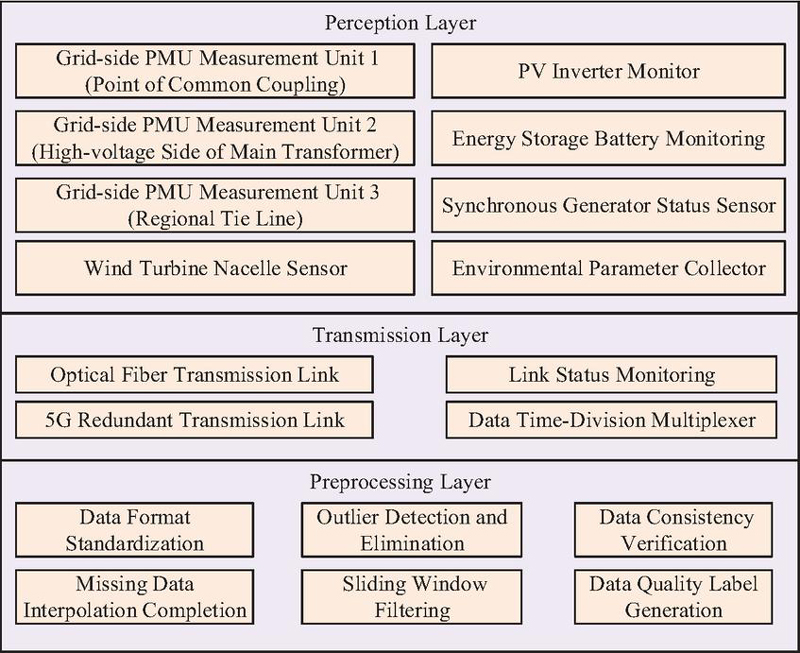
Figure 1 Power station PFR multi-dimensional data collection framework.
In Figure 1, the perception layer uses 3 PMUs and 5 sets of equipment-specific sensors to synchronously collect 16 types of core parameters such as frequency and active output, covering the operating status of the power grid and the working conditions of each power supply equipment. The transmission layer adopts optical fiber + 5G dual-link redundancy design, combined with time-division multiplexing and link monitoring mechanisms to ensure stable transmission of high-priority data and low-priority data. The preprocessing layer sequentially completes data format standardization, interpolation completion, outlier removal, filtering and noise reduction, and consistency verification [15, 16]. To further improve the data quality, this study performs timing consistency verification on the preprocessed data, and achieves secondary screening of data validity by calculating the change rate threshold of data at adjacent sampling moments. It also uses the sliding window mean filtering method to reduce high-frequency noise interference, and the filter window length is adaptively adjusted to 10 sampling points according to the data sampling frequency. The filtering formula is shown in Equation (3).
| (3) |
In Equation (3), is the filtered data value. is the length of the sliding window, and is the preprocessed data at the -th sampling moment before time . is the data sampling period. This filtering method can effectively suppress high-frequency electromagnetic noise in frequency data while retaining key dynamic characteristics in the PFR process. The entire data preprocessing process is realized through the collaboration of collection terminals and edge computing nodes, as shown in Figure 2.
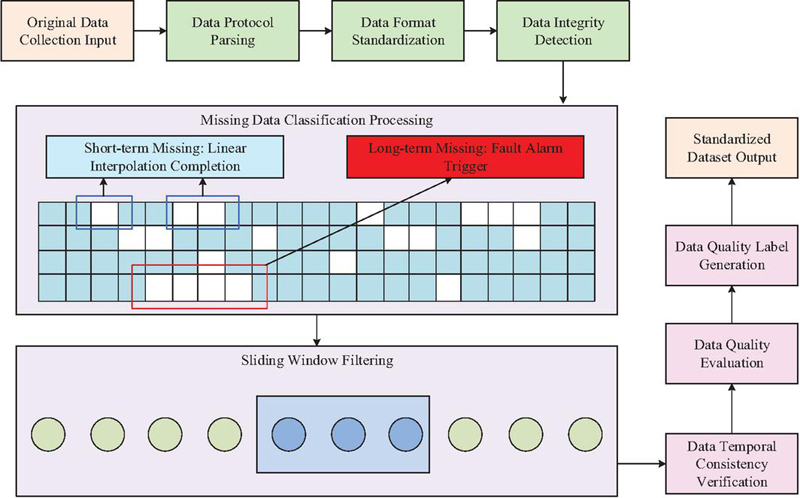
Figure 2 The whole process of data preprocessing.
In Figure 2, the original data enter the interpolation completion module after format standardization. Linear interpolation is used for data with 3 consecutive missing sampling points. Data with 3 consecutive missing sampling points are marked as invalid and triggers an equipment failure alarm. The outlier detection module uses a sliding window mechanism. The filtered data enter the consistency check module, and by comparing the change rate of active power output at adjacent moments with the maximum adjustment rate of the equipment, data that exceeds physical constraints are eliminated [17, 18].
2.2 Construction of DIE Model for PFR of Power Stations Based on MAPPO
Based on the multi-dimensional standardized dataset constructed in this study, a DIE model based on MAPPO is constructed to address the problems of difficulty in multi-power collaborative evaluation and dynamic response lag in power station PFR. The model achieves real-time evaluation of frequency deviation, multi-power output synergy and frequency regulation economy through a centralized training-decentralized execution architecture. The model first constructs the DIE problem of power station PFR as a decentralized partially observable Markov decision process [19, 20]. The state vector is shown in Equation (4).
| (4) |
In Equation (4), is the frequency deviation of the grid connection point. is the frequency change rate. is the energy storage state of charge. is the number of power supplies participating in PFR in the power station. The value range of is constrained by the frequency regulation reserve capacity of each power supply to ensure that the state variables comply with actual equipment operation constraints. The action vector is shown in Equation (5).
| (5) |
In Equation (5), is the frequency regulation output command adjustment amount. To achieve the dual-objective evaluation of frequency regulation effect and economy, this study designs a multi-dimensional reward function , comprehensively considering frequency control accuracy, multi-agent collaboration and output cost, as shown in Equation (6).
| (6) |
In Equation (6), is the frequency control reward. is the collaborative reward, which improves collaboration by suppressing excessive actions of a single agent. is the economic reward. The MAPPO evaluation model adopts a centralized training-decentralized execution architecture, as shown in Figure 3.
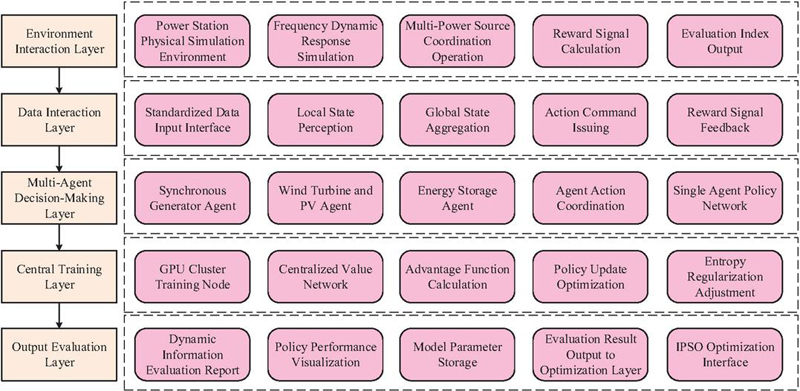
Figure 3 DIE model architecture based on MAPPO.
In Figure 3, the environment interaction layer simulates the entire PFR scenario through the power station physical simulation environment, realizes load disturbance, frequency response and multi-power collaborative operation, and calculates reward signals and evaluation indicators. The data interaction layer is responsible for standardized data access, local/global status awareness and low-latency communication to ensure efficient data transmission between the model and the environment. The multi-agent decision-making layer treats synchronous machines, wind turbines, photovoltaics, and energy storage as independent agents, generates actions through a shared policy network, and satisfies power balance constraints through the coordination module. The central training layer relies on the Graphics Processing Unit (GPU) cluster and centralized valuation network to calculate the advantage function, uses the PPO algorithm to update the strategy and enhances the exploration capability through the entropy regularization term [21, 22]. The centralized valuation network uses the global state to calculate the advantage function , as shown in Equation (7).
| (7) |
In Equation (7), is the advantage function of time , which represents the advantage of the current action relative to the average level. is the discount factor, giving priority to the impact of recent rewards on the strategy. is the trajectory length. is the state value function, which predicts the expectation of future cumulative rewards in the current state. The model training process is divided into three stages: data collection, policy update, and convergence verification, as shown in Figure 4.
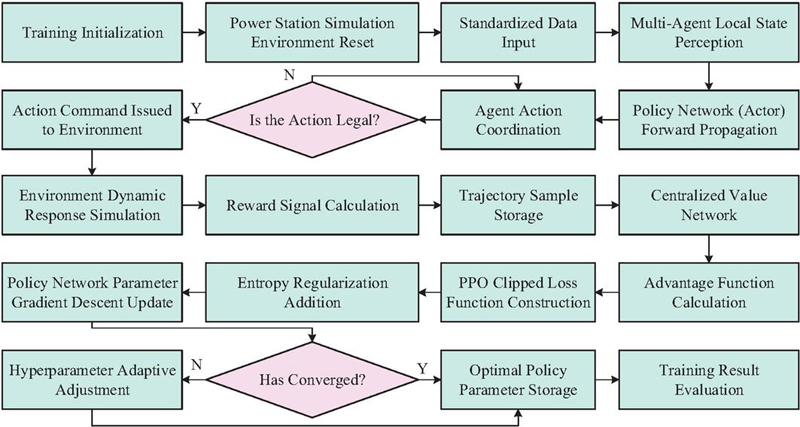
Figure 4 MAPPO model training process.
In Figure 4, the power plant simulation environment is reset and accessed to standardized data. Multi-agent collects working condition data through local state awareness, generates actions through the policy network, and satisfies power balance constraints through the coordination module. Illegal actions are corrected and sent to the environment for execution.
2.3 IPSO-based PFR Strategy Optimization Method for Power Stations
The traditional PFR strategy has problems such as static parameter setting and difficulty in adapting to dynamic load disturbances and changes in equipment status. Therefore, this study proposes a strategy optimization method based on IPSO based on the frequency deviation prediction, multi-power supply synergy and economic quantification results output by the MAPPO DIE model. This method achieves global optimization of PFR effect and operating economy by dynamically adjusting the frequency regulation parameters of each power supply. First, the optimization variable vector is constructed, as shown in Equation (8).
| (8) |
In Equation (8), is the proportional gain of the synchronous machine speed regulator, which determines the response sensitivity of the synchronous machine to frequency deviation. is the virtual inertia coefficient of the fan, which affects the rate at which the fan releases rotor kinetic energy. is the photovoltaic load shedding reserve coefficient, which controls the proportion of photovoltaic frequency regulation reserves reserved. is the energy storage droop coefficient, which represents the linear relationship between energy storage output and frequency deviation. is the energy storage response speed coefficient, which limits the change rate of energy storage output to avoid battery impact. To achieve dual-objective optimization of optimal frequency regulation effect and optimal economic efficiency, this study constructs a multi-objective optimization function , as shown in Equation (9).
| (9) |
In Equation (9), is the frequency regulation effect objective function. is the economic objective function. In view of the problems that traditional PSO is easy to fall into local optimality and has slow convergence speed in the later period, this study improves it from three aspects. The first is to introduce the nonlinear inertia weight and the global exploration and local development capabilities of the dynamic balance algorithm. The second is to design an adaptive learning factor to enhance the pertinence of particles learning toward individual optimality and global optimality. The third is to add mutation operations to avoid premature convergence of the particle swarm [23–25]. The improved particle velocity update is shown in Equation (2.3).
| (10) |
In Equation (2.3), is the speed of the -th particle of the th generation in the -th dimension. is the nonlinear inertia weight. and are adaptive learning factors. and are random numbers between [0, 1], which increases the randomness of the search. is the -th dimension of the individual optimal position of the -th particle. is the -th dimension of the global optimal position of the entire particle swarm. is the variation term. The particle position update is shown in Equation (11).
| (11) |
In Equation (11), is the position of the -th particle of the -th generation in the -th dimension. and are the lower limit and upper limit of the -th dimension optimization variable respectively. This update mechanism ensures that all particles always search within the feasible region to avoid invalid optimization results due to parameter out-of-bounds. The IPSO strategy optimization process is shown in Figure 5.
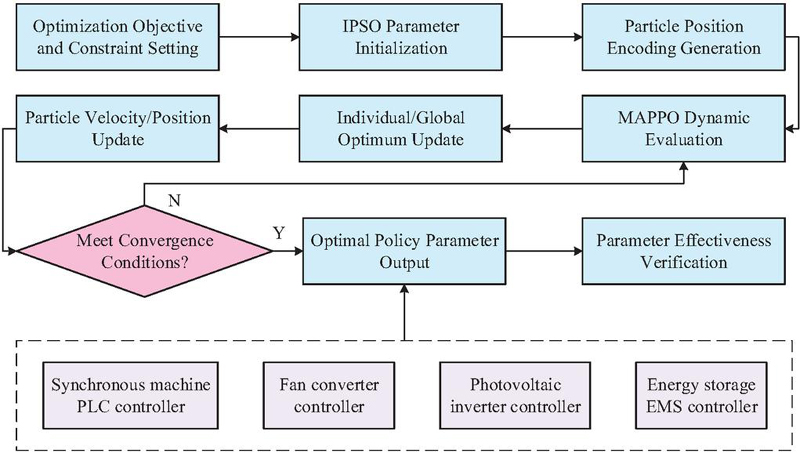
Figure 5 PFR strategy optimization process based on IPSO.
In Figure 5, the first step is to clarify the dual objectives of frequency regulation effect and economy and the equipment parameter constraints, initialize key parameters such as particle swarm and inertia weight of the IPSO algorithm, and encode the frequency regulation strategy parameter vector. Subsequently, it evaluates the optimization function value corresponding to each particle through the MAPPO model, and updates the individual and global optimal particle positions. Based on the improved inertia weight and mutation operation, the particle velocity and position are updated, and the evaluation and update process is repeated until the convergence conditions are met. Finally, the optimal strategy parameters are output and sent to the on-site controller, and the validity of the parameters is verified through on-site operation to ensure that the optimization results adapt to the actual needs of PFR.
The improvements made by IPSO to the traditional particle swarm optimization are focused on three aspects. Firstly, a nonlinear inertia weight is adopted, with the value decreasing from 0.9 to 0.4 dynamically, balancing the global exploration and local exploitation capabilities of the algorithm during the iterative process. Secondly, an adaptive learning factor is designed, with the individual learning factor being 1.5 in the early stage and the global learning factor being 1.0. Later, it is adjusted in reverse to enhance the targeted search ability of the particles. Thirdly, a mutation mechanism is added. When a particle fails to update its individual optimum for 10 consecutive times, its position is randomly perturbed within a range of 5%–10% to avoid local optima. The algorithm parameters are set as a particle swarm size of 50, a maximum number of iterations of 200, and the optimization variable values strictly follow the physical constraints of the equipment. The synchronous machine proportional gain is 0.05–0.25, the virtual inertia coefficient of the fan is 2–8, the photovoltaic load shedding reserve coefficient is 0.05–0.2, the energy storage droop coefficient is 0.02–0.1, and the energy storage response speed coefficient is 0.5–2.0.
The integrated architecture of the on-site control layer adopts the edge computing-cloud collaboration model, as shown in Figure 6.
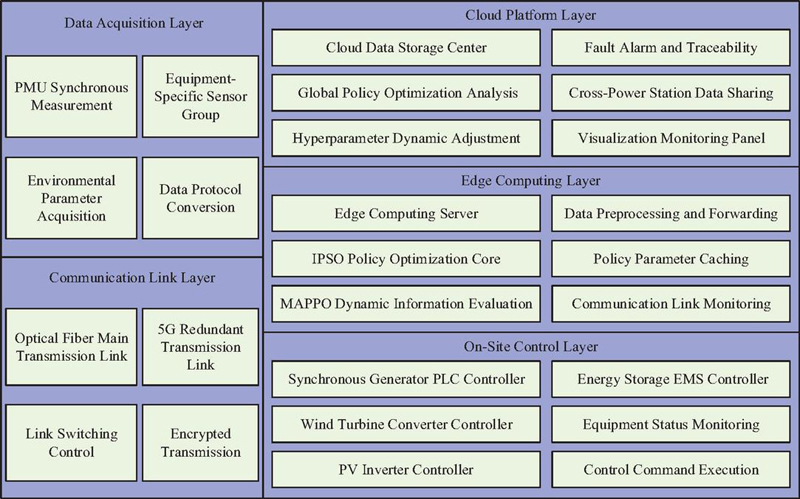
Figure 6 On-site control layer integration architecture.
In Figure 6, the edge computing layer serves as the core processing node, realizing real-time parameter optimization and indicator evaluation through the IPSO policy optimization and MAPPO dynamic evaluation modules, synchronously caching the optimal strategy and monitoring the communication link status. When an exception occurs, parameter rollback is triggered to ensure stability. The communication link layer adopts an optical fiber + 5G dual-link redundant design, combined with encrypted transmission and link switching mechanisms, to ensure low-latency and highly reliable transmission of data and instructions. The overall architecture achieves a global balance between real-time on-site control and cloud optimization.
3 Results
This study verifies the effectiveness of the multi-dimensional data collection system and evaluates the performance of the MAPPO optimized DIE model through the frequency deviation prediction error. Under different load disturbance intensity working conditions, the practical application results of IPSO are quantitatively analyzed from the aspects of frequency regulation control effect and economy.
3.1 Validity Verification of Dynamic Information Evaluation Model Based on MAPPO
To verify the effectiveness of the proposed multi-dimensional data acquisition system and the MAPPO-based DIE model, a comprehensive test platform including power grid simulation, multi-power supply hardware-in-the-loop, and data processing units is built. In terms of hardware configuration, the grid side uses NARI relay protection PMU-5000 synchronous PMU to collect electrical quantities at the grid-connected point at a 25 ms sampling interval. The measurement accuracy of this equipment reaches 0.001 Hz. The dataset comes from the actual operation data of comprehensive energy power stations affiliated to the provincial power grid from March to April 2024, covering multiple scenarios such as load peak and valley periods, new energy output fluctuations, and power grid disturbances. The original dataset size is 864,000 records, and after preprocessing, the effective dataset is 853,680 records. Table 1 is the detailed parameters of the experimental configuration.
Table 1 Experimental configuration
| Configuration Category | Specific Project | Specification Parameters |
| Hardware equipment | PMU | Nari-relays PMU-5000, measurement accuracy 0.001 Hz, sampling interval 25 ms |
| Distributed data acquisition terminal | Huawei iMaster EC600 supports 16 analog input channels and communication interfaces RS485/Ethernet | |
| Sensor | Siemens 7MF4033 (pressure, error 0.08%), Omron E8F2 (flow, error 0.1%), Keyence LV-H65 (displacement, error 0.05%), etc | |
| Data processing server | Processor: Xeon Gold 6348 (2.6 GHz, 32 cores and 64 threads), GPU: NVIDIA A100 (40 GB HBM2e), SSD: 1TB Samsung 980 Pro | |
| Software environment | Operating system | Ubuntu 22.04 LTS |
| Programming languages and frameworks | Python 3.9, PyTorch 2.1, OpenDSS 9.4.0 | |
| Data processing tool | Pandas 2.1.4, NumPy 1.26.0 | |
| Communication protocol | IEC 61850-9-2 |
To comprehensively verify the superiority of the proposed solution, three comparison algorithms commonly used in the current power station PFR field are selected for performance evaluation, including Support Vector Machine (SVM), Long Short-Term Memory Network (LSTM), and Single-agent Proximal Policy Optimization (PPO). The calculation method and evaluation criteria for the core indicators are as follows: Data integrity (Effective data volume/Theoretical data volume to be collected) 100%, where the theoretical data volume to be collected is determined by the sampling frequency and the collection duration. The effective data must meet the validity condition of “parameter values being within the equipment’s rated operating range 10%”. Frequency deviation Real-time frequency Rated frequency (50 Hz). The evaluation criteria refer to GB/T 15945-2008 “Power Quality – Frequency Deviation of Power System”, requiring a steady-state frequency deviation of 0.2 Hz and a transient frequency deviation of 0.5 Hz. Training convergence time = The duration from the algorithm’s startup until the fluctuation amplitude of the loss function value is 1% after 10 consecutive iterations. Real-time evaluation delay The time interval from data collection completion to the output of the evaluation result. The evaluation criteria must meet the requirements of the power station’s primary frequency regulation response (10 ms).
The experiment is compared by counting the proportion of effective data in the original data after preprocessing of each scheme, the accuracy of missing data completion and the accuracy of outlier detection, as shown in Figure 7.
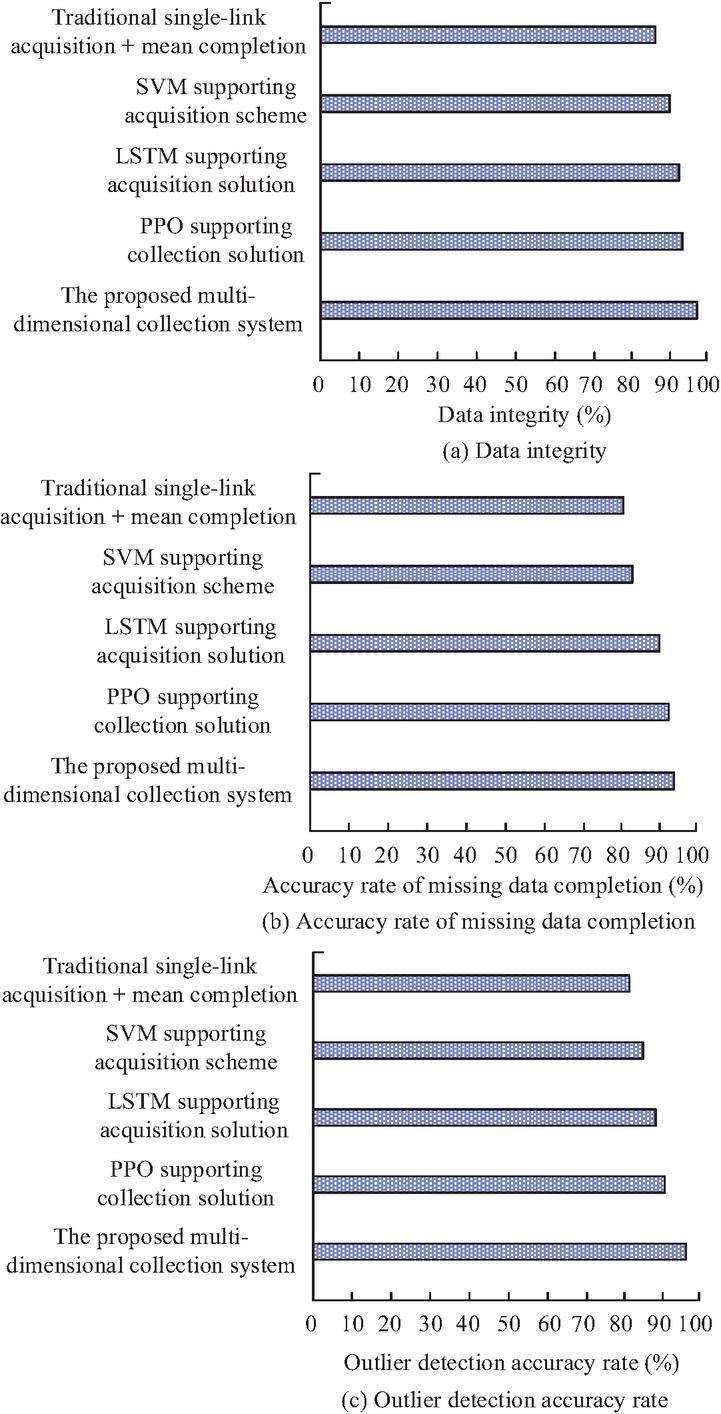
Figure 7 Comparison of data collection system integrity.
In Figure 7(a), in terms of data integrity, the proposed solution reaches 98.70%. The optical fiber 5G dual-link redundant transmission design and the linear interpolation method based on time series similarity effectively reduce data loss caused by communication interruptions and equipment failures. In Figure 7(b), the missing data completion accuracy reaches 97.83%. The proposed interpolation method achieves more accurate missing data restoration through time weight coefficient allocation. In Figure 7(c), the outlier detection accuracy is as high as 98.56%. The outlier detection method based on the Grubbs criterion combines the statistical distribution characteristics of the power station’s PFR data and can accurately identify outliers introduced by electromagnetic interference and sensor errors. Frequency deviation prediction error is the core metric to measure the performance of dynamic evaluation models. The experiment selects three indicators: Mean Absolute Error (MAE), Root Mean Square Error (RMSE), and Maximum Absolute Error (MaxAE) for quantitative comparison, as shown in Figure 8.
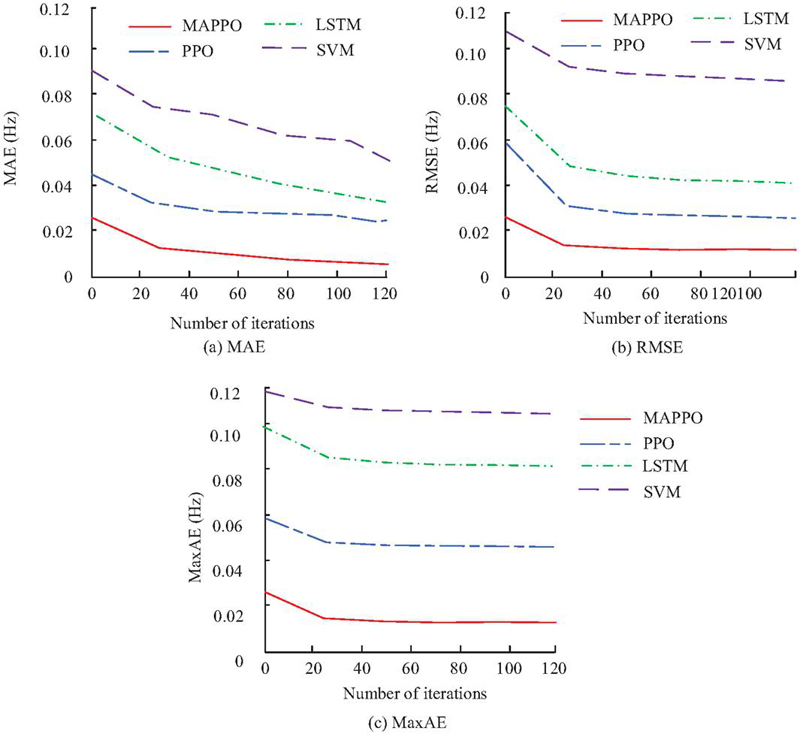
Figure 8 Comparison of frequency deviation prediction errors of dynamic evaluation models.
In Figure 8(a), the MAE of the proposed model is 0.0135 Hz. In Figure 8(b), the RMSE of MAPPO is 0.0178 Hz. In Figure 8(c), the MaxAE of MAPPO is only 0.0196 Hz, controlled within the range of 0.02 Hz. MAPPO’s centralized training-decentralized execution architecture achieves accurate perception of the coordinated operating status of multiple power sources by treating synchronous machines, wind turbines, photovoltaics, and energy storage as independent intelligent entities. At the same time, the multi-dimensional reward function takes into account frequency control accuracy and synergy, effectively reducing prediction errors caused by dynamic response lag.
To further verify the superiority of the proposed IPSO strategy, comparative experiments were conducted with the currently popular single-agent reinforcement learning methods and other mainstream optimization strategies, including PPO, adaptive genetic algorithm (AGA), and deep Q-network (DQN). In the experiment, all the algorithms were trained based on the same dataset. The training batch size was uniformly set to 1000 batches, with each batch containing 2048 samples. The convergence performance was evaluated by the trend and stability of the loss function. The results are shown in Figure 9.
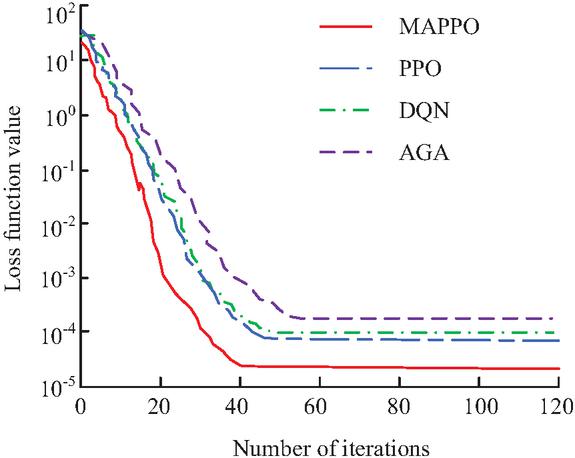
Figure 9 Convergence of loss functions for different algorithms.
In Figure 9, the convergence performance of MAPPO is the best. Its objective function value remains at the lowest level throughout the process, and it reaches a stable convergence state after approximately 40 iterations. The final convergence value is lower than that of the other three algorithms, demonstrating superior global optimization capabilities.
To comprehensively evaluate the adaptability of each model in the actual power station’s PFR scenarios, three typical operating scenarios were selected: the first is the peak load scenario, which refers to the situation where the grid load is at the daily peak (19:00–21:00) and the total load fluctuates by 5%; the second is the fluctuation scenario of new energy output, which refers to the situation where the output of wind power/photovoltaic power experiences a sudden change of 15% due to weather conditions; the third is the grid disturbance scenario, which refers to the situation where the grid experiences instantaneous frequency fluctuations of 0.2 Hz due to line switching, fault clearing, etc. The experimental data were sourced from the actual operation data of an integrated energy power station under a provincial grid in March–April 2024, covering the operating parameters of synchronous generators, wind turbines, photovoltaic power, and energy storage. The original data size was 864,000 (sampling interval of 25 ms, continuous collection for 30 days), after preprocessing such as format standardization, interpolation completion, and outlier elimination, the effective data volume was 853,680. The comprehensive performance comparison results of different models in these scenarios and data are shown in Table 2.
Table 2 Comparison of comprehensive performance of models in different scenarios
| Data | Frequency | Training | Real-time | ||
| Evaluation | Integrity | Deviation | Convergence | Assessment of | |
| Model | Scene Type | (%) | (Hz) | Time (min) | Latency (ms) |
| SVM | Peak load scenario | 91.85 | 0.0612 | 17.8 | 2.2 |
| New energy output fluctuation scenario | 92.34 | 0.0573 | 18.5 | 2.3 | |
| Grid disturbance scenario | 92.35 | 0.0573 | 19.5 | 2.4 | |
| LSTM | Peak load scenario | 94.12 | 0.0358 | 23.6 | 3.0 |
| New energy output fluctuation scenario | 94.67 | 0.0335 | 24.5 | 3.1 | |
| Grid disturbance scenario | 94.77 | 0.0335 | 25.0 | 3.2 | |
| PPO | Peak load scenario | 95.98 | 0.0275 | 34.9 | 4.7 |
| New energy output fluctuation scenario | 96.32 | 0.0261 | 35.6 | 4.8 | |
| Grid disturbance scenario | 96.47 | 0.0261 | 36.6 | 4.9 | |
| AGA | Peak load scenario | 93.76 | 0.0428 | 28.3 | 3.5 |
| New energy output fluctuation scenario | 94.12 | 0.0395 | 29.1 | 3.6 | |
| Grid disturbance scenario | 94.25 | 0.0392 | 30.4 | 3.7 | |
| DQN | Peak load scenario | 95.24 | 0.0316 | 32.7 | 4.2 |
| New energy output fluctuation scenario | 95.68 | 0.0293 | 33.5 | 4.3 | |
| Grid disturbance scenario | 95.81 | 0.0290 | 34.8 | 4.4 | |
| MAPPO | Peak load scenario | 98.56 | 0.0142 | 41.8 | 5.1 |
| New energy output fluctuation scenario | 98.73 | 0.0131 | 42.4 | 5.2 | |
| Grid disturbance scenario | 98.81 | 0.0131 | 43.3 | 5.3 |
In Table 2, MAPPO maintains its absolute advantage in core performance indicators in various scenarios and is more adaptable. The data integrity reaches 98.73% in the new energy output fluctuation scenario and 98.81% in the power grid disturbance scenario. Even in the power grid disturbance scenario, which is the most difficult data collection, it can still maintain nearly 99% integrity. This reflects the anti-interference ability of dual-link redundant transmission and precise preprocessing methods. The frequency deviation MAE is controlled between 0.0131–0.0142 Hz in the three types of scenarios, with a fluctuation amplitude of only 0.0011 Hz. Although the training convergence time and real-time evaluation delay are slightly higher than other lightweight models, they fluctuate less in various scenarios, and both meet the PFR control cycle requirements and will not affect the actual control effect.
3.2 Control Effect and Economic Analysis of PFR Optimization Strategy of Power Station
To verify the control effect and economy of the IPSO-based power station PFR strategy, three typical working conditions with load disturbance intensity of 0.1 pu, 0.2 pu, and 0.3 pu are selected to conduct comparative experiments. The comparison objects include PI control algorithm, classic PSO, and Genetic Algorithm (GA), which are widely used in PFR of power stations. The frequency regulation control effect directly determines the frequency stability of the power system, as shown in Table 3.
Table 3 Comparison of frequency regulation control effects of different algorithms
| Optimization | ||||||||||||
| Algorithm | PI | PSO | GA | IPSO | ||||||||
| Load Disturbance intensity (pu) | 0.1 | 0.2 | 0.3 | 0.1 | 0.2 | 0.3 | 0.1 | 0.2 | 0.3 | 0.1 | 0.2 | 0.3 |
| Lowest frequency (Hz) | 49.78 | 49.65 | 49.52 | 49.82 | 49.71 | 49.59 | 49.83 | 49.73 | 49.61 | 49.86 | 49.76 | 49.65 |
| Frequency recovery time (s) | 12.35 | 15.62 | 18.97 | 10.12 | 12.89 | 15.76 | 9.87 | 12.45 | 15.23 | 8.56 | 10.34 | 12.89 |
| Frequency overshoot (Hz) | 0.18 | 0.25 | 0.32 | 0.14 | 0.19 | 0.26 | 0.13 | 0.18 | 0.24 | 0.10 | 0.15 | 0.20 |
| Steady-state frequency deviation (Hz) | 0.042 | 0.058 | 0.073 | 0.035 | 0.046 | 0.059 | 0.033 | 0.043 | 0.056 | 0.021 | 0.030 | 0.041 |
In Table 3, IPSO shows the optimal frequency regulation control effect under various load disturbance intensities, especially in improving the lowest frequency point. When the load disturbance intensity is 0.1 pu, the lowest frequency point of IPSO is 49.86 Hz, which is 0.08 Hz higher than PI. IPSO also has significant advantages in frequency recovery time. The recovery time under 0.3 pu disturbance is only 12.89 s, and the frequency overshoot and steady-state frequency deviation are also minimal. This shows that this strategy can not only increase the lowest point of frequency, but also speed up frequency recovery, reduce fluctuation amplitude, and comprehensively improve the frequency stability of the power system.
Table 4 Economic comparison table of frequency regulation of different algorithms
| Optimization | ||||||||||||
| Algorithm | PI | PSO | GA | IPSO | ||||||||
| Load Disturbance intensity (pu) | 0.1 | 0.2 | 0.3 | 0.1 | 0.2 | 0.3 | 0.1 | 0.2 | 0.3 | 0.1 | 0.2 | 0.3 |
| Total cost of frequency regulation (Yuan /MWh) | 186.32 | 198.75 | 215.48 | 172.45 | 183.67 | 197.89 | 168.73 | 179.82 | 193.25 | 158.92 | 169.34 | 189.67 |
| Energy consumption per unit frequency regulation (kgce/MWh) | 12.56 | 13.42 | 14.35 | 11.89 | 12.63 | 13.48 | 11.56 | 12.31 | 13.15 | 10.87 | 11.54 | 12.32 |
| Energy storage charge and discharge loss (%) | 8.76 | 9.23 | 9.87 | 7.65 | 8.12 | 8.67 | 7.34 | 7.89 | 8.35 | 6.52 | 7.01 | 7.68 |
| Unit regulating loss (%) | 5.32 | 5.78 | 6.24 | 4.89 | 5.23 | 5.67 | 4.67 | 5.01 | 5.42 | 4.13 | 4.56 | 4.98 |
The economic index data in Table 4 show that IPSO has significant advantages in frequency regulation cost control, and the goal of reducing the total frequency regulation cost by 12.3% compared with the traditional solution has been fully achieved. Taking the load disturbance intensity of 0.2 pu as an example, the total frequency regulation cost of IPSO is 169.34 yuan/MWh. IPSO is superior to the comparison algorithm in terms of energy consumption per unit frequency regulation amount, energy storage charge and discharge loss, and unit adjustment loss. Under 0.2 pu disturbance, the energy consumption per unit frequency regulation amount is only 11.54 kgce/MWh, which comprehensively improves the economy of frequency regulation operation.
4 Conclusion
4.1 Research Outcomes
This study aims to solve the problems faced by power station PFR such as intensified frequency dynamic fluctuations, complex multi-power collaborative control, and unbalanced operating economy, and break through the limitations of traditional data acquisition and control strategies. The data integrity of the proposed data collection system reached 98.56%, 98.73%, and 98.81% under load peaks, new energy output fluctuations, and power grid disturbance scenarios, the missing data completion accuracy was 97.83%, and the outlier detection accuracy was 98.56%. The frequency deviation MAE of MAPPO was as low as 0.0131–0.0142 Hz, the RMSE was 0.0178 Hz, and the MaxAE was only 0.0196 Hz. Under the load disturbance of 0.1–0.3 pu, the lowest frequency point of IPSO was 0.08–0.13 Hz higher than that of the PI algorithm. The total cost of frequency regulation has been reduced by 12.3% on average, the energy consumption per unit of frequency regulation has been as low as 10.87 kgce/MWh, the energy storage charge and discharge loss has been as low as 6.52%, and the unit regulation loss has been as low as 4.13%. The constructed full-process solution significantly improves the accuracy, stability and economy of PFR.
4.2 Technical Implementation Challenges and Feasibility Suggestions
The actual implementation of the technical solution faces three core challenges: in terms of hardware deployment, edge computing nodes need to meet the requirements of real-time preprocessing of multiple sources of data and parallel algorithm execution, and should be equipped with 32-core CPUs, 40GB graphics memory, and 1TB or more high-speed storage devices. At the same time, data acquisition terminals need to support the IEC 61850-9-2 communication protocol. The hardware procurement and deployment costs are relatively high; in terms of computing resources, the MAPPO model training process requires approximately 80GB of memory, and a single complete training takes more than 40 minutes. In real-time scheduling scenarios, 50% of computing redundancy needs to be reserved to cope with load fluctuations; in terms of interface compatibility, most existing power grid control systems are based on traditional SCADA architectures, and there are risks of protocol adaptation and latency in real-time data interaction with the edge cloud collaboration mode. Moreover, the output instructions of the frequency regulation strategy need to be accessed through secondary development and connected to the existing controller control channel.
To address these challenges, feasible suggestions are proposed: the hardware configuration adopts a “graded deployment” mode, with core nodes of provincial power stations equipped with high-performance servers, and low-cost industrial-grade hardware selected for distributed acquisition terminals, balancing performance and cost; in terms of computing resources optimization, model lightweighting and offline pre-training combined with online fine-tuning are adopted to compress the real-time inference time to within 5 ms, reducing the reliance on on-site computing resources; in terms of interface compatibility, an IEC 61850 and existing SCADA system protocol conversion module is developed, an independent secure communication link is established, and standardized API interfaces are reserved to support two-way data interaction with the power grid dispatching center, ensuring compatibility with existing systems and control security.
4.3 Research Limitations
However, when the power type exceeds the 6th category, the dimension of the multi-agent state space increases exponentially, causing the training convergence time of MAPPO to be prolonged by 20%–30%, the real-time evaluation delay to potentially exceed 10 ms, the frequency response threshold, and the performance to decrease as the system complexity increases. The adaptive rule of IPSO parameters is only applicable to provincial-level integrated energy power stations. When applied to distributed microgrids below 110 kV, the optimization accuracy may decrease by 10%–15%. The study focuses on the one-time frequency regulation scenarios of provincial-level and above voltage-level integrated energy power stations with applicable power types 6 categories, load fluctuations 5%, and new energy penetration rate 40%. A synchronous data acquisition system with a sampling frequency of 50 Hz is required. In the future, state space dimension reduction technology can be introduced to optimize the training efficiency of complex scenarios, a cross-voltage-level parameter adaptive rule library can be constructed to expand applicability, and digital twin technology can be combined to enhance the robustness and scene adaptability of the method.
Funding
This research is supported by the Three Gorges Jinsha River Yunchuan Hydropower Development Co., Ltd, Liquan Wudongde Power Plant [No: 5225020003].
References
[1] Zhang J, Wang Y, Zhou G, Wang L, Li B, Li K. Integrating physical and data-driven system frequency response modelling for wind-PV-thermal power systems[J]. IEEE Transactions on Power Systems, 2023, 39(1): 217–228. DOI:10.1109/TPWRS.2023.3242832.
[2] Zhang Z, Kou P, Zhang Y, Liang D. Coordinated predictive control of offshore DC collection grid and wind turbines for frequency response: A scheme without secondary frequency drop[J]. IEEE Transactions on Sustainable Energy, 2023, 14(3): 1488–1503. DOI:10.1109/TSTE.2023.3236721.
[3] Demirci H E, Jalbi S, Bhattacharya S. Liquefaction effects on the fundamental frequency of monopile supported offshore wind turbines (OWTs)[J]. Bulletin of Earthquake Engineering, 2022, 20(7): 3359–3384. DOI:10.1007/s10518-022-01360-9.
[4] Pourbeik P, Sanchez-Gasca J J, Senthil J, Weber J, Zadkhast P, Ramasubramanian D, et al. A generic model for inertia-based fast frequency response of wind turbines and other positive-sequence dynamic models for renewable energy systems[J]. IEEE Transactions on Energy Conversion, 2023, 39(1): 425–434. DOI:10.1109/TEC.2023.3315058.
[5] Yang X, Yang L, Xiao X, Wang Y. A novel detection method for supersynchronous resonance from synchrophasor data[J]. IEEE Transactions on Power Systems, 2022, 38(4): 3694–3706. DOI:10.1109/TPWRS.2022.3200593.
[6] Wei M, Shi F, Zhang H, Chen W. Wideband synchronous measurement-based detection and location of high impedance fault for resonant distribution systems with integration of DERs[J]. IEEE Transactions on Smart Grid, 2022, 14(2): 1117–1134. DOI:10.1109/TSG.2022.3199781.
[7] Liang Y, Zhao X, Sun L. A multiagent reinforcement learning approach for wind farm frequency control[J]. IEEE Transactions on Industrial Informatics, 2022, 19(2): 1725–1734. DOI:10.1109/TII.2022.3182328.
[8] Yang F, Huang D H, Li D, Lin S, Muyeen S M, Zhai H. Data-driven load frequency control based on multi-agent reinforcement learning with attention mechanism[J]. IEEE Transactions on Power Systems, 2022, 38(6): 5560–5569. DOI:10.1109/TPWRS.2022.3223255.
[9] Li J, Yang S, Yu T. Data-driven cooperative load frequency control method for microgrids using effective exploration-distributed multi-agent deep reinforcement learning[J]. IET renewable power generation, 2022, 16(4): 655–670. DOI:10.1049/rpg2.12323.
[10] Wu Q, Li G, Liu M, Zhang Y, Yan J, Deguchi Y. The Enhancement of Primary Frequency Regulation Ability of Combined Water and Power Plant Based on Nuclear Energy: Dynamic Modelling and Control Strategy Optimization[J]. Energy, 2024, 313(Dev.30):133721.1–133721.16. DOI:10.1016/j.energy.2024.133721.
[11] Wang B, Zhu S, Cai G, Yang D, Chen Z, Ma J, et al. Sparse measurement-based modelling low-order dynamics for primary frequency regulation[J]. IEEE Transactions on Power Systems, 2023, 39(1): 681–692. DOI:10.1109/tcomm.2023.3274145.
[12] Kim J K, Kang J, Shim J W, Kim H, Shin J, Kang C, et al. Dynamic performance modeling and analysis of power grids with high levels of stochastic and power electronic interfaced resources[J]. Proceedings of the IEEE, 2023, 111(7): 854–872. DOI:10.1109/JPROC.2023.3284890.
[13] Nguyen H T, Choi D H. Three-stage inverter-based peak shaving and Volt-VAR control in active distribution networks using online safe deep reinforcement learning[J]. IEEE Transactions on Smart Grid, 2022, 13(4): 3266–3277. DOI:10.1109/TSG.2022.3166192.
[14] Shuai H, She B, Wang J, Li F. Safe reinforcement learning for grid-forming inverter based frequency regulation with stability guarantee[J]. Journal of Modern Power Systems and Clean Energy, 2024, 13(1): 79–86. DOI:10.35833/MPCE.2023.000882.
[15] Zhang M, Guo G, Magnússon S, Pilawa-Podgurski R C, Xu Q. Data driven decentralized control of inverter based renewable energy sources using safe guaranteed multi-agent deep reinforcement learning[J]. IEEE Transactions on Sustainable Energy, 2023, 15(2): 1288–1299. DOI:10.1109/TSTE.2023.3341632.
[16] Liu Q, Guo Y, Deng L, Liu H, Li D, Sun H, et al. Two-critic deep reinforcement learning for inverter-based volt-var control in active distribution networks[J]. IEEE Transactions on Sustainable Energy, 2024, 15(3): 1768–1781. DOI:10.1109/TSTE.2024.3376369.
[17] Dev A, Mondal B, Verma V K, Kumar V. Teaching Learning Optimization-Based Sliding Mode Control for Frequency Regulation in Microgrid[J]. Electrical Engineering, 2024, 106(6):7009–7021. DOI:10.1007/s00202-024-02422-8.
[18] Ma L, Hui H, Song Y. Data Valuation-Aware Coordinated Optimization of Power-Communication Coupled Networks Considering Hybrid Ancillary Services[J]. IEEE Transactions on Smart Grid, 2025, 16(1):568–581. DOI:10.1109/TSG.2024.3409814.
[19] Baral K K, Nayak P C, Mohanty B, Barisal A K. Improved Frequency Regulation of Dual-Area Hybrid Power System with the Influence of Energy Storage Devices[J]. Electrical Engineering, 2025, 107(3):3511–3532. DOI:10.1007/s00202-024-02670-8.
[20] Yang Q, Yan L, Chen X, Chen Y, Wen J. A distributed dynamic inertia-droop control strategy based on multi-agent deep reinforcement learning for multiple paralleled VSGs[J]. IEEE Transactions on Power Systems, 2022, 38(6): 5598–5612. DOI:10.1109/TPEL.2023.3286839.
[21] Chen P, Liu S, Chen B, Yu L. Multi-agent reinforcement learning for decentralized resilient secondary control of energy storage systems against DoS attacks[J]. IEEE Transactions on Smart Grid, 2022, 13(3): 1739–1750. DOI:10.1109/TSG.2022.3142087.
[22] Zhao Y, Zhong H, Lim C C. Safety-constrained multi-agent reinforcement learning for power quality control in distributed renewable energy networks[J]. Comput Mater Contin, 2024, 79(1): 449–471. DOI:10.32604/cmc.2024.048771.
[23] Bounar A, Boubertakh H, Arbid M. A coordinated optimization strategy for energy management of hybrid electric vehicle fleets[J]. Journal of Control, Automation and Electrical Systems, 2025, 36(2): 300–311. DOI:10.1007/s40313-025-01148-7.
[24] Qiu L. Multi-agent reinforcement learning for coordinated smart grid and building energy management across urban communities[J]. Computer Life, 2025, 13(3): 8–15. DOI:10.54097/3veq6255.
[25] Doskenov B, Okuyelu O. Advancing production systems with online reinforcement learning: real-time monitoring, control, and optimization[J]. Current Journal of Applied Science and Technology, 2025, 44(2): 1–22. DOI:10.9734/cjast/2025/v44i24480.
Biographies

Tianxiong Huang, born in April 1990, male, graduated from the School of Hydroelectric and Digital Engineering at Huazhong University of Science and Technology with a Bachelor’s degree in Water Resources and Hydropower. After graduation, I worked as an engineer at the Wudongde Hydroelectric Power Plant of China Yangtze Power Co., Ltd. My current research direction is engaged in the automation and intelligence of hydropower.

Zhongming Dong (December 1975–), male, graduated from the School of Water Resources and Hydropower Engineering at Sichuan University with a Bachelor’s degree in Water Resources and Hydropower Power Engineering. After graduation, I worked as a senior engineer at the Wudongde Hydroelectric Power Plant of China Yangtze Power Co., Ltd. My current research direction is engaged in the management of power plant machinery and hydraulic technology.

Chuhui Li, born in December 1983, male, graduated from the School of Hydroelectric and Digital Engineering at Huazhong University of Science and Technology with a master’s degree in Water Resources and Hydropower Engineering. After graduation, I worked as a senior engineer at the Wudongde Hydroelectric Power Plant of China Yangtze Power Co., Ltd. My current research direction is engaged in the automation and intelligence of hydropower.

Yinchuan Liang (February 1994–), male, graduated from Huazhong University of Science and Technology with a Bachelor’s degree in Electrical Engineering and Automation. After graduation, I worked as an engineer at the Wudongde Hydroelectric Power Plant of China Yangtze Power Co., Ltd. My current research direction is engaged in the automation and intelligence of hydropower.
Distributed Generation & Alternative Energy Journal, Vol. 41_3, 545–574
doi: 10.13052/dgaej2156-3306.4133
© 2026 River Publishers