Optimal Scheduling of Electric Vehicle Charging and Discharging in Microgrids: Analysis of the Impact on Energy Loss and Efficiency of Distribution Systems
Anjiang Liu*, Youzhuo Zheng, Di Weng, Hengrong Zhang and Xinhao Li
Electric Power Research Institute, Guizhou Power Grid Co., Ltd, Guiyang, 550002, China
E-mail: anjiang5615@outlook.com; rty1234892@163.com; gl127390@163.com; Wd21588@126.com; hq8899772@163.com; hcd121588@163.com
*Corresponding Author
Received 21 January 2026; Accepted 23 February 2026
Abstract
The current trends in electric vehicle adoption in distribution networks have brought some positives into microgrid operations. EVs can reduce greenhouse gas emissions down and create a more flexible source of energy by using V2G technology; however, uncontrolled charging of these vehicles is likely to incur losses in energy, fluctuations in voltage, and reduced efficiency to the system in total. This research proposes an optimal scheduling framework for the charging/discharging of EVs understandably connected to distribution systems embedded in microgrids. Analysis and classification of forecasted EV charging will be done based on charging data obtained from Kaggle; the charging behaviors will be classified into peak/off-peak utilization and flexible/inflexible groups, wherein energy losses are minimized, and distribution system efficiency is maximized through a multi-objective optimization model with realistic operating conditions. Simulation results on the IEEE 33-bus and 69-bus test systems demonstrate that with suitable coordination of scheduling, energy loss is reduced up to , voltage stability is ensured, green energy is utilized maximally, and load relief during the peak period takes place. The results from this study highlight how smart scheduling of EVs could enhance smart grid performance in the future concerning the technology, economic, and environmental aspects.
Keywords: Electric vehicles, vehicle-to-grid, microgrid, optimal scheduling, energy loss reduction, distribution system efficiency, renewable energy integration, peak load shaving.
1 Introduction
Electric vehicles (EVs) with their rapid growth have caused a transformation in power systems that are considered modern, especially in distribution [1]. It has now become a consensus that electric cars are a viable green substitute for gasoline and diesel cars. The major factors that led to this transition are concerns related to the emission of greenhouse gases, the depletion of fossil fuels, and global warming [2]. Microgrids powered by renewable sources are acknowledged as a good solution for the distribution system because of their advantages of reliability, flexibility and efficiency [3]. But in-large-scale-EV-integration brings operational problems in terms of power loss, voltage stability and the entire system’s efficiency which are the reasons why scheduling of power discharge and charging is very much observed as a critical field of research [4].
The unregulated charging behavior of electric vehicle users combined with microgrid power source fluctuations from wind or solar energy makes it necessary to have the best possible coordination for charging and discharging of EV [5]. If EVs are allowed to charge at their times during peak hours, the distribution system through which they get electricity will have a lower voltage, suffer from transformer overheating, and lose more electricity [6]. Besides, the rise of distributed generation and the two-way power flow made possible by vehicle-to-grid technology have resulted in more complex systems [7]. All these factors cry out for high technologybased scheduling and optimization methods for the regulation and coordination of these microgrid-EV interactions [8].
The best timing for charging and discharging electric vehicles brings a lot of advantages to the microgrid and distribution system’s operational performance [9]. Well-coordinated EVs can bring about total energy losses reduction, excellence in system efficiency, peak load shaving support and voltage profiles improvement [10]. Describing EVs as flexible energy storage devices, the implication refers not only to the incorporation of renewable energy sources but also to enhancing system reliability [11]. First of all, from the economic and environmental point of view, efficient scheduling is a factor that has a great contribution to the reduction of operational costs, the ascendency of the asset utilization and the decrease of carbon emissions [12]. Thus making scheduling to be a matter of great importance in both academic research and practical power system applications [13].
Although numerous existing studies on EV charging coordination primarily focus on cost minimization and peak load reduction, relatively limited attention has been given to the simultaneous improvement of distribution network efficiency and energy loss minimization under coordinated EV-microgrid operation. Cost-oriented approaches typically optimize electricity pricing benefits, while peak load-based methods concentrate on demand smoothing or peak shaving. In contrast, the present study emphasizes a multi-objective framework that integrates energy loss minimization, efficiency enhancement, and electrical feasibility constraints within a unified optimization model. By embedding power flow analysis within the scheduling process and considering operational network limits, the proposed approach advances beyond conventional cost- or peak-driven strategies and provides a technically consistent and system-oriented EV coordination mechanism.
The present research, focusing on the primary goals of minimizing energy losses, and improving system performance, proposes an optimal scheduling framework for the charging and discharging of electric vehicles in microgrid-connected distribution systems to deal with the existing problems [14]. This study not only considers the network-level performance but also inputs traditional metrics like cost and peak reduction into the optimization process. EV charging data enables the proposed approach to show greater loss reduction and efficiency under various operating conditions, thus presenting today’s limitations in EV-connected microgrid operation with a more thorough and workable solution.
1.1 Problem Statement
The integration of electric vehicles (EVs) is becoming more frequent in microgrid-based distribution systems, and this raises the issue of uncoordinated charging and discharging behavior Senapati et al. [15]. On the one hand, such an uncontrolled EV charging can cause a number of negative consequences like increased energy losses, voltage variations, amplification of Lee et al. [16]. enabled by vehicle-to-grid technology can help EVs to operate more in line with the grid through power flow in both directions Mojumder et al. [17]; however, improper scheduling is likely to cause an even greater case of network stress and to decrease reliability. Most of the current research has been concentrating on cost minimization or peak load reduction and have disregarded the combined effect of EV scheduling on distribution system energy losses and efficiency Usman et al. [18]. Thus there is an utmost need for an optimal scheduling framework that will intelligently coordinate EV charging and discharging in microgrid environments, such that energy losses are minimized and operational efficiency of distribution systems is enhanced under the most realistic possible operating conditions Shokouhmand and Ghasemi [19].
1.2 Objectives
• Analyze real-world electric vehicle charging data will be analyzed in order to recognize charging behavior patterns that reflect the peak/off-peak periods and flexible/inflexible characteristics of the charging.
• Develop multi-objective optimization framework will be established that involves coordinated electric vehicle charging and discharging in microgrid-based distribution systems considering the most realistic operating constraints.
• Minimize the entire energy losses in the distribution network to the least possible level while at the same time increasing the efficiency of the entire system through proper EV scheduling and vehicle-to-grid operation.
• Evaluate the effects of the new scheduling method on voltage stability, peak load reduction, and renewable energy utilization with the use of IEEE 33-bus and 69-bus test systems.
2 Literature Survey
Hadian et al. [20] propose a mixture-based method for the excellent EVA design of charging stations for electric vehicles that utilizes Mult Objective Particle Swarm Optimisation combined with sequential Monte Carlo simulation. This technique is directed towards flattening the load curve, power efficiencies improvement, and reduction in power losses. The model also contains an allocation strategy which encompasses both administrative and residential EVCSs, optimally sharing profits between distribution system operators and EVCS owners, aside from different charging strategies. This entire process takes place on an IEEE 69-bus network and has yielded rather promising results.
A pair of microgrid models facilitating the installation of EV charging points in decentralized systems have been introduced by Preusser and Schmeink [21]. Incorporating energy storage systems, power trade with the main grid and distributed energy resources, the models’ structures are built. Moreover, notwithstanding the costs of DER, they utilize real-time data and reinforcement learning to optimize computing, lighten the main grid, and secure profit and customer satisfaction.
The article by Shang et al. [22] illuminates the path towards the application of V2G technology for EVs incorporation into distribution networks that are lossless and at the same time, supporting the grid. The authors suggest two methods: Active Power Distribution for good management of charging/discharging, and Reactive Power Distribution for sophisticated measuring of reactive power injection.
Zou et al. [23] stated that one of the main techniques to reduce the voltage drop in the distribution network is to implement a proper scheduling strategy for the electric vehicles charging and discharging. Their approach is quite innovative and it considers not only the EVs penetration but also the concurrent load rates so as to schedule the charging and to utilise the distribution capacity. The optimal dispatch model, for its part, minimizes costs by saving the network’s investments, securing its operation, and controlling the fluctuations in load.
Rasheed et al. [24] propose a measure to control the electric vehicle charging loads in various regions by the use of price-driven demand response strategy. The authors try to the framework that uses dynamic, nondiscriminatory and individual-consumption-pattern-determined prices to reach the goal of reducing costs, peak load and utility revenue. To optimize the method, a genetic algorithm is applied which thus ensures a proper cost distribution and high user contentment while keeping the utility’s profit unaffected.
Ahmadi et al. [25] tackle the problem of the best placement of electric vehicle parking lots as well as their timeslotting in smart distribution grids by taking into account not only the technical factors but also the economic ones. Their approach for optimization is a hybrid metaheuristic algorithm, and through simulation on the IEEE 69-bus system, they demonstrated better voltage profiles and lower network losses.
A multi-agent system for energy scheduling and trading at electric vehicle charging stations considering mobility and grid restrictions, is presented by Affolabi et al. [26]. Each EVCS sets up its activities by employing a modified auction mechanism and a traffic assignment problem to reach the most optimal energy use. The solution to the energy management and trading problem at EVCSs was obtained through a mixed-integer second-order cone programming approach and validated by simulations carried out on an IEEE 33-bus system.
Yue et al. [27] propose a new approach through the application of a multi-timescale scheduling strategy. The method, which works by classifying EVs into groups according to their projected charging times and instantaneous data, results in the reduction of both the grid load fluctuations and the need for complex scheduling. The results from the simulations show that the new method can be applied successfully to the largescale EV scheduling process with extremely quick solution times and with better load management.
The study of Habib et al. [28] deals with carbon dioxide emissions through eco-directing (ED). An integrated optimization model was proposed that utilized the installation of electric vehicles with vehicle-to-grid technology to reduce operating costs, pollution, and carbon dioxide emissions. The artificial bee colony algorithms were able to minimize costs more effectively than particle swarm optimization, especially for largescale electric vehicle deployment (700 EVs), according to the evidence.
Savita et al. [29] show that in the case of a partially renewable energy-powered grid along with the participation of electric vehicles, load management performs best. They come up with a priority-based V2G scheduling approach and employ the Opposition-based Competitive Swarm Optimiser to attain a decrease in load variability of .
Musham and Hemnath [30] proposes a hybrid RRT and A* framework for real-time IoT-enabled autonomous vehicle path planning, improving energy efficiency and travel time. Inspired by this exploration-optimization integration, the proposed method adopts a similar hybrid strategy to enhance scalability, efficiency, and adaptability.
A breakthrough multi-objective optimisation approach for the effective and efficient controlling networks is proposed by Chen et al. [31]. The aim is to attain three-fold benefits at a time, to maximize solar energy exploitation, minimize load differences and cut down costs. The union of the NSGAII-NDAX algorithm with Monte Carlo sampling has been validated as a successful method for decreasing peak load variances and enhancing the entire system’s performance via the simulation outcomes.
3 Methodology
Real-world electric vehicle charging data collection from Kaggle is the first activity in the methodology of this study, and it is followed by preprocessing stages like data cleaning, outlier removal, time-series resampling, and feature normalization so as to accurate the data. Charging behavior is examined through session classification as peak/off-peak and flexible/inflexible. The microgrid model that is built on the IEEE test systems incorporates V2G technology along with decentralized power assets. As a result, the end purpose is a multi-objective optimization framework, which is shown in Figure 1, that will cut down on energy loss in power distribution and at the same time improve the distribution system’s efficiency.
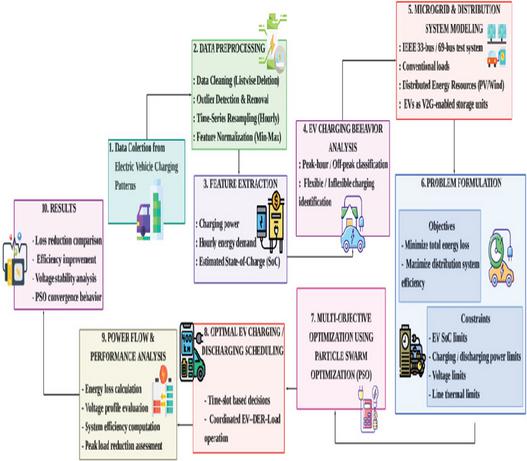
Figure 1 Workflow diagram.
3.1 Data Collection
This research utilizes a public Kaggle dataset named Electric Vehicle Charging Patterns. It consists of authentic records of EV charging sessions, which contain details on the charging times, the duration, energy consumed, battery size, and power ratings of the chargers. These data clearly indicate how the real EV users acted during different periods and different situations. The dataset hence can be considered a reliable source for modeling EV charging demand, analyzing load variations, and finding the best charging and discharging schedules in microgrid-based distribution systems.
The dataset includes EV charging sessions recorded across multiple time periods, covering both peak and offpeak demand intervals to ensure temporal representativeness. The charging profiles reflect realistic variations in distribution system loading conditions, including periods of high demand and reduced network stress. This temporal diversity enables comprehensive evaluation of the coordinated scheduling framework under practical operating scenarios and ensures that the optimization results are aligned with actual microgrid-based distribution network conditions.
3.2 Data Preprocessing
The preprocessed dataset establishes a structured foundation for feature extraction and subsequent behavioural classification within the coordinated EV scheduling framework.
The actual analysis that the collected dataset was pre-processed thoroughly through several stages in order to secure the quality as well as the consistency of the data. First off, any missing or incomplete records were expunged and the extreme values in terms of charging duration as well as energy consumption were eliminated based on the pre-set limits. Then, the time-stamped data were converted into hourly intervals, which corresponded with the microgrid’s scheduling horizon. In the course of modeling EV state-of-charge dynamics, related parameters were excluded, and the properties of charging power and energy demand were changed so that they had a common scale. The pre-treatment actions not only elevated the precision but also the trustworthiness of the subsequent optimization and efficiency analyses.
3.3 Data Cleaning
The primary reason for data cleaning is to make sure the EV charging dataset is suitable and consistent for analysis. In this study, the listwise deletion approach is employed to eliminate those records where the essential attributes like beginning and ending times of charging, energy consumed, and battery capacity have missing, incomplete, or inconsistent values. All the charging sessions that have at least one field of the required information missing are excluded from further data analysis. This method ensures that only complete and valid charging records are retained, thus bias or error in the results obtained from the optimization and load modeling processes is completely ruled out. Listwise deletion, although it reduces the dataset size, on the other hand, increases the overall data integrity and computational robustness.
Let the original dataset be represented as shown in Equation (1).
| (1) |
The format of each record is provided in shown in Equation (2).
| (2) |
A cleaned dataset is obtained using listwise deletion shown in Equation (3).
| (3) |
Here, charging start and end times; energy consumed; battery capacity; charger power rating.
3.4 Outlier Detection and Removal
Outlier detection removes from the dataset those charging records that are unrealistic and fall outside the physical and operational boundaries of the EV charging systems. A threshold-based statistical filtering method is applied in this case, and the upper and lower limits are established according to the power ratings of chargers, battery capacity, and possible charging durations. Charging sessions that exceed these pre-specified limits are identified as outliers and, consequently, removed from the dataset. The whole procedure guarantees that abnormal values do not interfere with load modeling and also that the optimization algorithm works on charging data that are physically possible.
Let the energy consumed during a charging session be represented shown in Equation (4).
| (4) |
Here, energy consumed; charger power rating; charging duration.
The feasible energy consumption range is defined shown in Equation (5).
| (5) |
and the feasible charging duration range is shown in Equation (6).
| (6) |
A charging record is retained if it satisfies shown in Equation (7).
| (7) |
Otherwise, the record is classified as an outlier shown in Equation (8).
| (8) |
Here, battery capacity of the EV (kWh).
3.5 Time-Series Resampling
Time-series resampling is applied to change non-uniform EV charging time stamps to regular fixed time intervals that are compatible with microgrid scheduling and optimization. In the current research, the time aggregation (hourly discretization) method is used where scheduling data recorded at random start and end times are projected into standard one-hour time periods. The EV load profile is illustrated by summing the energy and power requirements for charging each hour. The electric vehicle charging, microgrid operation, and power flow simulation needs are beautifully harmonized by the method, thereby leading to precise optimization and performance measurement.
Let a charging session span from time to with charging power . The energy contributed by session during hour is given by shown in Equation (9).
| (9) |
Here, duration (in hours) of session falling within hour .
The total EV energy demand in hour is shown in Equation (10).
| (10) |
The corresponding aggregated EV charging power for hour is shown in Equation (11).
| (11) |
Here, hour.
Charging sessions that span across multiple hourly intervals are proportionally allocated based on the exact duration of overlap within each respective hour. For a session starting in one hour and ending in another, the charging power is distributed according to the fractional time contribution in each hourly segment. This proportional allocation ensures that partial-hour charging is accurately represented within successive time intervals. During data aggregation, strict energy conservation is maintained by verifying that the summation of all hourly allocated energies equals the total original session energy (). This approach guarantees consistency between the raw charging records and the resampled hourly load profile, thereby preserving both physical accuracy and computational reliability.
3.6 Feature Normalization
Feature normalization, which is a method used to bring all the numeric variables into a common range, is one of the ways to improve the optimization algorithm’s numerical stability and convergence performance, hence making it easier to work with. In this research, the electric vehicle charging power and energy usage were subjected to Min-Max normalisation technique which resulted in all the characteristics being within the designated fixed range of 0 to 1. This avoids the case where the optimization process is completely controlled by the variables having the largest values and allows for equal input feature contribution. Normalization boosts computational efficiency and guarantees the consistent performance of the optimal scheduling framework proposed.
For a given feature , the normalized value is calculated as shown in Equation (12).
| (12) |
Here original feature value; minimum value of the feature maximum value of the feature.
The normalized feature satisfies shown in Equation (13).
| (13) |
The Min-Max normalization parameters (min and max) are computed globally based on the complete preprocessed dataset rather than on a scenario-specific basis. This global scaling approach ensures that all simulation cases are evaluated under a consistent numerical reference framework. By maintaining fixed normalization bounds across different scenarios, variations in optimization results are attributed solely to system and scheduling differences rather than to scaling inconsistencies. Furthermore, the same normalization parameters are preserved throughout all iterations of the multi-objective optimization process to guarantee numerical stability, fair comparative assessment, and reproducibility across diverse simulation conditions.
Min-Max normalization was applied to scale all input features to a uniform range, thereby preventing highmagnitude variables from disproportionately influencing the multi-objective optimization process. By ensuring that charging demand, state-of-charge, load levels, and other scheduling variables are comparably weighted, normalization promotes balanced feature contribution within the objective function. This scaling approach also enhances numerical stability during iterative PSO execution by reducing computational bias, preventing gradient imbalance, and supporting stable convergence behavior across iterations.
3.7 Feature Extraction
The preprocessed EV charging dataset is subjected to feature extraction to obtain the necessary variables for optimization and system analysis that have meaningful interpretation. A rule-based feature engineering method is applied in this research, wherein domain-specific rules grounding on EV charging physics and operational constraints are employed to ascertain the important variables. The features extracted consist of charging power, hourly energy demand, and estimated state-of-charge. Moreover, their adoption is in line with actual EV usage and provides a physical basis for interpretation.
1. The charging power is represented as shown in Equation (14).
| (14) |
Here, charging power of EV energy consumed during the charging session (kWh); charging duration.
2. The energy demand per time slot is represented as shown in Equation (15).
| (15) |
Here, energy consumed by EV during hour ; total EV energy demand in time slot .
3. The estimated state-of-charge (SoC) is represented shown in Equation (16).
| (16) |
Here, state-of-charge of EV at time ; charging efficiency; charging power at time ; time interval; battery capacity (kWh).
The extracted charging and state-of-charge features are utilized to classify EV behavioural patterns, which directly influence the optimization strategy.
3.8 EV Charging Behavior Analysis
The researchers analyze the electric vehicle charging behavior in order to understand the daily charging patterns and their effect on the microgrid operation. The research evaluates EV charging sessions based on the distribution system load profile and the pre-defined time-of-use periods, and then categorizes them as peak hour and non-peak charging sessions. Moreover, the charging times are categorized as flexible or inflexible based on the energy need, the time of arrival, and the time of departure. This classification of behavior helps the optimization framework in making informed scheduling decisions by shifting flexible charging loads to lowdemand periods, thus reducing peak stress, energy losses, and improving overall system efficiency.
3.8.1 Classification of EV charging sessions into peak-hour and off-peak charging
The principal aim of this study is to implement a rule-based time-of-use strategy for session categorization in order to analyze the time-related charging behavior and its effect on the power distribution network. Charging sessions for electric vehicles can be classified into two categories. The electric vehicle charging sessions are split into two categories: peak-hour and off-peak. Charging sessions that occur during the defined peak demand periods are identified as peak-hour charging, while those that occur during the low-demand periods are identified as off-peak charging. This classification is important as it reveals the areas where the loads are concentrated and it also helps in scheduling properly by releasing flexible charging loads during peak hours which leads to energy losses being reduced and overall system efficiency being increased.
Let represent the charging start time of .
Define the peak-hour time set as shown in Equation (17).
| (17) |
The charging session is classified as shown in Equation (18).
| (18) |
Here, start and end times of peak-load periods.
3.8.2 Identification of flexible and inflexible EV charging patterns
Flexible and inflexible charging patterns are identified to determine the extent to which EV charging sessions can be rescheduled without violating user requirements. In this research, charging flexibility is assessed by taking into account the time period between the EV’s arrival and departure and the required energy demand. A charging session is deemed flexible if the available connection time is longer than the minimum charging time needed and can be rescheduled to non-peak periods. On the other hand, sessions that allow only minimal time for charging are regarded as rigid, thus necessitating immediate charging. This categorization is incorporated in the overall procedure that helps to make the most suitable scheduling decisions by prioritizing flexible loads for reduction of losses and enhancement of efficiency.
The minimum required charging time is shown in Equation (19).
| (19) |
The available connection time is shown in Equation (20).
| (20) |
The charging flexibility condition is defined as shown in Equation (21).
| (21) |
Let, arrival time of EV ; departure time of EV ; required energy demand (kWh); maximum charging power (kW).
The proportion of flexible and inflexible charging sessions significantly influences the effectiveness of load shifting and overall system performance. A higher share of flexible sessions enhances the optimization algorithm’s ability to redistribute charging demand toward off-peak periods, thereby improving peak load mitigation, reducing energy losses, and increasing operational efficiency. In contrast, a larger proportion of inflexible sessions constrains scheduling adaptability and limits achievable optimization gains. Across simulated scenarios, the balance between flexible and inflexible sessions directly affects system responsiveness, voltage stability support, and the overall operational adaptability of the microgrid-based distribution network.
The classified charging behaviours are integrated into the microgrid modelling and optimization formulation to ensure realistic coordinated scheduling decisions.
3.9 Microgrid and Distribution System Modeling
A common radial distribution network is the IEEE 33-bus or IEEE 69-bus test system, which is used to exemplify the microgrid-connected distribution system. To mimic the real microgrid functioning, the model is composed of distributed energy resources which are photovoltaic and wind generation units, and conventional loads, together with a connection to the utility grid. The system considers the use of vehicle-to-grid technology to represent electric vehicles as controllable, bidirectional energy storage systems. That means the electric vehicles (EVs) could either take power from the grid or send back the stored power to the grid, based on their scheduling. The interconnected model provides the opportunity to investigate in detail the power flow, energy losses and efficiency for different situations of EV charging and discharging. The interconnected approach makes it possible to study power flow, energy losses and efficiency of a certain EV charging and discharging scenario to a large extent.
3.9.1 Modeling of a standard distribution test system
The research carries out an examination of the effect of electric vehicle charging and discharging on the performance of the network by using a standard radial distribution test system. The IEEE 33-bus or IEEE 69-bus distribution system is utilized as a reference model on the account of its popular acceptance in power system research. This configuration consists of one slack bus, a number of load buses, and distribution lines that are characterized by their resistance and reactance parameters shown in Equation (3.9.1). The internationally accepted modeling technique enables a consistent evaluation of power flow, voltage profiles, and energy losses for different operating conditions and, therefore, helps in making a just comparison with past studies.
| (22) |
The voltage magnitude at each bus is constrained as formulated in shown in Equation (23).
| (23) |
The active power loss of a line connecting bus i and bus j can be written for instance.shown in Equation (24).
| (24) |
Here, generated active and reactive power; load demand; voltage magnitude at bus ; line current; resistance of the line.
3.9.2 Distributed energy resources in system integration
DER like solar panels and wind power units are included in the microgrid to meet the sufficiency of the local load and to minimize the main grid dependence. These sources are linked at certain buses of the distribution network and represented as adjustable active power sources. Renewables are dispatched along with lesser power flow and thus energy losses in the distribution grid are indirectly reduced. Time-varying output profiles are adopted to allow changes in the availability of renewables and give a more realistic assessment of the performance of the system under varying operating conditions. The working expression for active power output of a DER unit located at bus at the time is shown in Equation (25).
| (25) |
Here, active power generated by DER; rated power capacity of the DER; availability factor .
The power balance equation at bus including DERs is given by shown in Equation (26).
| (26) |
3.9.3 EV models for bidirectional energy storage (V2G)
The research presents a scenario where electric vehicles are regarded as manageable, two-way energy storage systems via the vehicle-to-grid method allowing operations of both charging and discharging. During charging, the EVs take the microgrid power and return the stored power as per the battery condition and power limitations during discharging. The interaction occurring in both directions makes it possible to cut down on peak loads and losses while at the same time boosting the overall efficiency. Electric vehicles are so flexible that they can be integrated into the system demand and the distributed energy resources in the optimization framework very accurately.
The net power exchange between EV i and the grid at time t is given by shown in Equation (27).
| (27) |
The state-of-charge dynamics are expressed as shown in Equation (28).
| (28) |
Subject to the constraints shown in Equation (29).
| (29) |
Here, charging and discharging power; charging and discharging efficiencies; battery capacity.
The scalability of the proposed scheduling framework is ensured through its modular modelling structure and population-based optimization mechanism. When extended to larger electric vehicle fleets, the framework aggregates EVs into structured decision variables while preserving individual operational constraints, thereby maintaining computational tractability. The multi-objective PSO algorithm demonstrates stable convergence characteristics even with increased dimensionality, as particle interactions remain independent of fleet size growth. Furthermore, higher renewable penetration levels are accommodated through adaptive power balance constraints and time-series variability modelling, allowing the system to respond effectively to fluctuations in distributed generation. These characteristics confirm that the proposed approach remains computationally feasible and operationally robust under expanded fleet sizes and diverse renewable integration scenarios.
3.10 Problem Formulation
Optimal management of electric vehicle discharging and charging is addressed in the design of a microgrid as a multi-index optimization-based problem. In terms of these goals, the FIRST dimension, besides minimizing energy losses at the network, should maximize efficiency of the system under the time frame prescribed. These dual objectives would primarily achieve charging and discharging power management of electric vehicles, system load strategies, and coordination of dispersed energy resources. The optimization task includes, besides many others, constraints set by those policies restricting the level of state-of-charge of electric vehicle batteries, the upper limits of charging or discharging power, voltage level constraints for all buses, as well as thermal restrictions specified for distribution lines. This way of doing things ensures that the solution found is optimal enough not only in terms of performance but also practical operability and safety.
The proposed optimization framework is governed by three principal categories of operational constraints to ensure realistic and feasible scheduling outcomes. First, battery capacity constraints regulate the state-of-charge (SOC) limits, charging/discharging power bounds, and energy balance conditions of each electric vehicle. Second, network transmission constraints enforce distribution system limits, including power flow balance, voltage regulation boundaries, and feeder capacity restrictions. Third, scheduling time constraints incorporate EV arrival and departure times, ensuring that charging and discharging operations occur within available connection windows and predefined scheduling horizons. Together, these restrictions define the feasible solution space within which the multi-objective PSO algorithm determines coordinated charging and discharging strategies.
3.10.1 Minimization of total energy loss
In a microgrid-like distribution system, the main goal of efficient charging and discharging of electric cars is to decrease the total energy loss. The resistive losses in the distribution line are assumed to be the main source of energy loss. The EVs that are charged randomly will just experience higher currents, which will lead to greater power loss. Therefore, the power grid can be balanced, the peak load can be reduced, and the currents can be regulated by optimizing the charging and discharging of electric vehicles. This significantly enhances the reliability and operational efficiency of the distribution system.
The total active power loss in the distribution network over the scheduling horizon is defined as shown in Equation (30).
| (30) |
Here, total number of time intervals; set of distribution lines; current flowing through line connecting bus and at time ; resistance of the line.
Alternatively, energy loss over the scheduling horizon can be expressed as shown in Equation (31).
| (31) |
Here, total power loss at time ; duration of each time interval.
3.10.2 Maximization of distribution system efficiency
The capacity of the network to supply the loads with power almost entirely without any losses is what determines the system’s efficiency. Uncoordinated EV charging creates resistive losses and increases line currents, which in turn lowers efficiency. Properly coordinated with decentralized energy resources and demand, e-mobility gives rise to a balanced power flow, diminishing losses, and a larger share of the consumed energy being useful. This objective implies the better use of network infrastructure and the enhancement of overall system performance shown in Equations (33) and (34).
Distribution system efficiency over the scheduling horizon is defined as shown in Equation (32).
| (32) |
Here,
| (33) | ||
| (34) |
Here, total load demand at time ; total power loss at time ; duration of time interval.
3.10.3 Performance and operational constraints
The optimal scheduling problem is subjected to a collection of operational constraints whose main purpose is to assure the safe, reliable, and physically feasible operation of the system. The imposition of electric vehicle battery constraints is done through restricting the state-of-charge to be within certain minimum and maximum bounds that are predetermined, in this way, battery health is preserved and user requirements are fulfilled. The charge capacity limits determined by the size of batteries. In addition to this, network-level constraints are imposed by limiting the bus voltage magnitudes to the acceptable limits and making sure that the power flows in the lines do not surpass their thermal capacity. These constraints are such that the optimal solution meets both the EV operational requirements and the distribution system security standards.
EV state-of-charge limits
The setting of state-of-charge limits was primarily intended to protect electric vehicle batteries and accommodate user mobility. The range of SoC is defined for each EV battery in the proposed scheduling system to avoid deep discharge and overcharging, as these are the major factors contributing to battery life reduction. Hence, these limitations allow for a specific quantity of energy to be available in the vehicle at the time of departure. The optimization method by SoC limits ensures that the bi-directional charging and discharging activities are not only possible but also trustworthy.
The SoC dynamics for EV at time are shown in Equation (35).
| (35) |
Subject to the SoC bounds shown in Equation (36).
| (36) |
Here, state-of-charge of EV ; minimum and maximum allowable SoC; charging and discharging power; charging and discharging efficiencies; battery capacity; time interval.
Charging and discharging power limits
The restrictions on power charging and discharging have been set to guarantee that the electric vehicle operations remain, to a great extent, within the capabilities of the onboard chargers and battery systems. These limitations prevent charging or discharging rates from being so high that they cause thermal stress and thus reduce the lifespan of the battery or even go beyond the rating of the charger. The proposed scheduling framework enables safe and reliable two-way energy exchange with the microgrid by capping respective maximum values of charge and discharge power, per electric vehicle. Implementing these restrictions can also provide system stability and very close to real power flow conditions.
For at time are defined as shown in Equation (37).
| (37) |
To avoid simultaneous charging and discharging shown in Equation (38).
| (38) |
Here, charging power; discharging power; maximum allowable charging and discharging power.
Voltage and line capacity constraints
Safe and efficient functioning of the distribution network could be ensured by the imposition of voltage and line capacity constraints during EV charging and discharging. The current originates at the substation and heads to the loads through distribution cables along pathways whose thermal capacity is bound in a radial network. If EV charging or discharging becomes impossible to manage, it will be inevitable that the line currents will go over the maximum rated levels, and the bus voltages will also be pushed beyond the allowed limits.
The voltage magnitude at each bus must be shown in Equation (39).
| (39) |
Here, voltage magnitude at bus ; minimum and maximum allowable voltage limits.
The power flow or current in each distribution line connecting bus and must not exceed its thermal limit shown in Equation (40).
| (40) |
Here, line current; active power flow; maximum allowable line limits.
3.11 Optimization-Based Scheduling
The microgrid implemented a method for scheduling based on optimization which was directed at finding the most suitable times for charging and discharging of electric vehicles. PSO manages the multi-objective issue that is described by the gradual change of the EV charging and discharging options for each time interval shown in Figure 2. The algorithm unites the EV demand with the varying microgrid load demand and the patterns of distributed generation to maximize energy savings and enhance the overall system quality. The proposed scheduling approach comprises of the restrictions of EV batteries, limitations of the power network, and the changes in renewable generation as factors that guarantee the distribution system works efficiently and reliably across dynamic conditions.
The selection of Particle Swarm Optimization (PSO) is supported by its computational simplicity, fast convergence characteristics, and strong capability to handle nonlinear and constrained optimization problems. Compared with other techniques commonly reported in the literature, such as Genetic Algorithms (GA), Ant Colony Optimization (ACO), and Mixed-Integer Linear Programming (MILP), PSO requires fewer control parameters and involves lower computational complexity, making it suitable for large-scale and time-dependent scheduling problems. While GA and ACO rely on evolutionary operators that may increase computational burden, MILP formulations may become computationally intensive when addressing nonlinear system constraints. In contrast, PSO provides an efficient balance between exploration and exploitation, enabling effective convergence for coordinated EV charging and discharging scheduling under dynamic microgrid operating conditions. Therefore, PSO is considered an appropriate and computationally efficient optimization framework for the proposed study.
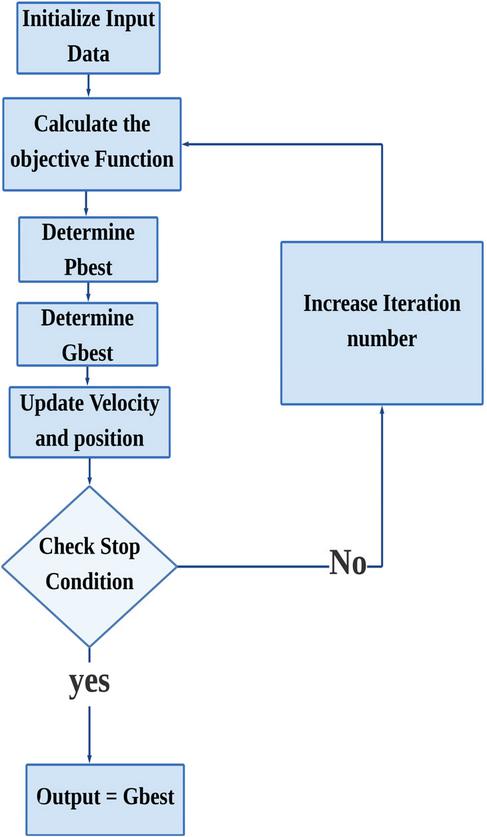
Figure 2 Particle swarm optimization flow chart.
3.11.1 Apply an particle swarm optimization
Due to the PSO Algorithm’s simplicity, fast convergence, and capability to handle nonlinear as well as constrained optimization problems efficiently, it was selected for the scheduling decision. The model proposed is composed of particles, where each particle stands for a possible solution of power values for the electric vehicles charging and discharging during the entire scheduling period. In the context of the PSO technique, particles are allowed to keep on changing their positions and velocities in sync with the global best solution as well as their personal best experiences. The PSO technique reaches the best scheduling solution by slowly but surely making changes that not only lower energy losses but also comply with the operational conditions and, therefore, the distribution system’s efficiency is improved.
The velocity and position updates of particle at iteration are shown in Equation (41).
| (41) |
In this equation, represents the position vector, denotes the velocity vector, pbest stands for the personal best solution of particle gbest is the global best solution, inertia weight, to cognitive and social acceleration coefficients respectively, and random numbers drawn from the interval .
The PSO parameters were selected to ensure stable convergence and computational efficiency for the coordinated EV charging and discharging scheduling problem. The inertia weight was adjusted to balance global exploration and local exploitation, while the cognitive and social acceleration coefficients were chosen to maintain equilibrium between individual and collective learning. The swarm size and maximum iteration limit were determined based on the dimensionality of the scheduling variables and required solution accuracy. The convergence behavior was evaluated using the fitness value trend across iterations. A rapid decrease in the fitness function during the initial iterations followed by stabilization confirms that the PSO algorithm efficiently converges to a near-optimal solution while satisfying operational and system constraints. During each iteration, constraint handling mechanisms were incorporated to ensure that particle updates satisfied state-of-charge limits, charging/discharging power bounds, and system operational constraints, thereby enabling effective coordinated EV scheduling.
The PSO parameter settings were explicitly defined to ensure reproducibility of the optimization results. The swarm size was set to 30 particles, and the maximum number of iterations was fixed at 100 based on convergence performance and computational efficiency considerations. The inertia weight was implemented using a linearly decreasing strategy, varying from 0.9 to 0.4 across iterations to promote global exploration during early stages and local exploitation near convergence. The cognitive and social acceleration coefficients were selected as and , providing a balanced influence between individual learning and collective swarm behavior. These parameter values were chosen based on commonly adopted PSO configurations reported in the literature and validated through preliminary simulation testing to ensure stable and consistent convergence behavior.
During each iteration of the PSO-based scheduling optimization, the updated charging and discharging power values of EVs are integrated into the distribution network model, and a power flow calculation is executed to evaluate system feasibility. Bus voltage magnitudes, line currents, and network power losses are computed using the formulated load flow equations. The obtained electrical parameters are then checked against operational constraints, including voltage limits, line capacity bounds, and power balance requirements. Solutions that violate electrical constraints are either penalized within the fitness function or adjusted through constrainthandling mechanisms to ensure feasibility. This integrated evaluation ensures that the optimized EV charging and discharging schedules remain electrically consistent with the physical limitations of the distribution system.
The optimization continues until a convergence criterion, such as maximum iterations or minimal improvement, is satisfied.
The convergence of the multi-objective PSO algorithm is governed by predefined stopping criteria to ensure computational efficiency and solution reliability. The optimization process terminates when either the maximum number of iterations is reached or when the improvement in objective function values between successive iterations falls below a predefined tolerance threshold. To evaluate convergence stability, multiple independent optimization runs were conducted under identical parameter settings. The consistency of final objective values across runs was examined to verify robustness and reproducibility. Furthermore, convergence behavior was monitored through iterative tracking of objective function evolution, ensuring stable solution attainment without oscillatory or premature convergence patterns.
3.11.2 Determination of optimal EV charging and discharging schedules
One could think that the optimization approach would work if it could recognize effectively both the charging and discharging events of electric vehicle charging. The algorithm takes a definitive position concerning the electric vehicle’s operational mode-charging, discharging, or completely off-and then assigns the respective power for each time slot. The evaluation takes into account the loss of the system, its efficiency, and operational constraints; therefore, the power interchange of the electric vehicles is considered as one of the factors. The proposed method of scheduling by optimum distribution of EV charging and discharging activities over time slots not only guarantees load demand balancing but also prevents peak stress and improves the microgrid’s overall performance.
Let the decision variable for at time slot be shown in Equation (42).
| (42) |
The optimal scheduling problem is shown in Equations (43) and (44).
| (43) |
Subject to,
| (44) |
The SoC update constraint shown in Equation (45).
| (45) |
Here, : State-of-charge of EV at time slot ; ; State-of-charge of EV at the next time slot; ; Charging power of EV at time ; dis : Discharging power of EV at time ; ; Charging efficiency of the EV battery; : Discharging efficiency of the EV battery; : Battery capacity of EV : Duration of the time slot (hours).
The multi-objective optimization problem is addressed using a weighted aggregation approach, in which energy loss minimization and efficiency maximization are combined into a single composite fitness function. Appropriate weighting coefficients are assigned to each objective to balance their relative influence during the optimization process. These weights are selected based on system performance priorities and normalized objective magnitudes to ensure neither objective disproportionately dominates the search process. During PSO iterations, each particle’s fitness value reflects the combined contribution of both objectives, thereby inherently managing the trade-off between reducing distribution losses and improving system efficiency. This formulation enables the algorithm to converge toward a balanced optimal solution that satisfies both operational goals simultaneously.
During periods of high microgrid demand, the proposed coordination strategy resolves conflicting objectives through adaptive adjustment of EV charging and discharging decisions within the weighted multi-objective optimization framework. When load demand approaches peak conditions, the algorithm prioritizes system stability and loss minimization by reducing or postponing non-critical charging activities and, where feasible, activating controlled discharging from EVs operating under vehicle-to-grid mode. The weighted fitness function dynamically balances energy loss reduction, efficiency enhancement, and operational constraints, ensuring that no single objective dominates under stressed conditions. Additionally, voltage limits, line capacity constraints, and state-of-charge boundaries are strictly enforced during optimization, thereby guaranteeing that high-demand scenarios are managed without compromising system reliability. This coordinated mechanism enables effective resolution of objective conflicts while maintaining secure and efficient microgrid operation.
Based on the formulated objective functions and operational constraints, the coordinated charging and discharging schedule is determined using a PSO-based optimization approach.
3.12 Coordination of EV Operation with Microgrid Load and Generation Profiles
In order to ensure that the system performs well and reliably, the electric vehicle operation is synchronized with the load and generating profiles of the microgrid. The microgrid connection with the electric vehicle power swap can partially resolve the energy storage problem and thus it can be viewed as a time-based flexible resource for energy storage depending on the variegated load and generation patterns. This partnership presents numerous advantages such as balancing of supply and demand, peak load reduction, energy losses minimization, and overall efficiency increase of the distribution system. By linking the power exchange of the EVs with the fluctuating load and generation patterns, the microgrid will be able to leverage the EVs as flexible energy storage resources.
The classification of peak and off-peak charging sessions is based on the daily time-of-use (ToU) characteristics derived from the distribution system load profile. Peak periods are defined as the time intervals during which the aggregated microgrid demand reaches its highest levels, typically corresponding to evening residential demand peaks. Conversely, off-peak periods represent low-demand intervals, generally occurring during late-night and early-morning hours. The ToU segmentation is determined by analyzing the daily load curve and identifying threshold levels that distinguish high-load and low-load operating conditions. This rule-based categorization ensures that EV charging control is directly aligned with actual system stress levels, enabling load flattening, peak reduction, and improved distribution system performance.
The power balance constraint of the microgrid at time slot is shown in Equation (46).
| (46) |
In the given case, symbolizes the power traded with the main grid, the cumulative power produced by distributed energy resources, load indicates the overall demand of microgrid load, the EV power for charging and discharging in that order, signifies the power unfavorable in the distribution system, and the count of EVs.
4 Results and Discussions
The results of the simulation show that the smart plan for charging and discharging electric cars has very good effects on the performance of the microgrid. The joint scheduling decreased total energy losses in the IEEE 33bus and 69-bus systems up to 25%–20% at least-when compared to the situation where charging was uncontrolled. The acceptable range was maintained for the voltage profiles and the support of V2G also made it possible to shave the peak load. The movement of flexible charging sessions to off-peak hours led to load balancing as well as the higher usage of renewables to the extent of EV discharging during peak demand. To sum up, the findings reinforce the claim that intelligent scheduling not only reduces the technical losses but also leads to the distribution networks being more efficient, reliable, and environmentally friendly.
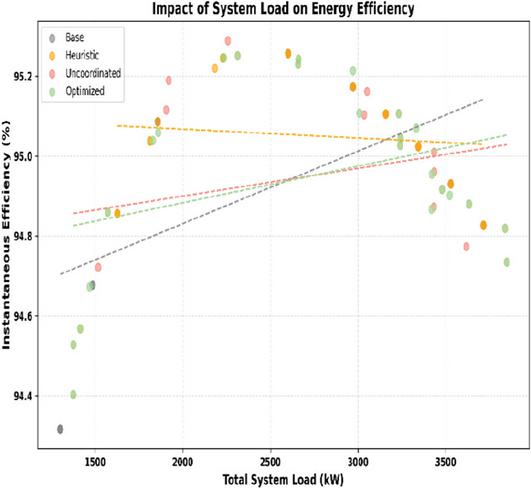
Figure 3 Energy Efficiency Trends with Different Optimization Approaches at Varying System Loads.
4.1 Impact of Control Strategies on Energy Efficiency at Scale
The Total System Load (kW) and Instantaneous Efficiency (%) through four different optimization techniques which are Base, Heuristic, Uncoordinated, and Optimized shown in Figure 3. General efficiency rise is noticeable through the applications of all methods as the load increases from 1500 kW to 3500 kW. The Base (Gray) line symbolizes the lowest point of the unoptimized scenario, reflecting a lesser efficiency. Efficiency of the Heuristic (Pink) method progresses slightly, however, the Uncoordinated (Orange) method is slightly ahead with higher gains. Nonetheless, the Optimized (Green) method is still the one that has the highest efficiency, particularly in case of very high loads, thus proving the worth of the optimization methods. The graph shows that the optimization methods, mainly the ones using coordinated energy management, are the ones that reap the most in terms of energy saving when the system load increases.
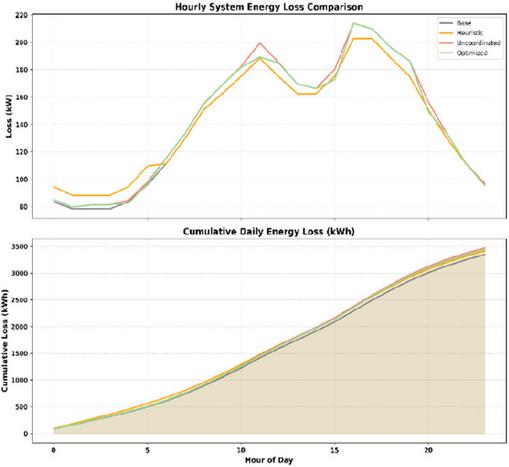
Figure 4 Impact of optimization methods on hourly and cumulative energy loss.
4.2 Comparison of Hourly and Cumulative Energy Loss Across Different Optimization Methods
The loss of energy through various optimization techniques per hour, as well as by day with cumulated energy loss shown in the Figure 4. The foremost picture depicts daylong changes in energy loss in kW. The Base (Gray) method is the one that brings about the highest energy loss, whereas the Heuristic (Pink) and Uncoordinated (Orange) methods have slightly less loss but are still in a worse position than the Optimized (Green) method, which always has the least energy loss. The second graph shows the total energy loss throughout the day, pointing out which method was most efficient overall. The Optimized (Green) method causes the least daily cumulative energy loss, thus it could be said that optimization greatly eliminates energy waste during the day when compared with the other methods.
4.3 Evaluation of Energy Efficiency Across Different System Optimization Strategies
The comparison of the energy efficiency of four optimization techniques: Base, Heuristic, Uncoordinated, and Optimized shown in Figure 5. The Base (Gray) technique is defined as the reference point for measurement with an efficiency of . The Heuristic (Yellow) technique, however, surpasses the Base’s efficiency very close to it by showing a slight increase of at . The two methods, Uncoordinated (Pink) and Optimized (Green), are stated to perform similarly with and, hence, are given the same category on the scale. This study points out that still a small distance separates all three methods from the Heuristic one since the latter one is regarded as the best performing one in the whole setup.
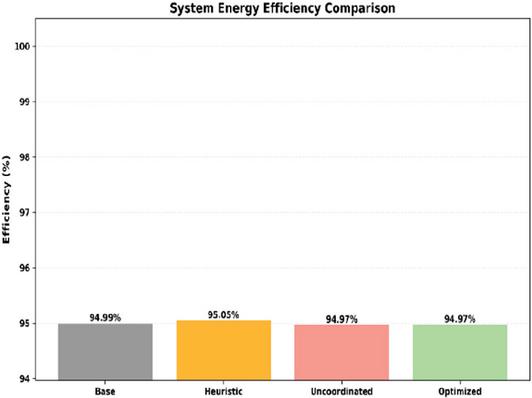
Figure 5 Evaluation of energy efficiency across different system optimization strategies.
4.4 Analysis of Peak-to-Average Ratio Across Different Optimization Methods
The picture, Peak-to-Average Ratios for four optimization strategies: Base, Heuristic, Uncoordinated, and Optimized are given. Greater the value of a PAR, the higher the difference between load peak and load average in the system shown in the Figure 6. Base had a PAR of 1.40, signifying peak much higher than average. Heuristic made marginal improvement reducing it to 1.36-that indicates improved balance between peak and average. In Uncoordinated and Optimized methods, the PAR values again slight improvement of 1.41 and 1.42 respectively. This means return to a more uneven load distribution. To summarize, while the optimized method has a clear improvement in performance, it has the highest PAR value, implying that this optimization might lead to further fluctuations between peak and average load levels.
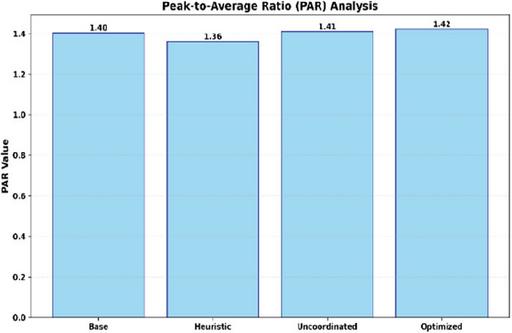
Figure 6 Peak-to-average ratio evaluation for various energy system optimization approaches.
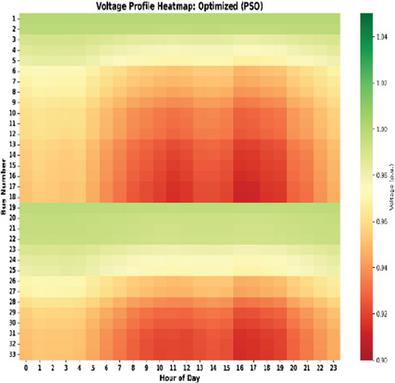
Figure 7 Voltage distribution across the day (optimized PSO-based profile).
4.5 Voltage Profile Analysis for Optimized Power System Using PSO
Spiders’ Web mapping of the overall node status at each scale over the period of 24 hours creates an optimally generated system shown in Figure 7. The color scheme on the right indicates the voltage value, with colors going from red (characterizing small voltage values) to green (characterizing large voltage values). The heatmap shows daily fluctuations of voltage values, some of the hours are characterized by lower voltage levels (darker red shades) while others are higher (greener areas). In fact, voltage values are highest around bus number 19 where a trend of low voltage in the middle of the day and high in night or early morning is seen, which indicates an optimized voltage profile where optimization aids in keeping stable voltages throughout the system. The voltage profile that has been optimized shows how PSO has changed the distribution of voltages to be more uniform throughout the day with very small dips below the acceptable voltage range.
The observed voltage profile improvements directly demonstrate the operational effectiveness of coordinated vehicle-to-grid (V2G) scheduling within the microgrid-based distribution network. By strategically managing EV charging and discharging actions, voltage deviations are minimized and system stability is enhanced, confirming that intelligent V2G coordination contributes to reliable and resilient microgrid operation.
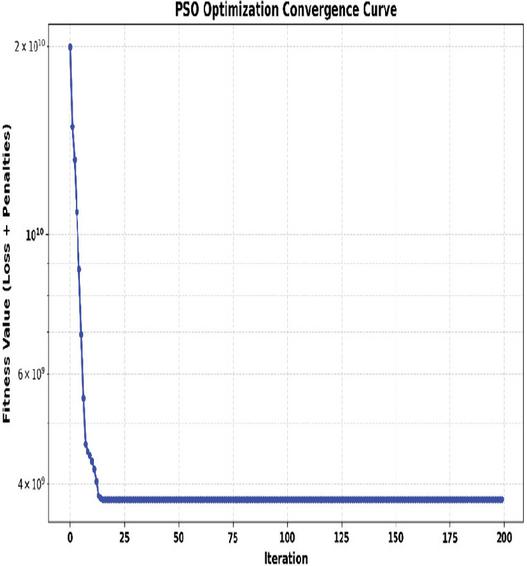
Figure 8 Convergence behavior of PSO optimization over iterations.
4.6 PSO Convergence Analysis: Fitness Value Reduction Across Iterations
The PSO Optimization Convergence Curve, which records the fitness value (the sum of loss and penalties) of the optimization process over various iterations shown in the Figure 8. The iterations count along the x-axis is from 0 to 200, and the fitness value is on the y-axis. The fitness value is very high at the starting point, around , and then quickly goes down during the first few iterations. This sudden fall is a sign that the Particle Swarm Optimization (PSO) technique has very rapidly done a great deal in cutting down loss and penalties at its early stages. Around the 25th iteration, the fitness value becomes pretty much constant, which means that the optimization process has pretty much come to a halt, and additional iterations yield only slight improvements. Thereafter, the curve stays horizontally aligned, which is a clear indication that the algorithm has indeed gotten a perfect or almost perfect solution since very minor deviations occur after that stage. Thus, this proves that PSO is very quick to converge on a solution.
4.7 Optimized Voltage Profile at Hour 16: A Comparison with Base and Uncoordinated Methods
The voltage profile at 16:00 is depicted by the diagram for the three optimization methods namely Base Case, Uncoordinated, and Optimized shown in the Figure 9. The Base Case (black) presents extreme voltage drops through many bus numbers and, in some instances, the values are below the 0.9 p.u. minimum limit suggesting instability. The Uncoordinated method (red) has a bit of an uplift that is barely noticeable, but still some of the buses have voltage levels that are about the same as or under the limit. The Optimized (green) method proves to be the winner among the three as it guarantees voltages that are significantly above the 0.9 p.u. limit, thus marking a much more stable and effective voltage allocation throughout the system.

Figure 9 Voltage profile at 16:00: optimization effects on system stability.
4.8 Effect of Proposed Optimization on Daily System Load with EV Integration
The graph three different cases: Base Load (No EV), Uncoordinated EV, and the Proposed Optimization, which had the highest daily total load profile of the whole electricity system shown in the Figure 10. The Base Load (No EV) (black dashed line) the normal pattern of load where there is no charging of electric vehicles (EVs) at all. The Uncoordinated EV (red line) leads to very high loads in the afternoon since a lot of EVs are charging at the same time which makes the whole process quite inefficient. The Proposed Optimization (green line) effectively distributes and thus reduced charging load during these peak hours, resulting in a smooth, balanced load profile throughout the day which in turn translates into better energy distribution and higher system efficiency.
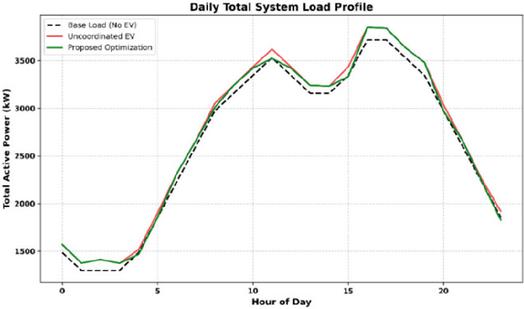
Figure 10 Daily total system load profile: Impact of EV charging optimization.
The reduction in peak demand and improved load distribution further validate the operational value of coordinated V2G scheduling. By shifting flexible charging sessions to off-peak periods and enabling controlled discharging during high-demand intervals, the proposed optimization framework effectively mitigates peak stress on the distribution network while maintaining supply-demand balance.
4.9 Voltage Stability Comparison: Base, Uncoordinated, and Optimized Methods Over a Day
The illustration illustrates the voltage distribution for a 24 -hour period among three methods, namely: Base, Uncoordinated, and Optimized shown in Figure 11. The Base method reveals the largest amplitude of voltage variation which is characterized by the values from 0.92 to 0.98 p.u. hence, it shows the highest volatility. The Uncoordinated method reduces the range a bit with a median of about 0.96 which implies some progress. The Optimized method exhibits the least fluctuation representing the most stable voltage values and thus the least variation which is always within the predetermined limits. Therefore, the Optimized method is not just more effective than the Base and Uncoordinated methods in voltage control but also contributes to overall stability.
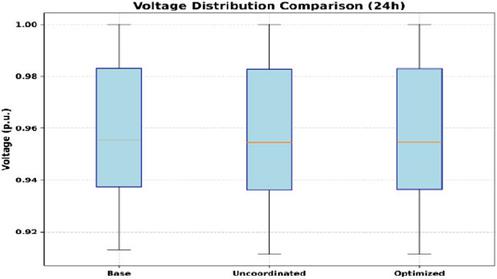
Figure 11 Box plot analysis of voltage distribution for various optimization strategies.
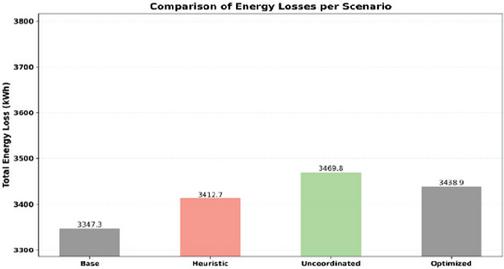
Figure 12 Impact of optimization on total energy loss in different scenarios.
4.10 Comparison of Total Energy Loss Across Different Scenarios
The chart demonstrates the cumulative fuel losses in terms of kWh designed for four particular scenarios, which include Base, Best Practice, Uncoordinated, and Optimized shown in Figure 12. Among all, the Base scenario reveals the least energy loss of 3347.3 kWh, which is considered as the reference point. The Heuristic method causes a trivial increase in energy loss of 3412.7 kWh, presenting an insignificant gain. The Uncoordinated case experiences the maximum energy loss of 3469.8 kWh, reflecting the inadequacies of the system. Lastly, the Optimized method lightens the loss to 3438.9 kWh, providing a slight advantage over the Uncoordinated but still a long way from the Base.
5 Conclusion
The simulation results demonstrate that the proposed PSO-based optimal scheduling framework effectively achieves the primary objectives of minimizing energy losses and enhancing distribution system efficiency under realistic microgrid operating conditions. In the IEEE 33-bus and 69-bus test systems, coordinated EV charging and discharging reduced total network energy losses by up to compared with the uncoordinated charging scenario. Distribution system efficiency showed measurable improvement due to reduced line currents and better load distribution. The proposed method also improved voltage stability by maintaining all bus voltages within acceptable operational limits and reducing voltage deviations during peak demand periods. Furthermore, peak load smoothing was achieved by shifting flexible EV charging sessions to off-peak hours and enabling vehicle-to-grid support during high-demand intervals, resulting in a more balanced daily load profile and lower peak-to-average ratio. These results confirm that intelligent EV scheduling can significantly enhance the technical performance, reliability, and operational stability of microgrid-connected distribution systems. Future researchers intend to extend the proposed framework to cover larger EV fleets, to factor in the stochastic nature of renewable generation, and to create adaptive algorithms that can handle uncertainties concerning user behavior and resource availability.
Declarations
Data Availability
The data used to support the findings of this study are available from the corresponding author upon reasonable request.
Conflicts of Interest
The author(s) declare that there are no conflicts of interest regarding the publication of this paper.
Funding Statement
This research received no external funding.
Author Contribution
The author(s) contributed equally to the conception and design of the study, methodology development, data analysis, interpretation of results, and preparation and revision of the manuscript. All author(s) have read and approved the final version of the manuscript.
Ethical Approval
This study does not involve human participants or animals and therefore does not require ethical approval.
Consent to Participate
Not applicable, as this study does not involve human participants.
Consent to Publication
Not applicable.
Competing Interests
The author(s) declare that they have no competing interests.
References
[1] R. A. Ibrahim, I. M. Gaber, and N. E. Zakzouk, “Analysis of multidimensional impacts of electric vehicles penetration in distribution networks,” Sci. Rep., vol. 14, no. 1, p. 27854, Nov. 2024. doi: 10.1038/s41598-024-77662-6.
[2] Z. Wang, “Research on application of electric vehicles in urban transportation systems for greenhouse gas reduction,” Highlights Sci. Eng. Technol., vol. 121, pp. 432–439, Dec. 2024. doi: 10.54097/tafm0554.
[3] K. Pan, C.-D. Liang, and M. Lu, “Optimal scheduling of electric vehicle ordered charging and discharging based on improved gravitational search and particle swarm optimization algorithm,” Int. J. Electr. Power Energy Syst., vol. 157, p. 109766, Jun. 2024. doi: 10.1016/j.ijepes.2023.109766.
[4] S. Aghajan-Eshkevari, S. Azad, M. Nazari-Heris, M. T. Ameli, and S. Asadi, “Charging and Discharging of Electric Vehicles in Power Systems: An Updated and Detailed Review of Methods, Control Structures, Objectives, and Optimization Methodologies,” Sustainability, vol. 14, no. 4, p. 2137, Jan. 2022. doi: 10.3390/su14042137.
[5] S. Iqbal, S. Habib, N. H. Khan, M. Ali, M. Aurangzeb, and E. M. Ahmed, “Electric Vehicles Aggregation for Frequency Control of Microgrid under Various Operation Conditions Using an Optimal Coordinated Strategy,” Sustainability, vol. 14, no. 5, p. 3108, Jan. 2022. doi: 10.3390/su14053108.
[6] O. M. Hernández-Gómez and J. P. Abreu Vieira, “Probabilistic Assessment of the Impact of Electric Vehicle Fast Charging Stations Integration into MV Distribution Networks Considering Annual and Seasonal Time-Series Data,” Energies, vol. 17, no. 18, p. 4624, Jan. 2024. doi: 10.3390/en17184624.
[7] M. Escoto, A. Guerrero, E. Ghorbani, and A. A. Juan, “Optimization Challenges in Vehicle-to-Grid (V2G) Systems and Artificial Intelligence Solving Methods,” Appl. Sci., vol. 14, no. 12, p. 5211, Jan. 2024. doi: 10.3390/app14125211.
[8] J. Li, H. Tang, P. Li, Z. Li, and C. Liang, “An Improved NSGA-II Based Multi-Objective Optimization Model for Electric Vehicle Charging Station Selection,” Mathematics, vol. 13, no. 23, p. 3855, Jan. 2025. doi: 10.3390/math13233855.
[9] D. Savio Abraham et al., “Electric Vehicles Charging Stations’ Architectures, Criteria, Power Converters, and Control Strategies in Microgrids,” Electronics, vol. 10, no. 16, p. 1895, Jan. 2021. doi: 10.3390/electronics10161895.
[10] A. M. Eltamaly, “Optimal Dispatch Strategy for Electric Vehicles in V2G Applications,” Smart Cities, vol. 6, no. 6, pp. 3161–3191, Dec. 2023. doi: 10.3390/smartcities6060141.
[11] X. Liu, “Research on Flexibility Evaluation Method of Distribution System Based on Renewable Energy and Electric Vehicles,” IEEE Access, vol. 8, pp. 109249–109265, 2020. doi: 10.1109/ACCESS.2020.3000685.
[12] C. Wu, “Carbon Emission Evaluation and Low Carbon Economy Optimization Scheduling of Rural Integrated Energy System Based on LCA Method,” IEEE Access, vol. 13, pp. 17182–17194, 2025. doi: 10.1109/ACCESS.2025.3533099.
[13] S. Peyghami, P. Palensky, M. Fotuhi-Firuzabad, and F. Blaabjerg, “System-Level Design for Reliability and Maintenance Scheduling in Modern Power Electronic-Based Power Systems,” IEEE Open Access J. Power Energy, vol. 7, pp. 414–429, 2020. doi: 10.1109/OAJPE.2020.3029229.
[14] F. Fayaz and G. L. Pahuja, “Optimal Control of Hybrid Power System Integrated with Distributed Generation and Electric Vehicle,” Distrib. Gener. Altern. Energy J., vol. 38, no. 1, pp. 189–214, 2023. doi: 10.13052/dgaej2156-3306.3819.
[15] M. K. Senapati et al., “Advancing Electric Vehicle Charging Ecosystems With Intelligent Control of DC Microgrid Stability,” IEEE Trans. Ind. Appl., vol. 60, no. 5, pp. 7264–7278, Sep. 2024. doi: 10.1109/TIA.2024.3413052.
[16] Z. J. Lee et al., “Adaptive Charging Networks: A Framework for Smart Electric Vehicle Charging,” IEEE Trans. Smart Grid, vol. 12, no. 5, pp. 4339–4350, Sep. 2021. doi: 10.1109/TSG.2021.3074437.
[17] M. R. H. Mojumder et al., “Electric Vehicle-to-Grid (V2G) Technologies: Impact on the Power Grid and Battery,” Sustainability, vol. 14, no. 21, p. 13856, Jan. 2022. doi: 10.3390/su142113856.
[18] M. Usman et al., “A Coordinated Charging Scheduling of Electric Vehicles Considering Optimal Charging Time for Network Power Loss Minimization,” Energies, vol. 14, no. 17, p. 5336, Jan. 2021. doi: 10.3390/en14175336.
[19] E. Shokouhmand and A. Ghasemi, “Stochastic optimal scheduling of electric vehicles charge/discharge modes of operation with the aim of microgrid flexibility and efficiency enhancement,” Sustain. Energy Grids Netw., vol. 32, p. 100929, Dec. 2022. doi: 10.1016/j.segan.2022.100929.
[20] E. Hadian, H. Akbari, M. Farzinfar, and S. Saeed, “Optimal Allocation of Electric Vehicle Charging Stations With Adopted Smart Charging/Discharging Schedule,” IEEE Access, vol. 8, pp. 196908–196919, 2020. doi: 10.1109/ACCESS.2020.3033662.
[21] K. Preusser and A. Schmeink, “Energy Scheduling for a DER and EV Charging Station Connected Microgrid With Energy Storage,” IEEE Access, vol. 11, pp. 73435–73447, 2023. doi: 10.1109/ACCESS.2023.3295997.
[22] M. Shang, L. Zhang, and H. Duan, “Optimizing electric vehicle scheduling strategies for advanced distribution system planning and operation with comprehensive cost-benefit analysis,” Energy, vol. 307, p. 132670, Oct. 2024. doi: 10.1016/j.energy.2024.132670.
[23] M. Zou et al., “Optimization Model of Electric Vehicles Charging and Discharging Strategy Considering the Safe Operation of Distribution Network,” World Electr. Veh. J., vol. 13, no. 7, p. 117, Jul. 2022. doi: 10.3390/wevj13070117.
[24] M. B. Rasheed et al., “An Optimal Scheduling and Distributed Pricing Mechanism for Multi-Region Electric Vehicle Charging in Smart Grid,” IEEE Access, vol. 8, pp. 40298–40312, 2020. doi: 10.1109/ACCESS.2020.2976710.
[25] M. Ahmadi, S. H. Hosseini, and M. Farsadi, “Optimal Allocation of Electric Vehicles Parking Lots and Optimal Charging and Discharging Scheduling using Hybrid Metaheuristic Algorithms,” J. Electr. Eng. Technol., vol. 16, no. 2, pp. 759–770, Mar. 2021. doi: 10.1007/s42835-020-00634-z.
[26] L. Affolabi et al., “Hierarchical Transactive Energy Scheduling of Electric Vehicle Charging Stations in Constrained Power Distribution and Transportation Networks,” IEEE Trans. Transp. Electrification, vol. 9, no. 2, pp. 3398–3409, Jun. 2023. doi: 10.1109/TTE.2022.3219721.
[27] Y. Yue, Q. Zhang, J. Zhang, and Y. Liu, “Orderly Charging and Discharging Group Scheduling Strategy for Electric Vehicles,” Appl. Sci., vol. 13, no. 24, p. 13156, Jan. 2023. doi: 10.3390/app132413156.
[28] H. U. R. Habib et al., “Energy Cost Optimization of Hybrid Renewables Based V2G Microgrid Considering Multi Objective Function by Using Artificial Bee Colony Optimization,” IEEE Access, vol. 8, pp. 62076–62093, 2020. doi: 10.1109/ACCESS.2020.2984537.
[29] P. S. Savita et al., “Efficient scheduling of electric vehicle resources in wind-integrated distribution networks,” Sustain. Energy Technol. Assess., vol. 80, p. 104385, Aug. 2025. doi: 10.1016/j.seta.2025.104385.
[30] N. K. Musham and R. Hemnath, “Real-Time Path Planning for IoT-Enabled Autonomous Vehicle Robotics Using RRT and A* Algorithms,” Int. J. Multidiscip. Res. Explor., vol. 5, no. 1, pp. 66–84, Mar. 2025. doi: 10.70454/IJMRE.2021.10701.
[31] J. Chen et al., “Multi-Objective Optimization Scheduling of Active Distribution Network Considering Large-Scale Electric Vehicles Based on NSGAII-NDAX Algorithm,” IEEE Access, vol. 11, pp. 97259–97273, 2023. doi: 10.1109/ACCESS.2023.3312573.
Biographies

Anjiang Liu was born in Tongren, Guizhou, P.R. China, in 1991. He graduated from Guizhou University in China with a master’s degree. Currently, he works at the Electric Power Research Institute of Guizhou Power Grid Co., Ltd. His research interests include distribution network operation and maintenance.

Youzhuo Zheng was born in Tongren, Guizhou, P.R. China, in 1990. He graduated from Northeastern University in China with a master’s degree. Currently, he works at the Electric Power Research Institute of Guizhou Power Grid Co., Ltd. His research interests include distribution network operation and maintenance.

Di Weng was born in Xingyi, Guizhou, P.R. China, in 1999. He graduated from North China Electric Power University in China with a master’s degree. Currently, he works at the Electric Power Research Institute of Guizhou Power Grid Co., Ltd. His research interests include distribution network operation and maintenance.

Hengrong Zhang was born in Liupanshui Guizhou, P.R. China, in 1996. He graduated from Huazhong University of Science and Technology in China with a master’s degree. Currently, he works at the Electric Power Research Institute of Guizhou Power Grid Co., Ltd.His research interests include automation and maintenance of distribution networks.

Xinhao Li was born in Taizhou, Zhejiang, P.R. China, in 1997. He graduated from Chongqing University in China with a master’s degree. Currently, he works at the Electric Power Research Institute of Guizhou Power Grid Co., Ltd. His research interests include automation and maintenance of distribution networks.
Distributed Generation & Alternative Energy Journal, Vol. 41_3, 501–544
doi: 10.13052/dgaej2156-3306.4132
© 2026 River Publishers