Distribution System Security Protection Model Based on OCSVM Combined with DPoS
Xiujuan Meng, Ke Zhang and Liping Zhang*
School of Mechanical and Electrical Engineering, Weifang Engineering Vocational College, Weifang, 262500, China
E-mail: zdq2mm@163.com
*Corresponding Author
Received 10 February 2026; Accepted 07 July 2026
Abstract
With the rapid development of information technology in the power field, information security threats have gradually penetrated into the power system. To solve the low efficiency and insufficient accuracy of intrusion detection in multi-microgrid power distribution systems, this study constructs an intrusion detection method for distributed power grids based on One Class Support Vector Machine (OCSVM). Meanwhile, blockchain technology and the Delegated Proof of Stake (DPoS) are combined to build a collaborative detection model. In the collaborative security protection model, the study uses the triggering and polling mechanism to generate proposals, and optimizes the judgment conditions of the DPoS algorithm to improve the applicability to power distribution systems. The attack detection rate of the improved OCSVM model proposed in the study was 4.55% higher than that of the traditional Support Vector Machine (SVM). For model training efficiency, the OCSVM was 6.1 minutes faster than that of the SVM. In the test sample data, the highest accuracy of the OCSVM-DPoS model was 0.989, and the average accuracy was as high as 0.933. In addition, the OCSVM-DPoS model had an average detection rate of 93.46% for tampering attacks and 93.50% for replay attacks, which were also higher than those of other models. The proposed method has high performance in intrusion detection of multi-microgrid distribution systems and has good application prospects in the power grid security management.
Keywords: Support vector machine, DPoS algorithm, power distribution system, microgrid, intrusion detection, security protection.
1 Introduction
The security protection of power distribution system has an important impact on the stable operation of power network. With the development of information technology, power distribution systems face many challenges in information confidentiality, integrity and availability. Attacks on the power distribution system can not only cause serious faults to the power distribution system through the attack information layer in the network, but can also use technology to steal power grid information [1]. In multi-microgrid power distribution systems, most areas adopt a distributed regional scale and centralized management system model. The bidirectional flow of power and information between the internal devices of multi-microgrid power distribution systems and their distributed characteristics make microgrid systems more vulnerable to intrusions and attacks [2]. Attackers can impersonate microgrid equipment and intercept grid information, thereby greatly increasing the privacy leakage for grid users. Attackers can also impersonate the distribution system to conduct planned island attacks or release false control information against microgrids. The modernization of smart grids has brought more complex operations and more network security vulnerabilities, so a strong security management framework must be built. The contribution of the research lies in the improvement of OCSVM algorithm and DPoS equity election mechanism, which enhances the adaptability of OCSVM to power characteristics in distribution network detection. At the same time, the introduction of energy flow correlation matrix optimizes the representative node election rules, effectively reducing the risk of missed detections in distributed scenarios.
2 Literature Review
In the field of power grid security detection, Xiao et al. discussed the application of deep learning in real-time intrusion detection in power grids. Various machine learning models were evaluated, including support vector machines, linear discriminant analysis, decision trees, etc., while detecting various types of intrusions, including fault, injection, camouflage, normal and replay. The results showed that the decision tree model also showed robust performance in detecting faults and injecting intrusions (AUC 0.98), with an F1 score of 0.94 [3]. Agboola et al. proposed a conceptual model for embedding a cybersecurity framework into power grid modernization, combining artificial intelligence and real-time monitoring to build a layered detection framework for proactive threat detection [4]. Bi et al. built a power Internet of Things intrusion detection model by combining deep belief networks and Bidirectional Long Short-Term Memory (BiLSTM). This model effectively reduced network security risks and provided strong support for the stability of smart grids and sustainable energy development [5]. Aljohani et al. proposed an intrusion detection and mitigation system for the security protection of power systems using deep learning neural network detection. The simulation results showed that this method had high accuracy in the modified IEEE 13 bus system [6]. Upadhyay et al. proposed an integrated framework for intrusion detection that combined feature engineering-based preprocessing with machine learning classifiers. This method applied gradient boosting feature selection technology to prioritize key features instead of traditional hyperparameter tuning. It not only improves the attack detection rate, but also significantly reduces the false alarm rate and execution time, optimizing system performance [7].
In the SVM intrusion detection technology, Azimjonov et al. built a network security system relying on regression feature selectors and linear SVM. The study evaluated different data sets, used feature selection to improve detection efficiency, and compared classifier performance. The results showed that the improved SVM had efficiency and reliability in intrusion detection [8]. Amaran et al. built a new intrusion detection model relying on the security requirements of wireless sensor networks. This model integrated K-means clustering and SVM, and used the crow search algorithm to optimize SVM parameters. Experiments on standard data sets showed that its accuracy reached up to 95.12% and 98.98%, respectively, proving that the model can effectively provide security guarantees for resource-constrained WSNs [9]. Das et al. proposed an adversarial attack called cosine similarity label manipulation that can destroy machine learning-based intrusion detection systems. Through the minimum and maximum attack versions, tests in a software-defined network environment showed that the performance of classifiers such as random forest and SVM dropped significantly, with SVM performance dropping by as much as 60%, proving that this attack poses a serious threat to machine learning security [10].
To sum up, in the current field of security protection research for power distribution systems, most of the existing research results only carry out intrusion detection technology for information flow, but there are relatively few intrusion detections for the energy flow of the power grid. Therefore, the study builds a collaborative security protection model for multiple microgrids based on the improved One Class Support Vector Machine (OCSVM) and the Delegated Proof of Stake (DPoS) algorithm. A triggering and polling mechanism in the model is designed to reduce the missed detection rate in intrusion detection. The innovation of the research is to adaptively improve the penalty coefficient and kernel function parameters of OCSVM in response to the extreme imbalance of distribution system samples, in order to enhance the detection accuracy and training efficiency in small sample abnormal scenarios; At the same time, the representative node election rules of the DPoS consensus mechanism are adapted and modified for distribution scenarios, abandoning pure equity election logic and introducing dual criteria for energy flow correlation and hash operation difficulty, to achieve trustworthy collaboration and data sharing of detection results between distributed microgrids. The research aims to improve the security protection performance and efficiency of the power network system and provide solutions for the security detection of multi-microgrid distribution networks.
3 Methods
To improve the accuracy and efficiency of identifying and detecting intrusions in multi-microgrid power distribution systems, the study constructs a collaborative security protection model by improving the SVM algorithm and combining it with the DPoS algorithm. The triggering and polling detection mechanism is designed based on the consensus mechanism of the blockchain to avoid missing abnormal data in the distributed microgrid system of the model.
3.1 Power Distribution System Intrusion Detection Method based on OCSVM
With the development of distribution networks and microgrids and the widespread application of information and communication technology, the power distribution system has gradually transformed into an intelligent power distribution and cyber-physical system with high integration of cyber-physical space. This also increases the risk of the system being attacked by cyber-attacks. Especially, due to the characteristics of independent and distributed equipment, targeted attacks can continuously and simultaneously attack in multiple directions [11]. Therefore, for the safety protection system of multi-microgrid distribution systems, it is necessary to coordinate the information of multiple microgrids to achieve joint risk triggering and data sharing. The multi-microgrid power distribution system is shown in Figure 1.
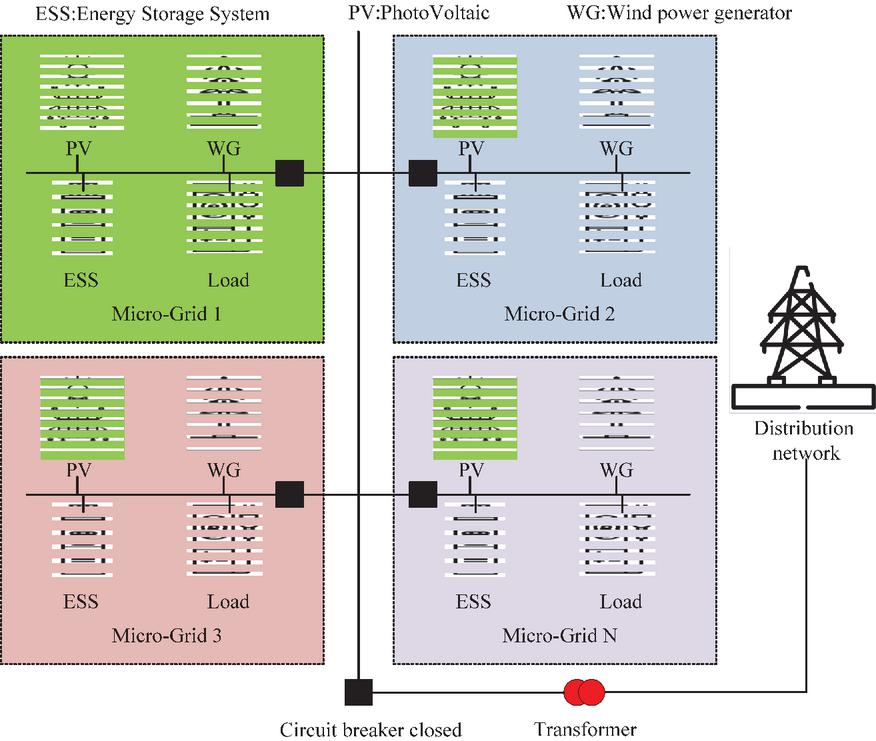
Figure 1 Multi-microgrid distribution system.
From Figure 1, since the intrusion detection system of each microgrid is in an isolated state, the missed detection is prone to occur. Therefore, for multi-microgrid power distribution systems, an intrusion detection method based on an improved SVM algorithm is proposed, and a joint security protection model is constructed in conjunction with the DPoS algorithm. In the intrusion detection method, the research improves the detection accuracy and efficiency of the entire system by designing the intrusion detection triggering and polling detection mechanism, and periodically generating collaborative detection proposals under system polling [12]. The triggering mechanism is to determine the system status by detecting the status of energy flow and information flow, and trigger collaborative detection proposals when anomalies are detected. In the design of the trigger mechanism for information flow, it is necessary to set up whitelist authentication to detect the communication address and protocol when system information flows, and trigger an alarm when anomalies are detected. The definition of communication address information is expressed by the following formula (1).
| (1) |
In formula (1), represents communication address information. and respectively signify the message sending and receiving ends of the Media Access Control (MAC) address. and respectively signify the message sending and receiving ends of the Internet Protocol (IP) address [13]. and signify the message sending and receiving ends of the transport layer network. The alert is triggered when does not belong to the whitelist. The trigger detection mechanism for energy flow is defined as the following formula (2).
| (2) |
In formula (2), represents the voltage threshold. Alert indicates triggering alert behavior. An alarm is triggered when the voltage of a microgrid node exceeds this threshold range. represents the load threshold. Similarly, an alarm is triggered when the load of the microgrid node does not fall within the threshold range. represents the distributed power output power. When the output power of the microgrid node exceeds this threshold range, an alarm is triggered. represents the operating mode of the microgrid. When the value is 1, it represents the grid-connected mode. When the value is 0, it represents the island mode. and represent the consumption and supply of the microgrid, respectively. Therefore, when the grid is in island mode, the mismatch between energy consumption and supply also triggers an alarm [14]. On the basis of the triggering mechanism, a mechanism for generating proposals through polling has been added to avoid intrusion detection systems ignoring attack patterns that do not affect system operation. The cycle definition for generating proposals through polling is shown in formula (3).
| (3) |
In formula (3), represents the number of microgrids currently generating proposals. represents the total number of microgrids in the system. and represent the system time and polling cycle, respectively. Through the above triggering mechanism combined with the periodic polling mechanism, the accuracy and efficiency of subsequent intrusion detection algorithms can be improved [15]. After the microgrid receives collaborative detection proposals from other devices, it needs to determine the correctness of the proposal content. The study uses the classification principle of the SVM to detect anomalies in distributed microgrid systems, as presented in Figure 2.
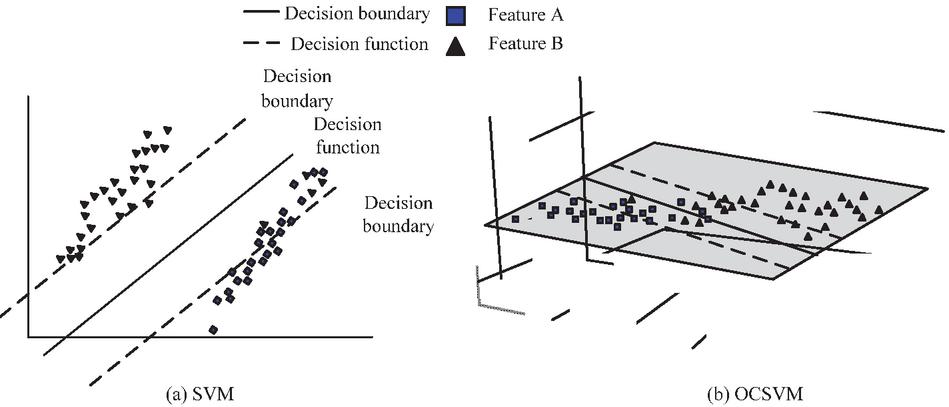
Figure 2 SVM algorithm and its optimization.
As shown in Figure 2(a), SVM handles the binary classification problem by obtaining an optimal decision boundary in the data space. However, during the training process of the traditional SVM model, both normal samples and abnormal samples are needed to identify abnormal behaviors. However, in distribution network systems, the quantity of abnormal samples is much lower than the quantity of normal samples, and data imbalance often exists in the data set. In this case, the training speed of the traditional SVM model is insufficient and there is low recognition performance [16]. Therefore, the study uses improved OCSVM for classification. As shown in Figure 2(b), OCSVM finds the optimal hyperplane in high-dimensional space to distinguish normal samples and abnormal samples. The mathematical expression of the hyperplane in the feature space is shown in formula (4).
| (4) |
In formula (4), signifies the normal vector that determines the direction of the hyperplane. signifies the data sample. signifies the bias term. After finding the hyperplane, two parallel hyperplanes are constructed as interval boundaries to determine the sample category, as shown in formula (5).
| (5) |
In formula (5), signifies the -th sample feature vector in the training set. represents the category label. The goal of the SVM algorithm is to maximize the classification interval. The optimization goal can be achieved by minimizing the square of the norm of the normal vector. To ensure correct classification, constraints need to be added to the sample points. The optimization goal and constraints are shown in formula (6).
| (6) |
In formula (6), signifies the penalty coefficient, and signifies the slack variable. The hyperplane of OCSVM is denoted as . The optimization objective in formula (6) becomes the following formula (7).
| (7) |
In formula (7), represents the set of the upper limit of the outlier proportion and the lower limit of the support vector proportion. represents the total number of samples. The optimal classification decision function of OCSVM is shown in formula (8).
| (8) |
In formula (8), represents the classification function. sgn represents the symbolic function. represents the Lagg point coefficient. represents the kernel function. In specific applications, when the classification function result is greater than 0, it indicates that the sample is normal data. Otherwise, it is abnormal data. The definition of the kernel function in formula (8) is shown in formula (9).
| (9) |
In formula (9), represents the kernel function parameter. It is difficult for standard OCSVM to adapt to the problems of high proportion of normal samples, large amplitude differences of abnormal samples, and uneven feature scales of energy flow and information flow in distribution systems, which adopt global fixed penalty coefficients and unified kernel parameters. Therefore, this article improves OCSVM from two dimensions. Firstly, the penalty coefficient of standard OCSVM is a globally fixed value, which cannot distinguish the weight of anomaly determination for samples in different density regions. This article introduces the sample local density factor to dynamically adjust the penalty weight of slack variables, as shown in equation (10).
| (10) |
In Equation (10), represents the penalty coefficient of the sample represents the basic penalty coefficient, represents the average local density of the training sample, and represents the local domain density of the sample . Under this method, the local density of abnormal points in high-density normal areas is much lower than that of surrounding samples, and the penalty coefficient is correspondingly increased,; For normal samples in the boundary region, the penalty coefficient is moderately reduced to reduce misjudgments. Afterwards, due to the fact that intrusion detection in power distribution systems simultaneously includes continuous physical features such as voltage and power, as well as discrete features such as communication addresses and protocol types, using a unified kernel width will result in imbalanced feature mapping effects. This article uses a feature specific Gaussian kernel function to set differentiated kernel widths for different types of features, as shown in Equation (11).
| (11) |
In Equation (11), represents the feature dimension and represents the kernel width of the feature in the dimension. For energy flow characteristics with strong physical constraints such as voltage and power, set a smaller kernel width to enhance the discrimination of amplitude anomalies; For information flow dispersion features such as MAC address and port, set a larger kernel width to avoid misjudgment caused by differences in discrete values. The optimization objective of the improved OCSVM is still based on the framework of Equation (7), which improves the adaptability of distribution scenarios through adaptive penalty coefficients and feature kernel functions. The optimal classification decision function form remains consistent with Equation (8) [17].
3.2 Cooperative Security Protection Model for Power Distribution System based on OCSVM Combined with DPoS
To improve the efficiency and accuracy of intrusion detection in distribution network systems, ensure that security protection technology can operate independently without service providers [18], the study integrates DPoS algorithm based on OCSVM intrusion detection technology to explore a collaborative detection proposal model between multiple micro-grids. The details are shown in Figure 3.
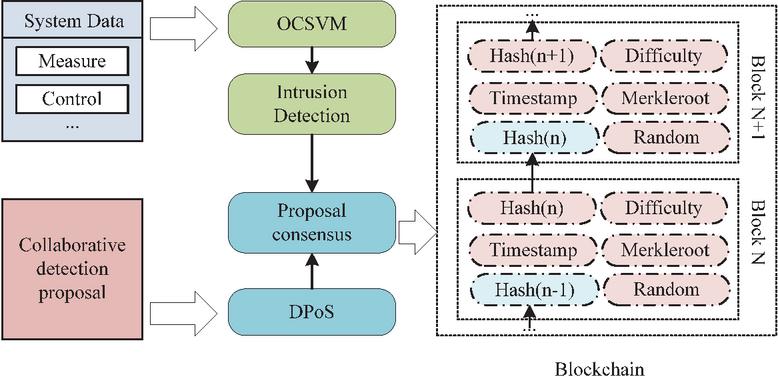
Figure 3 Collaborative detection model based on OCSVM intrusion detection method combined with DPoS algorithm.
From Figure 3, in a multi-microgrid power distribution system, a distributed intrusion detection method is built through OCSVM, and a collaborative detection scheme between multiple devices is built using the DPoS algorithm. The trigger and polling proposal mechanism is used to generate a unified power distribution system anomaly detection message to achieve collaborative security protection. To ensure that each microgrid can independently judge the correctness of the proposal content, a consensus must first be reached on the distributed detection results [19]. Therefore, the consensus mechanism of blockchain technology is used to improve the discrimination conditions of the DPoS algorithm and make the consensus mechanism suitable for multi-microgrid power distribution systems. Compared with other formula mechanisms of the blockchain, the DPoS algorithm has less time consumption and weak decentralization, so it is suitable for the power distribution system of distributed microgrids. The DPoS algorithm simulates the board resolution mechanism and retains the advantages of a decentralized system by selecting representative micronet nodes to participate in the formula process.
The traditional DPoS algorithm has equity considerations in selecting representative nodes, but in the power distribution system, all nodes have the need to become representative nodes. Therefore, the DPoS algorithm still needs to be optimized, and the judgment conditions of the improved DPoS algorithm are defined, as shown in formula (12).
| (12) |
In formula (12), SHA256 represents the algorithm for generating the fixed-length hash value. represents the hash value of . indicates the creation time of the current block. represents a random number, used for proof of work, ensuring the uniqueness of blocks and preventing double spending. represents the hash of the public key used to ensure the integrity of all transactions in the block. represents the equity holding time of node . represents the maximum target value of the judgment condition. represents the difficulty coefficient of node performing hash operation. Therefore, based on the judgment condition of formula (12), the original DPoS algorithm uses equity selection to represent nodes, which is replaced by comparing the ratio of the hash operation result to the target value to determine whether the node meets the condition [20].
To achieve coordinated detection and power balance between power grids, it is also necessary to select representative nodes by analyzing energy flow and correlation levels. Therefore, the sum of the output power in the grid needs to be the same as the load power consumption, as shown in formula (13).
| (13) |
In formula (13), represents the output power. represents power consumption. and signify the quantity of output power devices and the quantity of load devices. and are corresponding numbers. To ensure the stable operation, it is also necessary to meet the power balance between microgrids, as shown in formula (14).
| (14) |
In formula (14), represents the energy flow of the microgrid. represents the total output power of the microgrid. represents the total load size of the microgrid. According to formula (14), the impact of energy flow between microgrids can be evaluated through the energy flow correlation matrix, and the DPoS consensus mechanism can be used to select representative nodes to make proposals. In this way, the energy flow between microgrids can be ensured to be more reasonable and the stability and security of the system can be improved. The energy flow correlation matrix between microgrids is defined as the following formula (15).
| (15) |
In formula (15), represents the energy flow correlation matrix between grid and . Therefore, the influence between different microgrids within the system can be defined through formula (15), thereby selecting representative nodes. The specific definition is shown in formula (16).
| (16) |
In formula (16), represents the probability that grid selects grid as the recording node. represents the influence coefficient. When is greater than or equal to 0, the value is 0. When is less than 0, the value is 1. Through the above DPoS mechanism, a collaborative detection proposal consensus mechanism between distributed microgrids is constructed to achieve collaborative security protection. The specific construction process is shown in Figure 4.
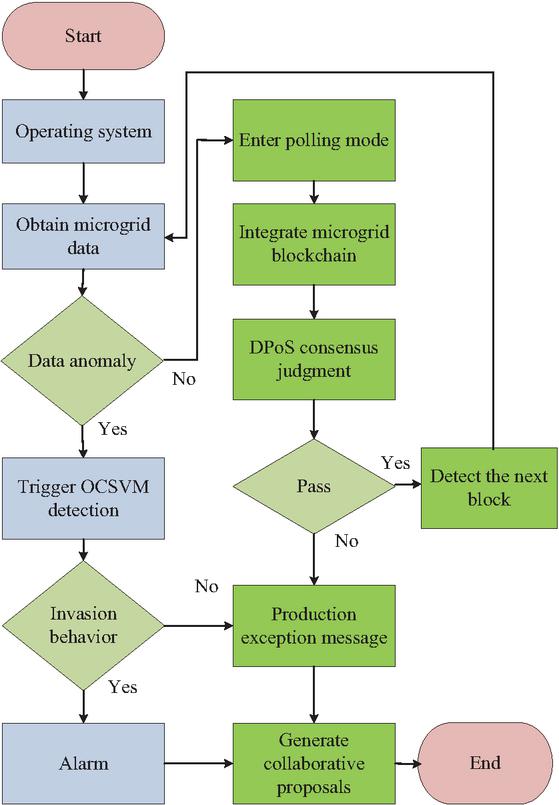
Figure 4 Collaborative detection process of OCSVM combined with DPoS algorithm.
As shown in Figure 4, in the collaborative security protection model, the validity and consistency of abnormal data proposal content can be ensured through the DPoS consensus mechanism in the blockchain, thereby realizing collaborative detection and abnormal behavior identification of OCSVM intrusion detection technology.
Three types of attack scenarios were set up in the experiment, and all attacks were assumed to be black box attackers. Among them, the false data injection attack is to superimpose false perturbation values on vector measurement data, which destroys the accuracy of state estimation. The attack model is represented by the following Equation (17).
| (17) |
In Equation (17), represents the original measurement value, represents the injected false disturbance vector, and represents the measurement value after the attack. Voltage attack and current attack are false disturbances injected into node voltage and current measurements, respectively. The voltage attack intensity is measured by the disturbance amplitude, in mV, with two levels of 100 mV and 200 mV respectively, corresponding to 0.05% and 0.1% of the rated voltage on the low-voltage side of the distribution system; The intensity of current attack is measured by the disturbance amplitude in mA, with two levels of 100 mA and 200 mA respectively, corresponding to 0.2% and 0.4% of the rated current of the branch.
Afterwards, tampering attacks refer to malicious modification of historical measurement data values and forgery of system operating status. The attack involves randomly selecting consecutive data segments from the measurement sequence and replacing them with fake data that deviates from the true value. The tampering amplitude is set to 10% to 30% of the rated value. Replay attacks, on the other hand, record measurement data from normal operating periods in history and repeatedly send it in subsequent periods to mask system anomalies. The attack model is represented by the following Equation (18).
| (18) |
In Equation (18), represents the playback time offset, and the experimental setting is 5–30 s.
4 Results and Analysis
To verify the OCSVM-DPoS in collaborative security protection of distribution networks, the study analyzed the abnormal data detection through data sets and line experiments.
4.1 Data Set Simulation Experiment Test of OCSVM-DPoS Distribution Network Collaborative Security Protection Model
The study first carried out simulation experiments using the node network of the IEEE14 power distribution system to test the intrusion detection efficiency and performance of the OCSVM-DPoS model. The specific environmental parameters and model parameters of the experiment are shown in Table 1.
Table 1 Specific environmental parameters and model parameters for the experiment
| Experimental Environment Parameters | Model Parameters | ||
| Operating system | Windows10 64bit | Range of correlation matrix | [2.5–3] |
| Central Unit | Inter(R) i7-6700HQ | Relationship vector | [1,0,1,0] |
| Line software | Matlab R2019b | Node selection probability | [0.25–0.75] |
| Model platform | Pycharm | Maximum number of training sessions | 400 |
| Data acquisition | Matpower | Difficulty coefficient | [163, 165] |
| Total number of data samples | 10,000 | Operation plan cycle | 24 h |
In Table 1, Relationship vector represents the energy impact relationship vector between the detection target obtained by distributed nodes and other nodes. If there is energy exchange or influence between microgrid A and microgrid B, then the relationship vector of microgrid A is 1, and it is selected as the detection target node. And Difficulty coefficient represents the allocation of difficulty coefficients. The lower the difficulty of the hash operation of the detection node, the more likely it is to be selected as the preferred target. The higher the difficulty, the lower the probability of being selected. Finally, the Operation plan cycle represents the maximum tolerable running time. If no results are obtained after 24 hours, the system immediately selects the microgrid with the second highest correlation to replace the existing node as the new recording node, ensuring the real-time and fault tolerance of the system.
Based on the experimental environment in Table 1, the study aims to modify the distribution scenario of IEEE14 by expanding the five load nodes in the system into independent microgrid units. Each microgrid is equipped with distributed photovoltaics, small wind turbines, energy storage devices, and controllable loads, forming a distribution testing system with multiple microgrids. The transformed system topology, power interaction characteristics, and operating mode all conform to the physical characteristics of typical multi microgrid distribution systems, which can effectively verify the detection performance of the proposed model.
The experiment generates system operation data using Matpower tool, with a sampling interval set to 1 second, and collects continuous time series data; Each detection sample is a feature window consisting of 5 consecutive sampling points, generating a total of 10000 valid samples. The information flow of the dataset contains six dimensional features, namely source MAC address, destination MAC address, source IP address, destination IP address, source port, and destination port; Meanwhile, the energy flow of the data contains six dimensional features, namely node voltage amplitude, branch current amplitude, distributed power output power, load consumption power, microgrid operation mode, and microgrid interaction power.
The research sample data is generated by using power flow calculation method on the topology structure of IEEE14 to produce circuit state data. In the dataset construction, false data injection attacks were injected into 4000 sets of samples, while the remaining 6000 sets were normal running samples. The training and testing sets are divided into time series, with the top 90% of the time series data selected as the training set (a total of 9000 groups) and the bottom 10% of the time series data selected as the testing set (a total of 1000 groups) to avoid data leakage caused by random partitioning. In response to the imbalanced class characteristics of the dataset, this paper adopts the OCSVM single class classification framework to naturally adapt to scenarios with significant differences in the number of positive and negative samples. At the same time, SMOTE oversampling is used to supplement the abnormal samples in the training set to ensure sufficient learning of abnormal features. Afterwards, the study compared the accuracy and time-consuming of the training process between the traditional SVM model and the OCSVM, as presented in Figure 5.
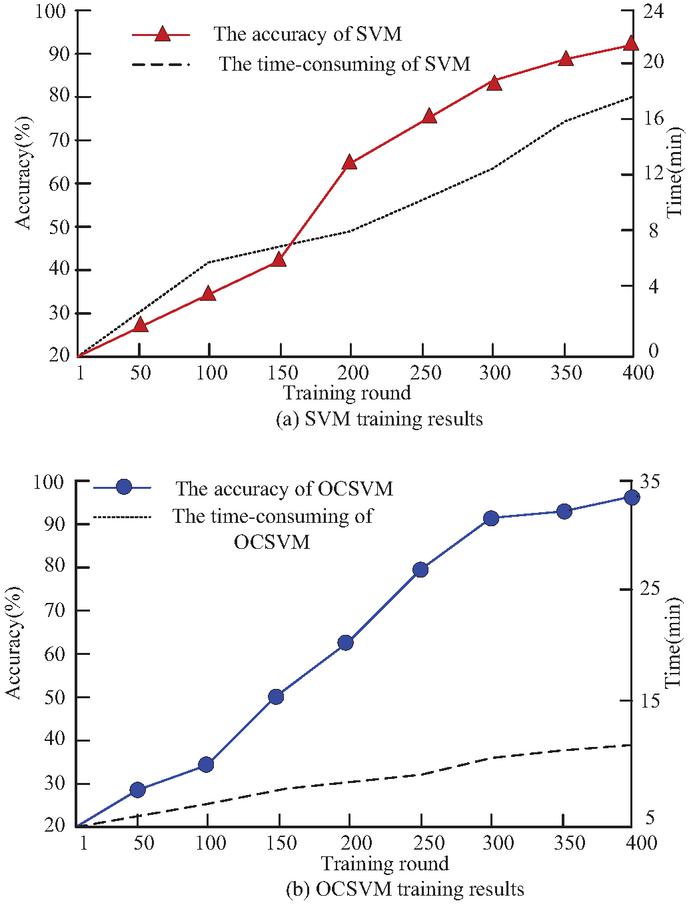
Figure 5 The accuracy and time consumption of traditional SVM model and OCSVM model in the training process.
From Figure 5(a), during the training process of the SVM model, the highest detection accuracy among the algorithm models was 91.65%, and the total time taken to complete 400 rounds of training was 17.6 minutes. From Figure 5(b), the improved OCSVM model required 11.5 minutes to complete model training, and the highest detection accuracy was 96.20%. Experimental results show that in the training samples of the IEEE14 power distribution system line data set, the attack detection rate of the improved OCSVM model was 4.55% higher than that of the traditional SVM algorithm. In terms of model training efficiency, the OCSVM model was 6.1 minutes faster than that of the SVM algorithm. Afterwards, the study conducted ablation experiments on different optimization measures. The study set the probability density of injected attack data of 0.1 and 1 to low density and high density, respectively, and compared the results of the optimization methods under different attack modes, as shown in Table 2.
Table 2 Ablation experiment of OCSVM-DPoS distribution network collaborative security protection model
| SVM | Low Probability Density | High Probability Density | |||
| False | False | ||||
| Accuracy | Negative | Accuracy | Negative | ||
| DPoS | OCSVM | (%) | Rate (%) | (%) | Rate (%) |
| 92.1 | 8.3 | 95.3 | 13.5 | ||
| 92.3 | 2.7 | 95.5 | 2.9 | ||
| 94.5 | 5.4 | 98.5 | 7.4 | ||
| 95.1 | 1.6 | 99.1 | 1.9 | ||
From Table 2, the detection accuracy of the traditional SVM model in low probability density was 92.1%, and the false negative rate was 8.3%. In the probability density attack, the detection accuracy of traditional SVM was 95.3%, and the false negative rate was 13.5%. The detection accuracy of the DPoS-optimized method under different probability densities was 92.3% and 95.5%, respectively, and the false negative rate was 2.7% and 2.9%, respectively. The detection accuracy of the OCSVM-optimized method under different probability densities was 94.5% and 98.5%, respectively, and the false negative rates were 5.4% and 7.4%, respectively. In the end, under all optimization conditions, the detection accuracy rates of the model under different probability densities were 95.1% and 99.1%, respectively, and the false negative rates were 1.6% and 1.9%. The optimization measures enhance the intrusion detection performance of SVM. Afterwards, the study compared the performance of BiLSTM, Graph Convolution Neural Network (GCNN) and OCSVM-DPoS, as presented in Figure 6.
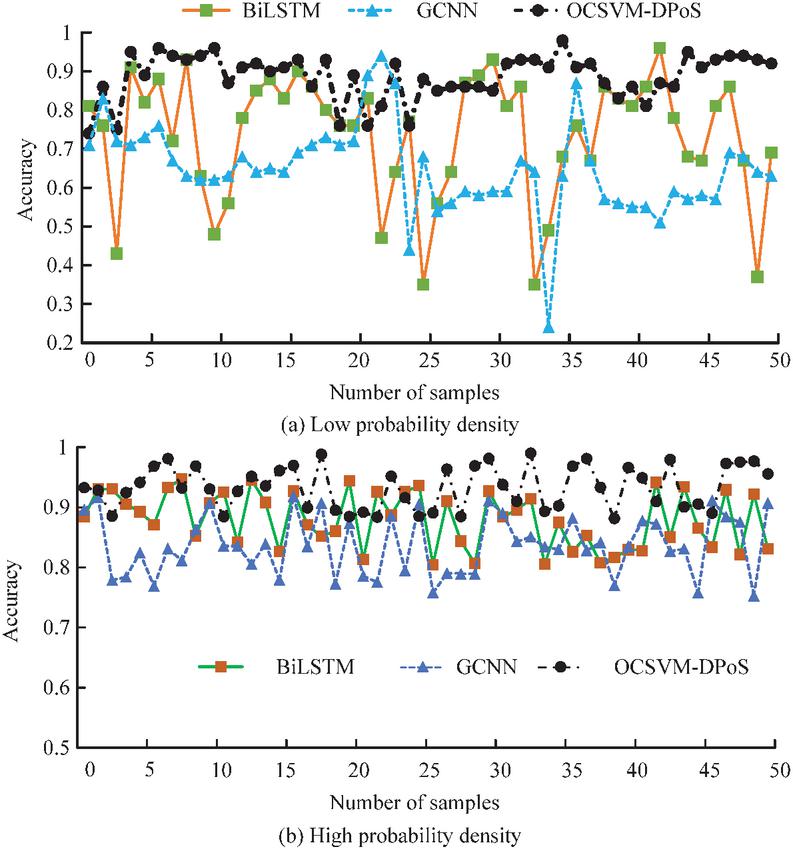
Figure 6 Performance comparison of different algorithm models in the test dataset.
In Figure 6(a), among 50 sample data with low attack probability density, the highest accuracy of the OCSVM-DPoS was 0.972, the lowest accuracy was 0.733, and the average accuracy was as high as 0.954. The highest accuracy of BiLSTM was 0.961, the lowest accuracy was only 0.349, and the average accuracy was 0.764. For the GCNN, the highest accuracy was 0.959, the lowest accuracy was 0.261, and the average was 0.655. From Figure 6(b), among 50 sample data with high attack probability density, the highest accuracy of BiLSTM was 0.947, and the average was 0.879. Among the GCNN intrusion detection models, the highest accuracy was 0.918 and the average accuracy was 0.837. The highest accuracy of the OCSVM-DPoS model was 0.989, and the average accuracy was 0.933. The OCSVM-DPoS is superior to the other two models in detection accuracy.
4.2 Line Experimental Test of OCSVM-DPoS Distribution Network Collaborative Security Protection Model
To explore the collaborative intrusion detection performance of the OCSVM-DPoS model in distributed multi-microgrid power distribution systems, the study used Matlab R2019b and Simulink to build simulated multi-microgrid power distribution system lines, and collected data to conduct experiments. The experimental objects and environmental parameters are presented in Table 3.
Table 3 Experimental environment and microgrid system parameters.
| Experimental Environment Parameters | Microgrid Devices and Parameters | ||
| Line simulation software | Matlab R2019b | Wind power | 10–30 kW |
| Micro network construction | Simulink | Photovoltaic | 5–10 kW |
| Transmission mode | TCP | Diesel | 180–220 kW |
| Wide Network | OPENT | Energy Storage System | 0–30 kW |
| Number of microgrids | 4 | Fixed load | 40–120 kW |
| Attack method | Tampering attack/Replay attack | Adjust load | 30–120 kW |
In addition to the experimental environment and object data in Table 3, the OCSVM-DPoS model parameter data constructed in the study follows the data in Table 1. In the collaborative proposal test, the study first compared the detection accuracy of BiLSTM, convolutional neural network combined with BiLSTM (CNN-BiLSTM) and OCSVM-DPoS for different attack methods. The specific experimental results are shown in Figure 7.
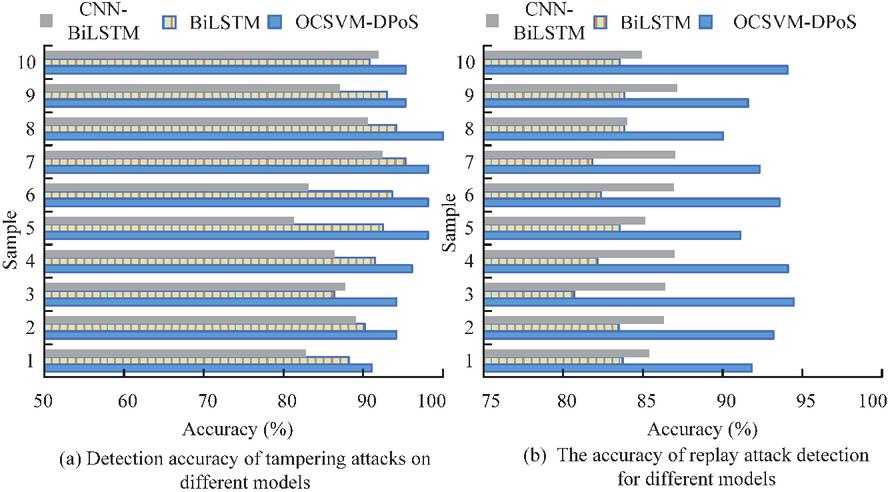
Figure 7 The detection accuracy of different models for different attack methods.
From Figure 7(a), the average detection rate of the OCSVM-DPoS model against tampering attacks was 93.46%, the average detection rate of the CNN-BiLSTM model was 85.72%, and the average detection rate of the BiLSTM model was 87.61%. From Figure 7(b), the average detection rate of the OCSVM-DPoS model for replay attacks was 93.50%, the average detection rate of the CNN-BiLSTM model was 85.56%, and the average detection rate of the BiLSTM model was 83.11%. Experimental results show that the OCSVM-DPoS model still has the highest intrusion detection performance in multi-microgrid systems. Afterwards, the attack detection performance of the model for energy flow was analyzed. The study specifically compared the detection performance of different models under different voltage attack intensities. The specific experimental results are shown in Figure 8.
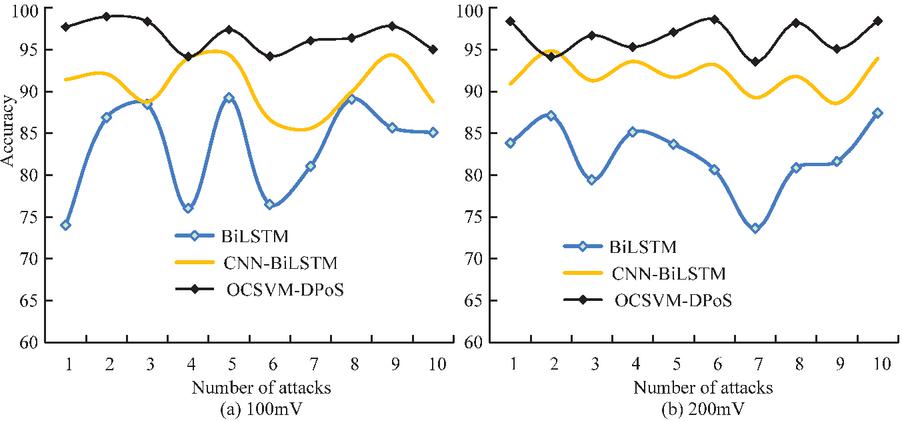
Figure 8 Detection performance of different models under different voltage attack intensities.
From Figure 8(a), under the 100mV voltage attack intensity, the average detection rate of the BiLSTM model was 83.20%, the average detection rate of the CNN-BiLSTM model was 90.59%, and the average detection accuracy of the OCSVM-DPoS model was 96.61%. From Figure 8(b), under the 200mV voltage attack intensity, the average detection rate of the BiLSTM model was 82.34%, the average detection rate of the CNN-BiLSTM model was 91.91%, and the average detection accuracy of the OCSVM-DPoS model was 96.54%. Experimental results show that under different voltage attack intensities, the OCSVM-DPoS model has the highest attack detection accuracy. Finally, the study compared the detection performance of different models under different current attack intensities, as presented in Table 4.
Table 4 Detection performance of different models under different current attack intensities
| Attack pattern | 100 mA | 200 mA | ||||
| CNN- | OCSVM- | CNN- | OCSVM- | |||
| BiLSTM | BiLSTM | DPoS | BiLSTM | BiLSTM | DPoS | |
| Samples | (%) | (%) | (%) | (%) | (%) | (%) |
| 1 | 71.534 | 80.404 | 95.524 | 71.178 | 84.555 | 96.115 |
| 2 | 75.053 | 80.673 | 92.608 | 76.051 | 83.806 | 98.622 |
| 3 | 71.430 | 83.936 | 91.315 | 79.402 | 92.011 | 98.022 |
| 4 | 74.722 | 81.018 | 95.938 | 72.013 | 90.865 | 93.787 |
| 5 | 71.459 | 87.613 | 91.477 | 71.855 | 90.404 | 98.415 |
| 6 | 72.729 | 87.916 | 92.157 | 76.129 | 88.963 | 98.208 |
| 7 | 76.547 | 85.850 | 91.710 | 72.132 | 90.469 | 98.228 |
| 8 | 78.293 | 87.147 | 95.482 | 79.829 | 84.977 | 94.477 |
| 9 | 70.868 | 82.635 | 93.120 | 76.287 | 91.577 | 96.795 |
| 10 | 78.353 | 83.902 | 91.969 | 80.683 | 83.448 | 94.332 |
From Table 4, under the 100 mA current attack intensity, the average detection rate of the BiLSTM model was 74.10%, the CNN-BiLSTM was 84.11%, and the OCSVM-DPoS model was 93.13%. Under the 200 mA current attack intensity, the average detection rate of the BiLSTM model was 75.56%, the CNN-BiLSTM model was 88.11%, and the OCSVM-DPoS model was 96.70%. Under different current attack intensities, the OCSVM-DPoS model has the highest attack detection accuracy.
5 Conclusion
The research builds a distributed power grid collaborative detection model that integrates the OCSVM algorithm and blockchain DPoS consensus technology. In the IEEE14 line data set experiment, the OCSVM-DPoS model took 400 rounds of training in 11.5 minutes, and the highest detection accuracy was 96.20%, which was better than that of the traditional SVM. In the low attack density sample, the highest accuracy of the OCSVM-DPoS model was 0.972, the lowest accuracy was 0.733, and the average accuracy was as high as 0.954. In the sample data with high attack probability density, the highest accuracy of the OCSVM-DPoS model was 0.989, and the average accuracy was 0.933. In addition, in the multi-microgrid line experiment, the average detection rate of the OCSVM-DPoS model for tampering attacks was 93.46%, and the average detection rate for replay attacks was 93.50%. Therefore, under different current and voltage attack intensities, the average detection accuracy of the OCSVM-DPoS is higher than other models. The shortcoming of the research is that the security protection system of multi-microgrids constructed in this study only explores attack detection, but fails to explore the control of the power distribution system under attack. Therefore, subsequent research will expand the model and jointly explore intrusion detection and control methods for distributed microgrid power distribution systems.
References
[1] Q. Lu, K. An, J. Li, J. Wang, ‘Network intrusion detection for modern smart grids based on adaptive online incremental learning’, IEEE Trans. Smart Grid, vol. 16, no. 3, pp. 2541–2553, Feb., 2025.
[2] Z. S. Khalafi, M. Dehghani, A. Khalili, A. Sami, N. Vafamand, T. Dragičević, ‘Intrusion detection, measurement correction, and attack localization of PMU networks’, IEEE Trans. Ind. Electron., vol. 69, no. 5, pp. 4697–4706, May, 2022.
[3] M. Xiao, Q. Zhou, Z. Zhang, J. Yin, ‘Real-time intrusion detection in power grids using deep learning: Ensuring dpu data security’, HighTech Innov. J., vol. 5, no. 3, pp. 814–827, Sep., 2024.
[4] O. A. Agboola, J. C. Ogeawuchi, O. E. Akpe, A. A. Abayomi, ‘A conceptual model for integrating cybersecurity and intrusion detection architecture into grid modernization initiatives’, Int. J. Multidiscip. Res. Grow. Eval., vol. 3, no. 1, pp. 1099–1105, Jan., 2022.
[5] S. Bi, J. Wang, J. Song, P. Li, L. Li, ‘Research on the intrusion detection model for power internet of things combining deep belief network and BiLSTM’, J. Cyber Secur. Mobility, vol. 14, no. 3, pp. 653–672, May., 2025.
[6] A. Aljohani, M. AlMuhaini, H. V. Poor, H. M. Binqadhi, ‘A deep learning-based cyber intrusion detection and mitigation system for smart grids’, IEEE Trans. Artif. Intell., vol. 5, no. 8, pp. 3902–3914, Jan., 2024.
[7] D. Upadhyay, J. Manero, M. Zaman, S. Sampalli, ‘Gradient boosting feature selection with machine learning classifiers for intrusion detection on power grids’, IEEE Trans. Netw. Serv. Manage., vol. 18, no. 1, pp. 1104–1116, Oct., 2021.
[8] J. Azimjonov, T. Kim, ‘A comprehensive empirical analysis of data sets, regression-based feature selectors, and linear svm classifiers for intrusion detection systems’, IEEE Int. Things J., vol. 11, no. 12, pp. 34676–34693, Jun., 2024.
[9] S. Amaran, R. M. Mohan, R. Jebakumar, ‘Optimal machine learning based intrusion detection system in wireless sensor networks for surveillance applications’, J. Mob. Multimed., vol. 19, no. 2, pp. 437–450, Mar., 2023.
[10] T. DasT, R. M. Shukla, S. Sengupta, ‘Poisoning the well: Adversarial poisoning on ML-based software-defined network intrusion detection systems’, IEEE Trans. Netw. Sci. Eng., vol. 12, no. 1, pp. 252–262, Nov., 2025.
[11] Z. Serat, S. A. Z. Fatemi, S. Shirzad, ‘Design and economic analysis of on-grid solar rooftop PV system using PVsyst software’, Arch. Advan. Eng. Sci., vol. 1, no. 1, pp. 63–76, Mar., 2023.
[12] C. C. Sun, D. J. Sebastian Cardenas, A. Hahn, C. C. Liu, ‘Intrusion detection for Cybersecurity of smart meters’, IEEE Trans. Smart Grid, vol. 12, no. 1, pp. 612–622, Jul., 2021.
[13] D. Upadhyay, J. Manero, M. Zaman, S. Sampalli, ‘Intrusion detection in SCADA based power grids: Recursive feature elimination model with majority vote ensemble algorithm’, IEEE Trans. Netw. Sci. Eng., vol. 8, no. 3, pp. 2559–2574, Jul., 2021.
[14] A. Presekal, A. Ştefanov, I. Semertzis, P. Palensky, ‘Spatio-temporal advanced persistent threat detection and correlation for cyber-physical power systems using enhanced GC-LSTM’, IEEE Trans. Smart Grid, vol. 16, no. 2, pp. 1654–1666, Oct., 2025.
[15] W, Wang, X, Du, D, Shan, R, Qin, N. Wang, ‘Cloud intrusion detection method based on stacked contractive auto-encoder and support vector machine’, IEEE Trans. Cloud Comput., vol. 10, no. 3, pp. 1634–1646, Jun., 2022.
[16] Z, Lv, J. Wan, ‘Intrusion detection in wireless sensor networks based on IPSO-SVM algorithm’, J. Cyber Secur. Mob., vol. 13, no. 4, pp. 803–822, Jul., 2024.
[17] P. He, Z. Zhu, X. Wang, C. Zhang, W. Yuan, and J. Hao, ‘Research on Supervision System of Power Safety Tools and Equipment Based on Internet of Things Technology’, DGAEJ, vol. 38, no. 04, pp. 1223–1254, May 2023.
[18] G. Abdelmoumin, D. B. Rawat, A. Rahman, ‘On the performance of machine learning models for anomaly-based intelligent intrusion detection systems for the internet of things’, IEEE Int. Things J., vol. 9, no. 6, pp. 4280–4290, Aug., 2022.
[19] N. Sahani, R. Zhu, J. H. Cho, C. C. Liu, ‘Machine learning-based intrusion detection for smart grid computing: A survey’, ACM Trans. Cyber-Phys. Syst., vol. 7, no. 2, pp. 1–31, Apr., 2023.
[20] N. N. Reddy, R. Velpula, P. Raja, and S. Moorthi, ‘Protection Algorithm for Fault Identification and Isolation in DC Microgrid’, DGAEJ, vol. 38, no. 02, pp. 691–714, Jan. 2023.
Biographies

Xiujuan Meng born in 1988 in Shouguang, Shandong Province, China, is currently a lecturer at Weifang Engineering Vocational College. She holds a master’s degree from the University of Shanghai for Science and Technology. Her primary research focuses on mechatronics technology.

Ke Zhang born in 1987 in Shouguang, Shandong of China, is currently a lecturer at Weifang Engineering Vocational College. He holds both bachelor’s and master’s degrees from Hefei University of Technology. Her primary research focuses on nonlinear dynamics and intelligent control of mechatronic systems.

Liping Zhang received her Bachelor of Engineering degree from Shandong University of Technology in 2006 and her Master of Engineering degree from the same university in 2010. She currently serves as an Associate Professor at the School of Mechanical and Electrical Engineering, Weifang Engineering Vocational College. Her research areas include advanced manufacturing technology, nanofabrication, and related fields.
Distributed Generation & Alternative Energy Journal, Vol. 41_5, 1391–1416
doi: 10.13052/dgaej2156-3306.4157
© 2026 River Publishers