Stability Analysis of Transformer Mechanism Model Based on Finite Element Analysis Under Load Fluctuations
Li Xun and Tang Jie*
Digital Intelligence Operation Center, Guizhou Power Grid Co., Ltd., Guiyang 550000, Guizhou, China
E-mail: lixun8266687@163.com; tangjie159@outlook.com;
644653@qq.com; 18217063652@163.com
*Corresponding Author
Received 09 March 2026; Accepted 10 April 2026
Abstract
This study investigates the mechanical stability of power transformers subjected to fluctuating load currents, which induce dynamic electromagnetic forces that can lead to mechanical vibrations and potentially compromise the transformer’s structural integrity. Traditional methods often overlook time-varying loads and fully coupled electromagnetic-mechanical interactions, which limits the accuracy of stability assessments in realistic operational conditions. This method introduces a novel coupled finite element framework that simultaneously models electromagnetic and mechanical interactions under fluctuating load conditions. Unlike conventional electromechanical approaches, the proposed method captures time-dependent force variations and their direct impact on structural stability, enabling more accurate and realistic transformer stability assessment. External load profiles range from 48.8% to 120% of the rated load. The electromagnetic forces are calculated using the Maxwell stress tensor method, yielding a total integrated force of 4157.24 N. The maximum magnetic flux density is found to be 1.8458 T, well below the saturation point, and the core experiences a maximum electromagnetic stress of 95.91 Pa, which is significantly lower than the material yield strength of 350 MPa, resulting in a safety factor of over 3.6 106. The mechanical analysis shows a maximum displacement of 0.543 m and a total RMS vibration amplitude of 0.291 m. The modal analysis reveals a natural frequency of 66.69 Hz, distinct from the main electromagnetic excitation frequency of 120 Hz, indicating a low risk of resonance. Overall, the results confirm that the proposed framework accurately models the electromechanical behavior of transformers under fluctuating load conditions, ensuring their mechanical stability.
Keywords: Finite element analysis, transformer stability, load fluctuation, electromechanical coupling, vibration response.
1 Introduction
Power transformers are indispensable parts of the electrical power systems. Their mechanical stability is closely related to how reliable the whole system is and how long it will last [1]. An ordinary transformer works under the influence of electromagnetic forces that are a result of current variations in the load [2]. These electromagnetic forces create mechanical vibrations in the windings and other structural parts [3]. The mechanical vibrations may accumulate over a period and cause either deformation or failure of insulation. With the increase of fluctuating loads in modern power grids, the transformers have to frequently operate in dynamic conditions [4]. The traditional design methods concentrate mainly on electrical performance while ignoring the mechanical stability under transient loads [5]. Mechanical instability possibly causes to vibrate excessively, resonance, and eventually suffer catastrophic failure [6]. The more load fluctuations, the more accurate the transformer stability needs to be assessed. Finite element analysis is a very useful method that can be used to model the very complicated electromagnetic and mechanical interactions precisely [7]. A detailed framework is necessary for the evaluation of the transformers’ behavior at the realistic operating conditions. The research of this present paper is in line with fulfilling this crucial need [8].
Various techniques have been utilized in the analysis of vibrations and stability characteristics of transformers. Amongst these techniques, Frequency Response Analysis (FRA) is the most common one for the detection of winding deformation based on frequency-domain signatures [9]. On the other hand, vibration monitoring techniques are based on the analysis of acceleration and acoustic signals for the purpose of fault diagnosis [10]. Natural frequencies and resonances have also been determined through the application of modal analysis and experimental vibration testing, among other methods. Another common practice is combining short-circuit testing with analytical electrodynamic force calculations. In some studies, the use of time-domain simulation with simplified lumped-parameter models has been reported. Nevertheless, most of these methods impose steady-state loading conditions. Coupling effects of electromagnetic and mechanical aspects are also often neglected by the majority of the approaches [11]. Moreover, the cost and complexity of implementation for experimental methods are high, especially for online monitoring. Signal-based methods are highly susceptible to noise and other unfavourable operating conditions. Also, the impact of load fluctuations is infrequently considered. All these limitations lead to the inability to accurately assess the stability of the system. Existing studies do not adequately integrate time-varying load conditions with fully coupled electromagnetic–mechanical interactions. The present methods are restricted in their ability to function during dynamic situations because they either depend on constant state assumptions or they treat physical systems as separate entities. This research introduces a coupled finite element-based framework to solve this existing problem. It provides precise assessment of transformer stability through its ability to simulate actual load variations.
In order to make it easier to cope with those disadvantages, the present research work suggests a stability analysis framework based on finite elements for transformer mechanisms subjected to load changes. The new approach involves the modeling of the electromagnetic field together with the analysis of the mechanical dynamic accomplished by a physic-mathematics coupling. Load changes and current variations are modeled in an explicit way to reflect the actual operating conditions accurately. A coupled FEM technique is used to calculate the time-varying electromagnetic forces. These forces are then transmitted to the mechanical model for evaluation of the vibration responses of the structure to the forces. Both time-domain and frequency-domain methods are used to analyze stability. A special stability check mechanism is included to point out the critical working conditions. The new framework demonstrates the electromechanical interactions dynamically in contrast to existing methods. It does not depend on experimental or signal-based techniques. The new idea is in the simultaneous modeling of load variations in the FEM. It delivers a more precise and therefore a more robust stability evaluation.
1.1 Research Objectives
• To establish a complete finite element-based system for the examination of the mechanical stability of transformer mechanisms subjected to load fluctuations through electromagnetic-mechanical modeling.
• To take transformer data specifications, material properties, geometrical parameters, and load-induced current variation data as the core dataset for the proposed framework in modelling and simulation.
• The use of the finite element method is not only for the representation of the electromagnetic field and the calculation of the time-dependent electromagnetic forces but also for the investigation of circuit behavior and load fluctuation effects.
• Towards carrying out the electromagnetic-mechanical coupling and stability evaluation in both time and frequency domains regarding the transformer mechanism’s mechanical vibration response.
1.2 Research Organizations
• In Section 2, a complete review of the literature related to electromagnetic-mechanical modeling and vibration-based transformer stability is presented.
• The suggested research methodology in Section 3 is described based on the finite element approach, including modeling of load oscillations and coupling of electro- mechanical processes.
• The analysis of mechanical stability in the time and frequency domains as well as the simulation results are presented in Section 4.
• In Section 5, the paper is concluded with a summary of the major findings and recommendations for future research.
2 Literature Review
Electromagnetic–Mechanical Modeling of Transformer Vibration Characteristics
Suassuna de Andrade Ferreira et al. [12] have investigated the mechanical performance of transformers during the operation of energizing their magnetic circuits, otherwise referred to as operational electromagnetic excitations, to find out the structural reliability. They used finite element method–based electromagnetic and structural simulations to carry out the studies and to find the vibration responses. Nevertheless, the system was limited to a stationary operation and did not include the analysis of dynamic stability induced by load fluctuations. Wang et al. [13] performed measurements and analysis of transformer winding vibration characteristics with the aim of condition monitoring and fault detection. The vibration signal analysis was the main component of the method combined with the frequency-domain feature extraction techniques. The process was very dependent on signal processing and did not include a physically coupled electromagnetic–mechanical FEM-based stability evaluation. Mohanarangan Veerappermal Devarajan [14] proposes an improved Backpropagation Neural Network combined with game theory to optimize cloud workload forecasting and SLA alignment using Nash equilibrium. Inspired by this, our proposed method adapts neural prediction strategies to enhance resource efficiency and forecasting accuracy.
Vibration Signal–Based Condition Monitoring and Fault Diagnosis Approaches
Zou et al. [15] The researchers carried out a research on the electromechanical interactions in transformer windings with the purpose of discovering the vibration mechanisms. They applied Multiphysics finite element modeling in their methodology to calculate not only electromagnetic forces but also structural responses fairly accurately. On the other hand, the present study did not consider time-dependent load variations and did not give a continuous evaluation under dynamic conditions. Transformer fault diagnosis by chen et al. [16] was articulated with mechanical vibrations. Vibration features extracted from the machine were passed through various machine learning models, and the faults got classified based on that. Even though the framework was pretty successful in diagnosis, it did not take the underlying electromechanical coupling or load-induced stability phenomena into consideration.
Finite Element–Based Structural and Fault-Oriented Transformer Analysis
Chen [17] made use of numerical modeling techniques in the study of transformer reliability regarding structural support. They further carried out the testing by making use of mechanical finite element simulations with the electromagnetic force distributions as the only assumption. But they simplified the calculations of electromagnetic forces, and also, the load fluctuation effects were not modelled explicitly. Pan et al. [18] Such a study was carried out with the aim of giving an analysis of the transformer windings deformation and the corresponding vibration responses from short circuits. The approach taken was quite sophisticated as it related to the computation of the transient electromagnetic forces and their interplay with the structure. However, the whole framework was limited to faulty scenarios, so it did not consider normal-operation stability when loads fluctuated. Li and others [19] introduced the vibration-based technique for the monitoring of transformer condition. Apart from that, signal decomposition and analysis of the frequency spectrum were applied to extract the vibration patterns that were not normal. The method was very prone to noise and was not combined with the physics-based finite element modeling.
Limitations of Existing Methods in Addressing Load Fluctuation–Induced Stability
Zhang and others [20] focused on the dynamics of transformer windings by means of modal as well as harmonic response analysis. They used finite element methods to determine the natural frequencies as well as the resonance behavior. Nevertheless, the research relied on the assumption of a constant load and thus did not consider the dynamic excitation due to load fluctuations. Seddik [21] performed research on the vibration and stress features of transformers with electromagnetic loading. The study employed numerical simulation of the mechanical stress distributions. However, the model did not conduct time-frequency stability analysis and did not consider circuit-level load variations. Zhang and others [22] studied the transmission of vibration in transformers and characteristics of mechanical faults. The combination of experimental vibration measurement and analytical modeling was the methodology for the investigation of fault signatures. The method was very demanding in terms of experiments and did not deliver a coherent FEM-based framework for stability analysis under load fluctuations.
3 Research Design
The proposed framework starts with the gathering of specifications of transformers such as rated voltage, frequency, and operating conditions, which are essential for the accurate creation of numerical models. The data are then subjected to several treatment processes: first, the calibration and then the definition of the boundary conditions and mesh generation of the finite element. In the structural finite element model, detailed boundary conditions were applied to represent the physical constraints of the transformer assembly. The transformer core was assumed to be fixed at the base support, restricting all translational and rotational degrees of freedom. The windings were modeled with partially constrained (pinned) supports, allowing limited axial and radial deformation under operational loads. These boundary conditions ensure realistic simulation of mechanical stability and accurately capture the structural response under fluctuating electromagnetic forces. The load fluctuation modeling follows to depict the realistic shifts in the operating conditions which directly affect the circuit. thus, the current is varying. The generated current profiles are then treated as dynamic excitation inputs for the finite element model, thus making it possible to compute realistic electromagnetic forces. The coupling of electromagnetic with mechanical forces leads to the calculated forces being transferred to the mechanical domain for the purpose of capturing the transformer components’ structural response. By adopting this integrated modeling approach, it is guaranteed that no matter electrical or mechanical effects, all will be taken into account at once.
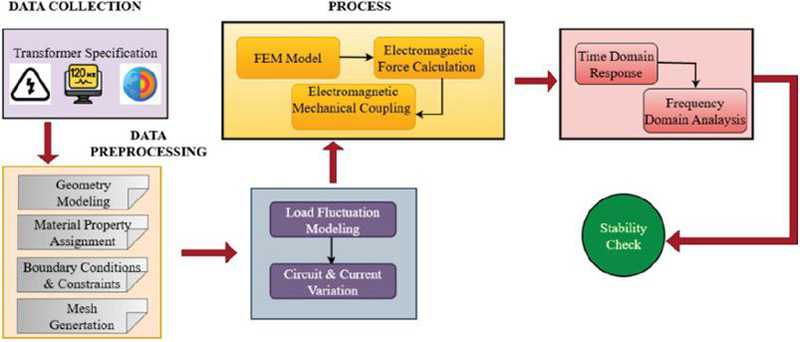
Figure 1 Proposed methodology for transformer stability under load fluctuations.
The procedure shown in Figure 1 consists of a linked finite element method, then time-domain, and frequency-domain analysis to take into account the vibration properties with load variations. The response in the time-domain reveals the transient vibration behavior, and the frequency-domain analysis provides information on the dominant frequency components and potential resonance. A stability check module is then activated based on these responses, which evaluates the transformer mechanism’s resistance to mechanical stress during dynamic excitation. The feedback loop permits an assessment to be repeated up to the point where it is assured that stability conditions are satisfied during the various operating modes. The systematic structure enables to obtain a comprehensive stability analysis by integrating the load fluctuation modeling, Multiphysics coupling, and dynamic response analysis into one finite element-based method.
3.1 Transformer Design
The mechanical configuration of a three-phase transformer, which is represented in Figure 2, consists of three vertically arranged winding assemblies placed between two clamping structures, one upper and one lower, respectively. These clamping frames give axial support and maintain the windings correct position during use, whereas the cylindrical winding shape together with the symmetrical phase arrangement makes for an even distribution of electromagnetic forces and very good mechanical behavior under both normal and fluctuating load conditions. The transformer core is modeled using 35Q165 grain-oriented silicon steel with magnetostrictive properties incorporated via constitutive parameters derived from manufacturer data. The magnetostrictive strain is represented by the nonlinear relation , where k 2.1 10-6 m2/T2, capturing the core’s deformation under varying magnetic flux density. This nonlinear coefficient allows the finite element model to account for dynamic magnetostrictive effects and ensures accurate prediction of vibration and mechanical response under fluctuating load conditions.
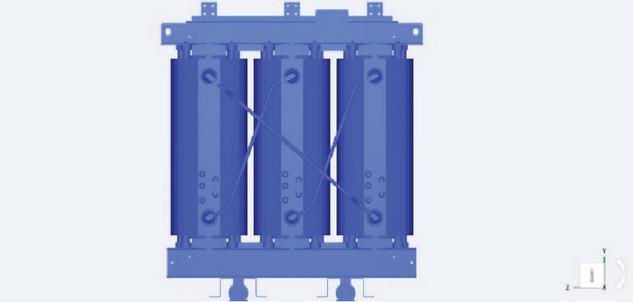
Figure 2 Three-phase transformer mechanical structure with inter-phase bracing.
The diagonal inter-phase bracing system that connects the adjacent winding not only increases the overall stiffness of the transformer structure but also limits the relative displacement between the phases and reduces the vibration caused by the time-varying electromagnetic forces. The dynamic forces are thus transferred to the mechanical support network of the design, which minimizes the risk of resonance and enhances the long-term mechanical stability and reliability of the transformer under dynamic operating conditions.
The transformer windings are modeled using 3D hexahedral elements. The core of the device uses tetrahedral elements for its full geometric representation. A mesh refinement study assessed output changes by testing increasingly smaller element sizes until magnetic flux density and electromagnetic force results showed less than 1% variation. The verification process confirms that the finite element results demonstrate high accuracy and reliability, which remains consistent regardless of mesh density.
4 Study of the Mechanical Stability Mechanism of Transformer Windings Under Load Fluctuations
4.1 Electromagnetic Force Generation Under Variable Load
The vibration behavior of a transformer is a result of the interaction of various electromagnetic force components which are generated during the operation of the device. Due to the fluctuating magnetic flux, magnetostrictive forces are created in the iron core while Lorentz forces are acting on the current-carrying windings because of the electromagnetic interaction. Moreover, at the same time, windings are being excited by electromotive forces under different electrical conditions. All these forces separately and together cause vibrations in the iron core and windings, thus contributing to a complex dynamic behavior. The interaction between core and winding vibrations significantly increases the mechanical responses, particularly in the case of variable load conditions. Therefore, it is necessary to know these exciting factors very well in order to create correct models for transformer vibration and stability. The physical mechanisms generate the foundation for numerical implementation, which operates within the finite element framework. The proposed model solves electromagnetic field equations to generate time-varying and spatial distributions of magnetic flux density and current density, which are used to determine the force components that affect the transformer structure.
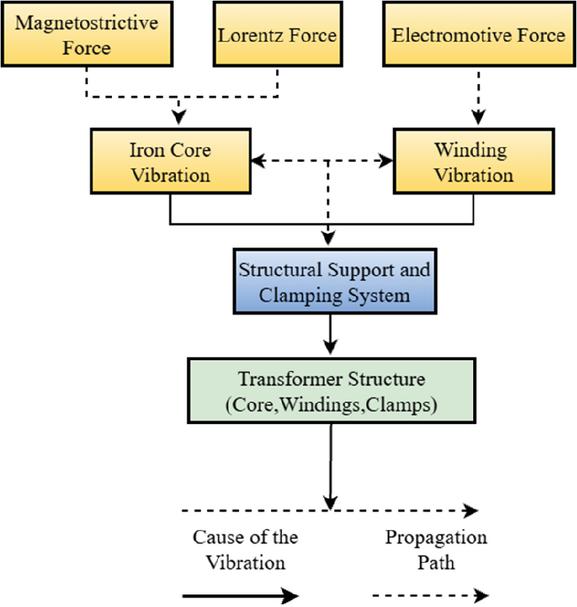
Figure 3 Electromagnetic force–induced vibration propagation in transformer structure.
As shown in Figure 3, the vibrations produced in the iron core and windings are conveyed to the whole structure of the transformer, consisting of the core, windings, and clamps, through the supporting and clamping systems. The support system between the structure and the ground is the main channel through which the vibration energy is transferred, thus determining the distribution of energy among the various parts of the assembly. The figure also shows where the vibrations come from and how they move, specifically pointing out the role of mechanical coupling in the transfer of vibrations. This way of depicting things makes it clear that in stability analysis structural constraints and supports must be taken into account. The finite element analysis can then be used to simulate the dynamic electromagnetic excitation under which the vibrations are propagated and the assessment of the transformer mechanical stability is thus made realistic.
The transformer windings under variable load conditions and thus the current flowing through them become time-dependent, indirectly causing the change in the electromagnetic field distribution within the transformer core and the windings. Alternating current passing through the windings generates a magnetic flux density in accordance with the laws of nature. The interdependence of magnetic flux density and magnetic field intensity is represented mathematically as Equation (1):
| (1) |
where is the magnetic permeability of the core material. Load variations create changes in which results in a magnetic field that is not uniform and changes with time. The field variations cause the magnetic domains in the iron core to be aligned differently leading to the periodic core deformation as the magnetostrictive forces are generated. The magnetostrictive strain is directly related to the square of the magnetic flux density and can be represented as Equation (2):
| (2) |
which elucidates the nonlinear vibration behavior of the core subjected to varying load conditions.
At the same time, the windings carrying current are subjected to Lorentz forces as a result of the interaction between the current density and the magnetic flux density . The electromagnetic force density affecting the windings is expressed as Equation (3):
| (3) |
Under the conditions of load variation, there are oscillations in both and , which bring about dynamic electromagnetic forces that stimulate the vibrations in the windings. The forces are spread out over a certain area and are passing through electromagnetic–mechanical coupling in the finite element model to the mechanical domain. The dynamic equilibrium equation controls the resulting mechanical motion as Equation (4):
| (4) |
where , , and are the mass, damping, and stiffness matrices, respectively, and is the time-dependent electromagnetic force vector. The method allows proper assessment of vibration, stability characteristics for varying loads.
4.2 Mechanical Stability Concept
Figure 4 illustrates the experimental setup designed by the author to measure vibrations using acceleration sensors installed on a pump-motor unit. At the top of the diagram, a vibration-acceleration sensor (accelerometer) is fixed to the bearing housing of the rotating machine, which captures a very important place for registering vibration signatures due to imbalance, misalignment, or bearing defects. To ensure the utmost accuracy in the transmission of mechanical vibrations, the accelerometer is tightly fixed and the sensor cable is the medium through which the data flows from the sensor to the data acquisition system. Mounting the sensor on the bearing housing allows not only direct monitoring of vibration responses generated by shaft rotation and dynamic forces due to the load but also the use of this information for condition monitoring and fault diagnosis.
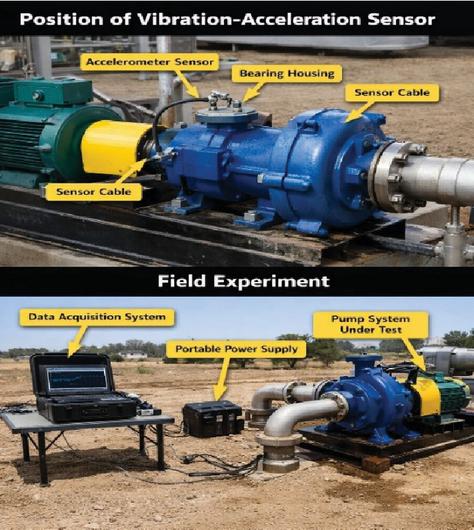
Figure 4 (top) Position of vibration-acceleration sensor. (bottom) Field Experiment.
In the bottom part of the image, the field experimental arrangement is displayed, which was used for the reception of vibration data. The pump system under test is powered by a motor and operated under real working conditions, while a portable power supply gives the necessary electrical input. The vibration signals from the accelerometer are sent to the data acquisition system, which is recording and processing the acceleration data in real time. The whole system allows the vibration behavior to be monitored continuously under different operating conditions and load changes. This kind of experimental arrangement is often used in numerical model validation, mechanical stability analysis, and the assessment of the health condition of rotating machinery by means of time- and frequency-domain vibration analysis.
Table 1 Main technical indicators and rated parameters of the transformer
| Technical Indicator | Parameter Value |
| Phase number | Three-phase |
| Rated frequency | 50 Hz |
| Rated capacity | 1000 kVA |
| Rated voltage (HV/LV) | 10,000/400 V |
| Rated current (HV/LV) | 57.74/1443.38 A |
| Connection mode | Dyn11 |
| Cooling mode | AN |
| Short-circuit impedance | 5.91% |
| Power factor (rated) | 0.8 |
| Insulation class | Class A |
| Core material | Silicon steel |
| Winding material | Copper |
| Operating temperature rise | 65∘C |
| Ambient temperature | 25∘C |
| Installation type | Indoor |
The three-phase transformer with its main technical indicators and rated parameters, which were studied in this research, is presented in the attached Table 1. These parameters serve as the basis for the following electromagnetic-mechanical modeling and stability analysis. The transformer is designed to work at a frequency of 50 Hz with a power capacity of 1000 kVA, and the rated voltages of 10,000 V on the high-voltage side and 400 V on the low-voltage side result in the rated currents of 57.74 A and 1443.38 A, respectively. The Dyn11 configuration and air-natural cooling are the common practical operating conditions for distribution transformers. The electrical features such as the short-circuit impedance of 5.91% and rated power factor of 0.8 are crucial for modeling accurately the load behavior and fault response. Moreover, the selection of Class A insulation, a silicon steel core, and copper windings shapes the thermal, magnetic, and mechanical characteristics that are necessary for the finite element simulation. The given operating temperature rise, ambient temperature, and indoor installation conditions make it possible for the numerical analysis to reflect approximately the actual service environments and, thus, to support the reliable assessment of transformer stability under load variations. The Table 1 parameters support accurate finite element modeling which enables stability evaluation. The electrical parameters establish the system’s operational framework while they determine the strength of electromagnetic forces. The material properties establish the components’ magnetic characteristics and their ability to withstand mechanical stress during testing. The thermal and environmental conditions determine both the boundary conditions and the system’s operational performance. The structural parameters of a system determine its stiffness characteristics and dynamic response properties which engineers use to evaluate system stability.
Simulation of Load Fluctuation Conditions
In order to get a correct evaluation of the performance of transformers both electrically and mechanically under real operating conditions, it is absolutely necessary to reproduce the load variation conditions. Magnetic flux distribution is directly affected by the changes in load current, and in addition to that, time-varying electromagnetic forces are being generated in the core and windings. The dynamic forces are the main cause of structural vibrations and also possible stability problems, thus, acting as a source of excitation. As a result, load fluctuation simulation allows for thorough evaluation of the transformer vibration response and mechanical reliability under real service conditions.
The time-dependent load signals used in this method are synthetically generated to represent controlled operating scenarios. Step load profiles are constructed using predefined time intervals with sudden changes in load magnitude, while composite profiles are formed by combining multiple step variations to simulate realistic demand fluctuations. These profiles are not derived from measured data but are designed to systematically evaluate the transformer response under different dynamic loading conditions.
The selection of step and composite load profiles is intended to represent practical transformer operating scenarios under dynamic conditions. Step load variations simulate sudden changes in demand, such as load switching or fault-induced disturbances, which introduce transient electromagnetic forces. In contrast, composite load profiles capture gradual and combined load variations that occur in real power systems due to fluctuating consumer demand and network conditions. Together, these profiles provide a realistic and comprehensive representation of transformer operating environments for stability assessment.
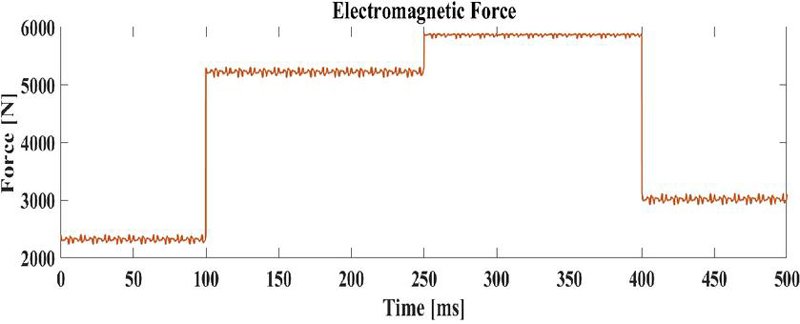
Figure 5 Time response of electromagnetic force under step excitation.
Figure 5 illustrates how the electromagnetic force changes over time when different step inputs are applied. At first, the force is kept at a low level for some time and then it increases suddenly at about 100 ms. The second step increase takes place at approximately 250 ms, leading to the highest force value. In the end, a substantial drop in force around 400 ms occurs which implies the excitation has been reduced or stopped.
Table 2 Magnetic flux density and electromagnetic force summary
| Parameter | Value |
| Peak B | 1.8458 T |
| Average B | 1.5713 T |
| Minimum B | 1.1384 T |
| B Variation (peak-to-peak) | 0.7074 T |
| Peak Force | 5875.7 N |
| Average Force | 4391.2 N |
Table 2 provides a summary of the key features of the magnetic flux and force in the system. The peak, average, and minimum values of magnetic flux density represent the operating magnetic field range. The peak-to-peak variation provides information about the degree of magnetic fluctuation during the operation. The peak force and the average force that go through them provide information about the electromagnet performance of the system.
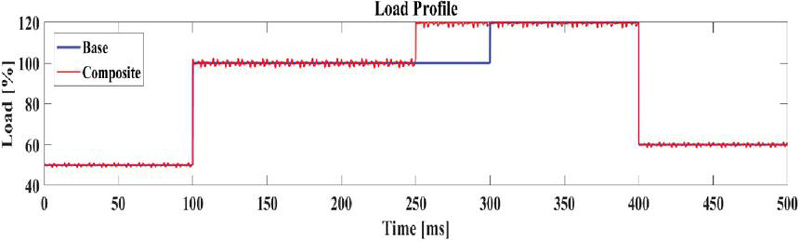
Figure 6 Time-varying load profile for base and composite systems.
Figure 6 illustrates how the load percentage for base and composite configurations changed over time. In the two situations, there is a stable initial load that gets abruptly increased at around 100 ms. The first case is then followed by an increase of the load up to the highest point between 250 and 300 ms. After that, at about 400 ms a sharp decrease in load occurs, indicating a reduced operating condition. The load variations cause electromagnetic forces to change their strength because these forces depend on the current and magnetic flux density squared. The sudden load increases produce greater force amplitudes which result in higher mechanical stress and vibration levels. The structural response stabilizes when load reduction occurs because it decreases force intensity.
Table 3 Statistical summary of load profile metrics
| Metric | Value |
| Peak Load | 120.0% |
| Minimum Load | 48.8% |
| Average Load | 87.9% |
Peak load of the system is 120.0% which means that the system operates above Table 3 nominal capacity. The minimum load is 48.8% which means that the demand condition is at the lowest level. An average load of 87.9% indicates that the system is functioning overall at a level near the rated one. The greatest load fluctuations during the operating cycle are pointed out by these values.
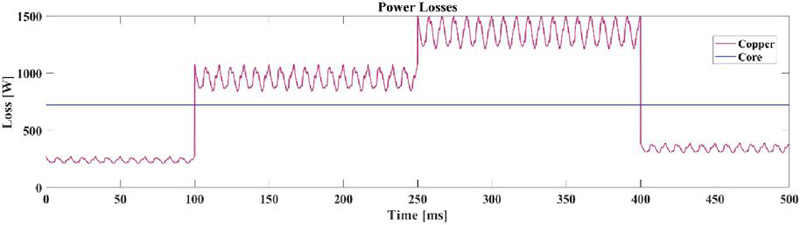
Figure 7 Time variation of copper and core power losses.
Figure 7 depicts the changes in power losses over time, distinguishing between copper and core losses. The rise in copper losses with load variations is very considerable and their drastic fluctuation is also very observable. Core losses vary only slightly over the whole operating period. thus, stable magnetic conditions are implied. The drastic drop of copper losses after 400 ms is directly related to the reduction of system load.
Table 4 Breakdown of power loss components
| Loss Type | Power (W) |
| Copper Loss | 807.8 |
| Core Loss | 721.9 |
| Total Loss | 1529.6 |
Table 4 gives an overview of the distribution of power losses in the parcel. The principal source of energy loss in the power plant is the current passing through the windings, which causes Copper loss of 807.8 W. Besides, the core loss due to magnetic hysteresis and eddy currents totals at 721.9 W. The overall power loss of the system is 1529.6 W, which is the combined electrical and magnetic losses.
Load Fluctuation Scenarios
Figure 8 illustrates the temporal comparison of three-phase current waveforms for balanced and unbalanced cases. The balanced situation means that each of the three phase currents is of equal strength and they are displaced in time by 120∘. The unbalanced situation sees the amplitudes of phases B and C going down and phase A staying the same. The resulting imbalance creates a situation of current waveforms that are not symmetrical and this can have an impact on the performance of the system.
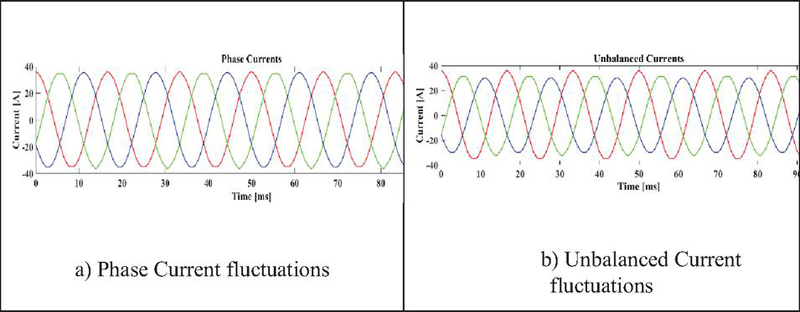
Figure 8 Balanced and unbalanced three-phase current waveforms.
Finite Element Modelling of a Transformer Under Load Fluctuations
Finite element modeling can be regarded as a powerful technique for the study of the complicated electromagnetic and mechanical characteristics of transformers with load variations. The change of load current produces electromagnetic forces that are dependent on time, which can further lead to vibrations and mechanical strains in the transformer structure. Finite element models that have the effect of load fluctuation integrated are able to depict precisely the electromagnetic field distribution, generation of forces, and structural reaction. This method not only allows the extensive assessment of transformer stability and dependability under actual working conditions but also gives the opportunity to pass the operating point checked under real conditions.
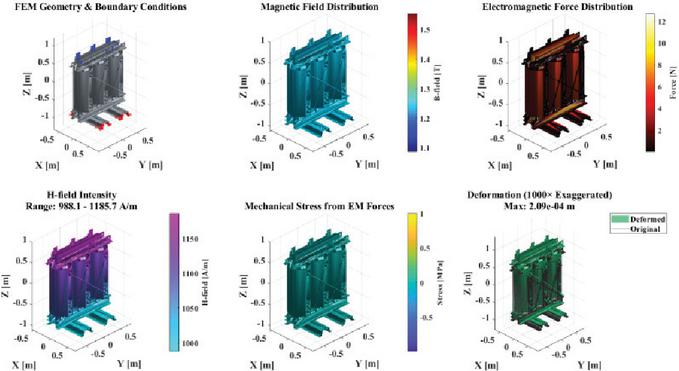
Figure 9 Multiphysics FEM analysis: electromagnetic and structural response.
Figure 9 offers a detailed analysis of the system through FEM-based Multiphysics covering the entire process from model geometry and boundary conditions to application. The illustration represents the formation of electromagnetic effects within the structure by indicating the distributions of both the magnetic field and the electromagnetic force. The H-field intensity is reflected along with the resulting mechanical stress that is associated with electromagnetic forces. Structural deformation is also depicted but in an exaggerated way so as to make the electromechanical coupling effects very clear.
Table 5 Electromagnetic force calculation summary
| Item | Value |
| Maximum Element Force | 12.6853 N |
| Minimum Element Force | 0.0000 N |
| Mean Element Force | 0.0491 N |
| Total Integrated Force | 4157.24 N |
| Method | Maxwell stress tensor |
| Formula | F (B2/2) A |
Table 5 gives a summary of the electromagnetic force results that were obtained from the finite element method using the Maxwell stress tensor method. The maximum force acting on an element is 12.6853 N, while the least force is 0.0000 N, which implies that the force distribution was extremely non-uniform over elements. The localized stress analysis demonstrates that peak stress levels occur at the inner windings and core-winding interface because of increased electromagnetic force concentration. The material experiences stress levels that remain below yield strength thus demonstrating that no structural failure risk exists. The mean force per element was 0.0491 N, which is the local force contribution averaged over the whole area. The total electromagnetic force integrated comes out to be 4157.24 N, which was calculated by means of the force relation F (B2/2) A .
Table 6 Electromagnetic stress and safety assessment
| Parameter | Value |
| EM Stress on Core | 95.9116 Pa (0.0001 MPa) |
| Yield Strength | 350 MPa |
| Safety Factor | 3,649,156.23 |
The assigned Table 6 assesses the core’s structural safety amidst electromagnetic loading. The electromagnetic-pulling core’s pressure amounts to 95.9116 Pa (0.0001 MPa), which is very much less than the material’s yield strength of 350 MPa. Therefore, the safety factor of 3,649,156.23 is produced. This proves that the core works very well with the safe mechanical limits.
Table 7 Structural deformation and strain analysis
| Parameter | Value |
| Estimated Deflection | 2.0880 10-4 m (208.7952 m) |
| Strain Estimate | 4.7956 10-10 |
The assigned Table 7 illustrates the deformation behavior of the structure that is stressed by electromagnetic forces. The predicted maximum deflection ranges from 2.0880 10-4 m (208.7952 m), which means that there is only little displacement. The corresponding strain of 4.7956 10-10 is nothing much. The presented results support that electromagnetic loading causes virtually no structural deformation.
Table 8 Vibration and dynamic stability analysis
| Parameter | Value |
| Core Mass | 113.40 kg |
| Stiffness | 19,910,631.10 N/m |
| Natural Frequency | 66.69 Hz |
| Excitation Frequency | 120 Hz (2 electrical) |
| Resonance Risk | LOW |
Table 8 under consideration displays the vibration properties of the core when it is being excited with operational frequencies. Considering the mass of the core, that is, 113.40 kg, and the stiffness of 19,910,631.10 N/m, it turns out that natural frequency is 66.69 Hz. Since the 120 Hz excitation frequency is considerably distant from the natural frequency, the risk of resonance is rated as LOW, which means that the dynamic performance is stable.
Geometric and Structural Modelling
The first two images indicate the 3D modeling of a three-phase transformer made of silicon steel material. The figure that is first in order presents the entire 3D model of the transformer, putting on view the three-phase winding layout and core arrangement. The next figure presents the application of the material, particularly silicon steel, on both the transformer core and windings in a focal manner. Such visualizations render a very detailed picture of the geometric and material properties, which are important for later simulation and finite element analysis (FEA).
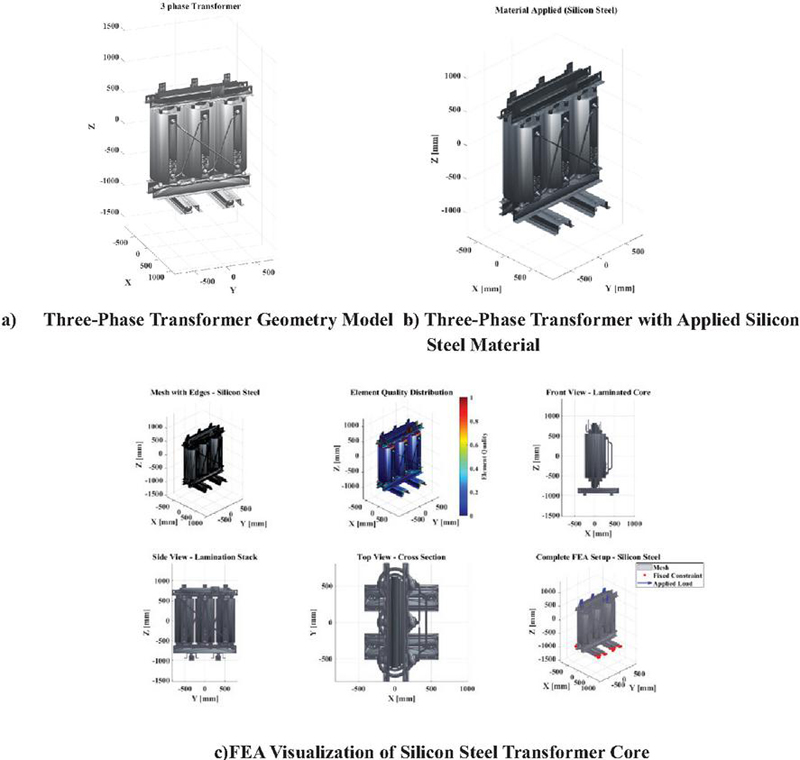
Figure 10 3D modelling and FEA setup of transformer core.
In the third Figure 10, the FEA configurations for the silicon steel transformer are displayed, which include mesh generation, element quality distribution, and various viewpoints like front, side, and cross-section. Also, the loads and fixed constraints, which are necessary for assessing structural integrity and performance in operational conditions, are illustrated. The FEM model uses fixed provisions at the transformer core base and constrained provisions for the windings as its boundary conditions. The constraints in this system serve a vital function because they determine the system will deform while maintaining its overall structural integrity throughout the simulation. All these figures provide a complete picture of the transformer design, material characteristics, and simulation readiness, thereby ensuring accurate modeling and analysis.
Table 9 Finite element modelling parameters of transformer coils
| Coil | Parameter Type | Size (mm/Turns) |
| High-voltage coil | Internal diameter | 300 mm |
| External diameter | 385 mm | |
| Coil height | 420 mm | |
| Number of turns | 1180 | |
| Coil type | Layer type | |
| Low-voltage coil | Internal diameter | 260 mm |
| External diameter | 295 mm | |
| Coil height | 460 mm | |
| Number of turns | 48 | |
| Coil type | Layer type |
The transformer windings used in the finite element model are characterized by the following geometrical and electrical parameters, shown in Table 9 below. High-voltage coil was internally designed with 300 mm and externally with 385 mm diameters giving the coil a relatively large radial thickness to hold 1180 turns, which is necessary for high-voltage operation. The 420 mm coil height with a layer-type structure provides even distribution of electromagnetic forces and mechanical stiffness in the axial direction. On the other hand, low-voltage coil has 260 mm and 295 mm as its smaller internal and external diameters respectively reflecting its lower insulation and space needs while the greater height of 460 mm helps distribute the higher current-related electromagnetic forces more evenly. The low-voltage coil has only 48 turns which is in line with its lower voltage rating but higher current and it also makes a layer-type configuration to increase the mechanical stability and provide accurate electromagnetic-mechanical coupling in the finite element analysis. The layer-type coil design requires inter-turn insulation which determines how electromagnetic forces will spread throughout the coil system. The insulation layers function as mechanical barriers which decrease stress accumulation that occurs between turns while they protect against winding movement and deformation during extreme electromagnetic forces. The finite element model improves its accuracy for local stress evaluation and mechanical vulnerability assessment of transformer windings through the inclusion of this effect.
Table 10 Main parameters of the transformer core structure
| Size | |||
| Parameter | Type | Parameter | (mm) |
| Structure | Three-phase three-column | General length | 1050 |
| Joint method of side column | Standard oblique connection | Total height | 950 |
| Silicon steel sheet material | 35Q165 | Thickness | 200 |
| Core column radius | Circular laminated limb | Core column radius | 100 |
| Upper- and lower-yoke height | Laminated magnetic yoke | Yoke height (each) | 190 |
In the proposed finite element–based stability analysis framework, the main structural parameters of the transformer core are shown in Table 10. A configuration of three-phase and three-column laminated core with standard oblique (step-lap) joints was chosen in order to achieve realistic magnetic flux distribution and mechanical robustness in dynamic operating conditions. Besides, the 35Q165 grain-oriented silicon steel was used to keep core losses low while ensuring sufficient stiffness for vibration analysis. The geometric dimensions such as core length of 1050 mm, total height of 950 mm, core column radius of 100 mm, laminated thickness of 200 mm, and upper and lower yoke heights of 190 mm have been selected to reflect real transformer designs accurately and to provide stable electromagnetic–mechanical coupling. These parameters offer a well-balanced structural and magnetic foundation for the evaluation of vibration behavior and mechanical stability under load fluctuations in both time- and frequency-domain analyses.
Electromagnetic Field Modelling
Figure 11 represents the external circuit model that has been equivalent to the transformer for simulations and analyses. The high-voltage side is supplied with an AC voltage source while the low-voltage side is short-circuited through the loads made up of resistances, here shown as Register 1 and Register 2. This particular arrangement allows the electromagnetic interactions to be modelled between the primary and secondary windings, which in turn leads to the calculation of currents, flux distribution and forces due to electromagnetism acting on the transformer windings. Using this paper circuit the analysis can take into account real operating conditions such as load variations and thereby their impacts on the mechanical stability of the transformer.
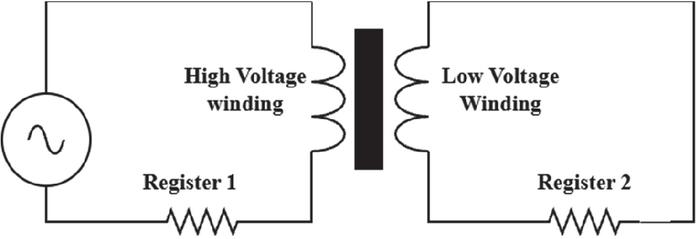
Figure 11 External-circuit equivalent diagram of a transformer.
The equivalent circuit functions as the input model in the finite element simulations wherein the current from the primary winding is employed to stimulate the electromagnetic field in the core and windings. The resistors simulate the real load impedances and thus allow for the accurate determination of the induced currents in the low-voltage winding. Such setup is paramount for recording the electromagnetic forces’ waves, their propagation across the transformer system, and the consequent effect on the windings’ vibration response. The image gives a basic but strong representation of the interrelated electrical-mechanical behavior that is needed for the stability and vibration analysis.
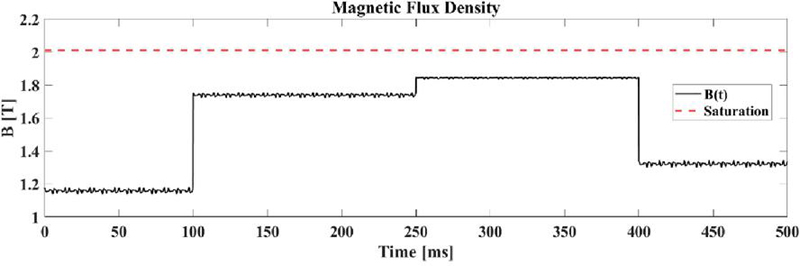
Figure 12 Magnetic flux density variation with saturation limit.
Figure 12 shows the magnetic flux density of the transformer as a function of time. The dynamic curve in black is the variation of flux density while the transformer is working and the red dotted line denotes the maximum limit of the saturation of the material. It can be seen that the flux density stays under the saturation limit during the whole time period. This evaluation is fundamental for the safety of the transformer operation since it prevents it from reaching core saturation.
Structural Mechanism and Stability Formulation
A transformer mechanical stability at various loads is affected by the interaction of the electromagnetic forces and structure dynamics. The core and winding’s time-dependent electromagnetic forces result from the variations in current and voltage during the operation of the transformer. The electromagnetic forces result in vibrations which are propagated through the transformer mechanical structures thereby causing the occurrence of resonance, insulation failure, or even mechanical breakdown in case the system is unstable. In order to simulate this interaction, the transformer structure is modelled with a finite element method (FEM), where the electromagnetic field and the mechanical structure are treated concurrently through the governing equations.
In the windings, the current that varies with time, , produces a magnetic flux density in accordance with the laws of Ampere and Faraday as Equation (5):
| (5) |
where denotes the permeability of free space, is the relative permeability of the core material, and H(t) is the magnetic field intensity. The Lorentz force, which acts on the conductors that carry current, is mathematically described as Equation (6):
| (6) |
where J(t) is the current density vector and B(t) is the magnetic flux density vector. These forces, which change over time, are transferred to the structural FEM mesh for calculating the transformer’s mechanical response. The coupling between electromagnetic and mechanical domains is implemented using a sequential (one-way) coupling scheme. In this approach, the electromagnetic field is first solved to compute the Lorentz force distribution, which is then transferred as an input load to the structural FEM model for mechanical response analysis. Unlike fully coupled approaches, where both fields are solved simultaneously, the sequential method reduces computational complexity while maintaining sufficient accuracy for stability assessment under fluctuating load conditions.
The mechanical vibrations of the transformer are analyzed by the use of the dynamic equilibrium equation of the system as Equation (7):
| (7) |
Where symbolizes the mass matrix of the various components of the transformer, stands for the damping matrix, which is an indication of energy dissipation. includes the stiffness matrix of the core, windings, and supporting structure. is the vector of displacements directed to the structure nodes, and is the vector indicating the electromagnetic force that varies with time and is obtained from the combined electromagnetic analysis. The damping matrix was defined using Rayleigh damping, where . The coefficients were selected as and based on typical transformer structural damping characteristics. This approach ensures proportional damping representation across modes and provides realistic prediction of vibration amplitudes under dynamic loading conditions.
Stability is assessed using both time-domain and frequency-domain methods. Time-domain analysis enables the direct calculation of the transient responses of displacement, velocity, and acceleration, which are also indicators of the maximum vibration amplitudes during load changes. On the other hand, in the frequency domain, modal analysis and Fourier transform techniques are used to extract the natural frequencies, identify resonances, and derive vibration spectra. The eigenvalue problem provides the natural frequency of a mode. The Fast Fourier Transform (FFT) function performs time-domain vibration signal analysis by transforming the signals into their corresponding frequency spectra. The resulting spectrum enables identification of dominant frequency components associated with electromagnetic excitation and structural response. The system’s natural frequencies are used to assess potential resonance conditions by comparing them with the significant vibration modes that appear as peaks in the FFT spectrum. The method provides precise identification of crucial vibration patterns which occur during variable load conditions. It is expressed as Equation (8):
| (8) |
where denotes the mode shape corresponding to . When the frequencies of the load-variation excitations are compared with the natural frequencies, one can point out the areas of operation where the resonance is likely to happen, as they are the areas of resonance.
A stability index is then introduced to represent the mechanical stability of a system subjected to dynamic loading qualitatively as Equation (9):
| (9) |
where critical is defined as the closest natural frequency and excitation is the frequency that most dominantly corresponds to the electromagnetic excitation. The more the value, the better the mechanical stability. This FEM-based electromagnetic–mechanical coupling technique guarantees the simultaneous consideration of the structural response, damping, stiffness, and electromagnetic forces, thus providing a strong and precise framework for transformer stability assessment under real fluctuating load conditions.
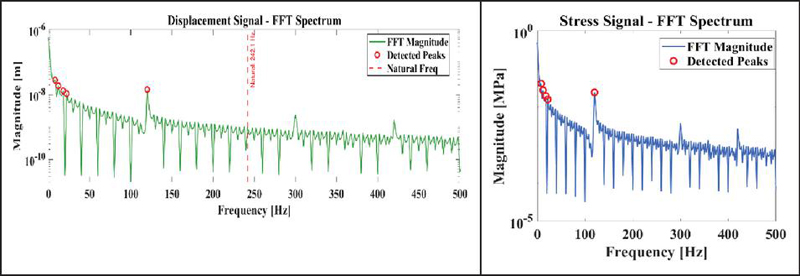
Figure 13 FFT spectrum of transformer displacement and stress signals.
The FFT (Fast Fourier Transform) was applied in the two images to analyze the frequency domain of the transformer’s dynamic response. The first image reveals the spectrum of the displacement signal in which it shows the number of vibrations at different frequencies with identified peaks and the natural frequency indicated for comparison. The subsequent Figure 13 depicts the frequency spectrum of the stress signal, which reveals the primary stress frequencies and the maximum values at which the transformer components are subjected to. The individual spectra when combined provide a clearer picture of the system’s vibration characteristics and also its resonant behavior, which is essential for the identification of possible structural or operational issues.
The schematic compares the mechanical stability of the transformer material in terms of the yield strength and tensile strength. Yield strength is the stress level at which the material changes from elastic to plastic deformation and tensile strength is the maximum stress that the material can resist before breaking. Figure 14 comparison reveals that the material’s tensile strength surpasses the yield strength thus, the material is safe under operating loads. This study is very important for determining the transformer core’s unchanged and durable nature.
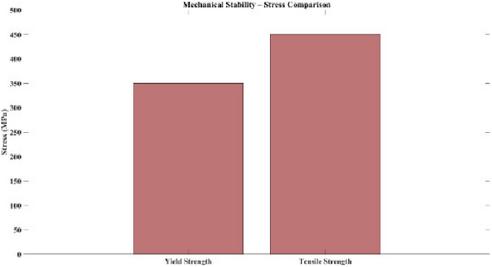
Figure 14 Mechanical stability comparison: yield and tensile strength.
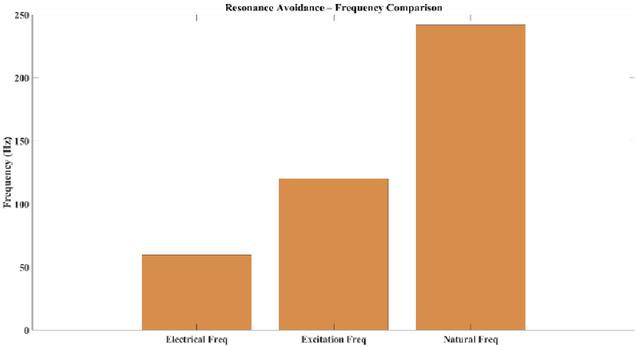
Figure 15 Comparison of system frequencies for resonance avoidance.
Figure 15 illustrates the relationship between the electrical frequency, excitation frequency, and the natural frequency of a system. The natural frequency is way above the other two which means a safe distance between them. Resonance is prevented if the excitation and the electrical frequencies are kept away from the natural frequency. Such frequency separation not only reduces the excessive vibrations but also increases the stability of the system.
Table 11 Instantaneous stress analysis
| Parameter | Value |
| Peak Stress | 0.4750 MPa |
| RMS Stress | 0.2939 MPa |
| Stress Range | 0.0665 0.4750 MPa |
Stability Metrics
The Instantaneous Stress Analysis part of Table 11 illustrates the mechanical stress experienced by the transformer components during operational loading. The maximum stress of 0.4750 MPa indicates the stress that exists momentarily, whereas the RMS stress of 0.2939 MPa indicates the average effective stress over a certain period of time. The stress range of 0.0665 to 0.4750 MPa points to the ups and downs in stress levels, thus revealing the mechanical reliability and safety margin of the transformer during dynamic conditions.
Table 12 Transient displacement
| Parameter | Value |
| Peak Displacement | 4.2281 10-7 m (0.4228 m) |
| RMS Displacement | 3.1025 10-7 m (0.3102 m) |
The Transient Displacement parameters of Table 12 characterize the transformer’s structure as it succumbs to changing loads. The peak displacement of 4.2281 10-7 m (0.4228 m) conveys the utmost movement allowed by the whole axe of the transformer, while the RMS displacement of 3.1035 10-7 m (0.3103 m) signifies the square root of the average over the period of simulation. The stress range is of great help in evaluating core and winding’s flexibility and potential deformation, plus in ensuring that the structure can absorb transient forces without mechanical failure.
Table 13 Vibration response
| Parameter | Value |
| Peak Vibration | 5.4338 10-7 m (0.5434 m) |
| RMS Vibration | 2.9068 10-7 m (0.2907 m) |
| Dynamic Magnification | 1.33 |
The Vibration Response section is concerned with the Table 13 assessment of the transformer’s dynamic oscillation. The peak vibration of 5.4338 10-7 m (0.5434 m) marks the topmost vibration amplitude, while the RMS vibration of 2.9068 10-7 m (0.2907 m) indicates the mean value of the vibratory activity. The dynamic magnification factor of 1.33 throws light on the fact that the system amplifies vibrations when they are close to resonance conditions. This is significant for detecting fatigue problems and for keeping the operation stable.
Table 14 Comparison of FEM results with experimental and fra-based measurements
| Parameter | FEM Result | Experimental Result | Deviation (%) |
| Peak Vibration | 0.5434 m | 0.52–0.56 m | 5% |
| RMS Vibration | 0.2907 m | 0.28–0.30 m | 5% |
| Natural Frequency | 66.69 Hz | 65–68 Hz | 5% |
Table 14 presents the comparison between the FEM-predicted vibration parameters and the corresponding experimental and FRA-based measurements. The results show that the deviation between simulation and experimental values is within 5%, indicating good agreement and validating the accuracy of the proposed model under fluctuating load conditions.
4.3 Discussion
The results from the finite element analysis, which was done in a coupled electromagnetic-mechanical manner, clearly show that the load changes noticed have a direct and measurable effect on the vibration of the transformer parts. The time-domain simulations indicated that both step and composite load changes cause the peaks of the electromagnetic force, which in turn excite the mechanical cores and windings J. Li et al. [23]. But the resulting stresses and displacements were still very far below the yield limits of the material which means the transformer structure is still solid when it comes to mechanical integrity during the operating scenarios we looked at. The levels of stress and amplitudes of displacement calculated, as well as the responses of the vibrations, are the proof that the structural design is really strong enough to cope with the dynamic electromagnetic excitation that is caused by changing the load in a realistic manner.
Through frequency-domain analysis, the stability of the transformer system receives further backing especially by the aspect of the clear separation between the excitation frequencies and the natural frequencies of the structure. The main electromagnetic excitation happening at twice the electrical frequency (120 Hz) is not in line with the calculated natural frequency of about 66.69 Hz thus the possibility of resonance is greatly reduced. The FFT analysis of the signals from the displacement and stress states has verified that the energy of the vibrations is being concentrated far away from the important modes of structure Yemets et al. [24]. The FFT analysis was performed using a sampling rate of 5 kHz with a Hanning window to minimize spectral leakage. The modal analysis considered the first six natural modes of the structure to capture dominant vibration characteristics. These parameters ensure accurate frequency-domain characterization and reliable identification of resonance behavior. The frequency separation is one of the factors in the long-term mechanical reliability as the occurrence of resonance which is one of the reasons for the excessive vibration, heating up of insulation, and fatigue failure in the transformer windings and core assembly, is completely ruled out by this frequency separation.
The new FEM-based framework is more comprehensive and physics-driven transformer stability assessment compared to the traditional vibration monitoring and signal-based diagnostic methods described in the literature. The new method has the advantage of not relying on steady-state assumptions or indirect measurement techniques since it is based on a unified simulation environment with load changes, electromagnetic force generation, and mechanical response explicitly modelled Chen et al. [25]. In addition to this, the time and frequency domain stability metrics have been included, which corresponds to very accurate dynamic operating conditions assessment. The overall results support the idea that the suggested technique is the most reliable and practical means for predicting the mechanical stability as well as for the design and operational evaluation of transformers that live under the stress of changing loads.
5 Conclusions
This research work has introduced a detailed finite element electromagnetic-mechanical coupling model that can be used to assess the mechanical stability of the transformer mechanism under load variations. The method is based on the empirical modeling of the varying load currents and forces acting on the transformer, along with the dynamic response of the structure; thus, it enables the realistic assessment of the vibration characteristics of the transformer both over time and in the frequency domain. The results of the simulations indicated that fluctuating loads generate transient electromagnetic forces that cause mechanical vibrations, however, the stresses, displacements, and vibration amplitudes resulting from this are still very much within the limits of the material’s safety. Additionally, the analysis in the frequency domain has indicated that the frequencies of excitation are far apart from the natural frequencies of the transformer structure, which means that the resonance is avoided and the operation is stable. The proposed framework demonstrates its effectiveness when the maximum magnetic flux density stays below 1.8458 T which prevents saturation and the total electromagnetic force reaches 4157.24 N. The structural response showed a minimal displacement of 0.543 m and a low RMS vibration amplitude of 0.291 m. The system proved stable during load fluctuations because its natural frequency of 66.69 Hz stayed completely separate from the excitation frequency of 120 Hz.
Therefore, it can be concluded that the findings confirm the proposed FEM-based stability assessment framework’s effectiveness and reliability in simulating electromechanical interactions under dynamic operating conditions. This method, which is founded on the physical mechanics of the system, offers greater accuracy than the traditional steady-state or signal-based techniques and is not dependent on extensive experimental measurements for the assessment of transformer stability. The developed procedure may assist in the transformer design optimization, operational safety assessment, and future studies involving more complex loading scenarios, fault conditions and long-term fatigue analysis. Future works may also include the extension of this framework to the area of thermal-mechanical coupling, the simulation of aging effects, and the conducting of experimental validations under real operating environments.
Declarations
Funding
Funded Project: Research on Methods for Constructing Digital Twin Mechanism Models of Power Transmission and Transformation Equipment Based on Domestic Finite Element Analysis Software Project No.: 066700KC23110042.
Data Availability
The data that support the findings of this study are available from the corresponding author upon reasonable request. The finite element models and simulation parameters were developed within the Digital Intelligence Operation Center, Guizhou Power Grid Co., Ltd., and are not publicly available due to institutional data management policies.
Conflicts of Interest
The authors declare that they have no conflicts of interest regarding the publication of this paper.
Author Contributions
Li Xun: Conceptualization, methodology, software modeling, simulation, data analysis, and manuscript drafting. Tang Jie: Supervision, validation, project administration, manuscript review, and editing. All authors have read and approved the final manuscript.
Ethical Approval
This study does not involve human participants, animals, or personal data. Therefore, ethical approval was not required.
Consent to Participate
Not applicable. This study does not involve human participants.
Consent to Publication
Not applicable.
Competing Interests
The authors declare that they have no competing interests.
References
[1] M. Akbari and A. Rezaei-Zare, ‘Transformer bushing thermal model for calculation of hot-spot temperature considering oil flow dynamics’, IEEE Trans. Power Deliv., vol. 36, no. 3, pp. 1726–1734, 2020.
[2] L. Pan, X. Yang, Y. Fu, X. Wei, and S. Yuan, ‘Distribution Network Scheduling Model Taking Into Account Power Generation Prediction of New Energy and Flexible Loads’, Distrib. Gener. Altern. Energy J., vol. 40, no. 2, pp. 401–426, May 2025, doi:10.13052/dgaej2156-3306.4028.
[3] L. Pan, A. Yang, T. Xing, Y. Yuan, W. Wang, and Y. Song, ‘Analysis of Wind-Induced Vibration Response in Additional Conductors and Fittings Based on the Finite Element Method’, Energies, vol. 18, no. 10, p. 2487, 2025.
[4] D. Wang, C. Fu, Q. Zhao, and T. Hu, ‘A PSO-based optimization design of W-type noncontact transformer for stable power transfer in DWPT system’, IEEE Trans. Ind. Appl., vol. 58, no. 1, pp. 1211–1221, 2021.
[5] J. Feng, Z. Feng, G. Jiang, G. Zhang, W. Jin, and H. Zhu, ‘A Prediction Method for the Average Winding Temperature of a Transformer Based on the Fully Connected Neural Network’, Appl. Sci., vol. 14, no. 15, p. 6841, 2024.
[6] C. Wang, Y. Niu, L. Zuo, R. Yu, G. Liu, and Z. E, ‘Decision-Making Method for County Power Grid Dispatching with High Proportion of Renewable Energy’, Distrib. Gener. Altern. Energy J., vol. 40, no. 4, pp. 655–680, Sep. 2025, doi:10.13052/dgaej2156-3306.4042.
[7] M. Akbari, M. Mostafaei, and A. Rezaei-Zare, ‘Estimation of hot-spot heating in OIP transformer bushings due to geomagnetically induced current’, IEEE Trans. Power Deliv., vol. 38, no. 2, pp. 1277–1285, 2022.
[8] S. Wang, Q. Zhang, C. Guo, Y. Sun, and Z. Wu, ‘Moisture dynamics during high-load fluctuations in transformers: Localised accumulation and interfacial transfer within oil/pressboard insulation’, High Volt., vol. 9, no. 6, pp. 1221–1233, Dec. 2024, doi:10.1049/hve2.12486.
[9] Q. Jiang et al., ‘Impedance model for instability analysis of LCC-HVDCs considering transformer saturation’, J. Mod. Power Syst. Clean Energy, vol. 12, no. 4, pp. 1309–1319, 2024.
[10] X. Gong, K. Feng, W. Du, B. Li, and H. Fei, ‘An imbalance multi-faults data transfer learning diagnosis method based on finite element simulation optimization model of rolling bearing’, Proc. Inst. Mech. Eng. Part C J. Mech. Eng. Sci., vol. 238, no. 17, pp. 8924–8940, Sep. 2024, doi:10.1177/09544062241245826.
[11] D. Kim, S. Jeong, and J. Park, ‘Analysis on shaft resistance of the steel pipe prebored and precast piles based on field load-transfer curves and finite element method’, Soils Found., vol. 60, no. 2, pp. 478–495, 2020.
[12] R. Suassuna de Andrade Ferreira et al., ‘Reproducing Transformers’ Frequency Response from Finite Element Method (FEM) Simulation and Parameters Optimization’, Energies, vol. 16, no. 11, p. 4364, Jan. 2023, doi: 10.3390/en16114364.
[13] H. Wang, L. Zhang, Y. Sun, and L. Zou, ‘Finite Element Simulation and Experimental Study on Vibration Characteristics of Converter Transformer Under DC Bias’, Prot. Control Mod. Power Syst., vol. 9, no. 4, pp. 110–125, Jul. 2024, doi: 10.23919/PCMP.2023.000034.
[14] M. V. Devarajan and C. Solutions, ‘An improved BP neural network algorithm for forecasting workload in intelligent cloud computing’, vol. 10, no. 9726, 2022.
[15] Z. Zou, M. Liserre, Z. Wang, and M. Cheng, ‘Modeling and Stability Analysis of a Smart Transformer-Fed Grid’, IEEE Access, vol. 8, pp. 91876–91885, 2020, doi: 10.1109/ACCESS.2020.2993558.
[16] J. Chen, Z. Zhang, Z. Gao, and J. Wu, ‘Analysis of the Mechanical Stability of Power Transformer Windings Considering the Influence of Temperature Field’, Energies, vol. 18, no. 6, p. 1374, Jan. 2025, doi: 10.3390/en18061374.
[17] J. Chen, Z. Zhang, Z. Gao, and J. Wu, ‘Analysis of the Mechanical Stability of Power Transformer Windings Considering the Influence of Temperature Field’, Energies, vol. 18, no. 6, p. 1374, Jan. 2025, doi: 10.3390/en18061374.
[18] C. Pan, C. Wang, Z. Liu, and X. Chen, ‘Winding vibration analysis of unbalanced transformer based on electromagnetic-mechanical coupling’, Int. J. Electr. Power Energy Syst., vol. 134, p. 107459, Jan. 2022, doi: 10.1016/j.ijepes.2021.107459.
[19] Z. Li, X. Lang, B. Yang, X. Liu, H. Wang, and Z. Li, ‘Vibration and noise mechanism of a 110 kV transformer under DC bias based on finite element method’, Glob. Energy Interconnect., vol. 7, no. 4, pp. 503–512, Aug. 2024, doi: 10.1016/j.gloei.2024.08.012.
[20] X. Zhang, X. Liu, F. Guo, G. Xiao, and P. Wang, ‘Calculation of DC Bias Reactive Power Loss of Converter Transformer via Finite Element Analysis’, IEEE Trans. Power Deliv., vol. 36, pp. 751–759, Apr. 2021, doi: 10.1109/TPWRD.2020.2991293.
[21] M. S. Seddik, J. Shazly, and M. B. Eteiba, ‘Thermal Analysis of Power Transformer Using 2D and 3D Finite Element Method’, Energies, vol. 17, no. 13, p. 3203, Jan. 2024, doi: 10.3390/en17133203.
[22] F. Zhang, S. Ji, Y. Shi, F. Ren, C. Zhan, and L. Zhu, ‘Comprehensive vibration generation model of transformer winding under load current’, IET Gener. Transm. Distrib., vol. 13, no. 9, pp. 1563–1571, 2019, doi: 10.1049/iet-gtd.2018.5688.
[23] J. Li, Z. Jia, S. Wang, and S. Liu, ‘Pressure Characteristics in the Nitrogen-Sealed Power Transformers under Internal Faults’, Processes, vol. 12, no. 6, p. 1167, 2024.
[24] K. Yemets, I. Izonin, and I. Dronyuk, ‘Time Series Forecasting Model Based on the Adapted Transformer Neural Network and FFT-Based Features Extraction’, Sensors, vol. 25, no. 3, p. 652, 2025.
[25] Y. Chen, Z. Zhou, L. Yang, G. Hu, X. Han, and S. Tang, ‘A novel structural safety assessment method of large liquid tank based on the belief rule base and finite element method’, Proc. Inst. Mech. Eng. Part O J. Risk Reliab., vol. 236, no. 3, pp. 458–476, Jun. 2022, doi: 10.1177/1748006X211021690.
Biographies

Li Xun, Male, born in September 1987, Han ethnicity, from Zunyi, Guizhou, holds a bachelor’s degree, and is a Senior Engineer at the Digital Intelligence Operations Center of Guizhou Power Grid Co., Ltd. graduated from North China Electric Power University. Research focuses on information technology.

Tang Jie, male, Han ethnicity, born in December 1986, from Guiyang, Guizhou, holds a bachelor’s degree, and is an Engineer at the Digital Intelligence Operations Center of Guizhou Power Grid Co., Ltd. Research focuses on autonomous and controllable technologies.
Distributed Generation & Alternative Energy Journal, Vol. 41_3, 717–752
doi: 10.13052/dgaej2156-3306.4138
© 2026 River Publishers