Distributed Photovoltaic Acceptance Capacity Calculation Based on Improved HEM under Uncertain Environments
Qing-sheng Li1,*, Xue-peng Mou1, Zhen Li1, Li-shun Yang2 and Jian-shuai Guo3
1Guizhou Power Grid Co., LTD. Grid Planning and Research Center, GuiYang 550000, GuiZhou, China
2Guizhou Power Grid Co., LTD. Xingyi Power Supply Bureau, XingYi 562400, GuiZhou, China
3Guizhou Power Grid Co., LTD. Duyun Power Supply Bureau, Duyun 55800, GuiZhou, China
E-mail: Qingsheng_LiCSG@outlook.com
*Corresponding Author
Received 11 March 2026; Accepted 30 April 2026
Abstract
To address the low computational efficiency of traditional photovoltaic hosting capacity assessment methods under uncertain environments, this study proposes a rapid evaluation method based on scenario adaptation and application form optimization of the Holomorphic Embedding Method. Firstly, a node selection strategy based on the Lévy flight-improved particle swarm optimization algorithm is established. An objective model with constraint penalty functions is constructed. Candidate grid connection nodes with superior voltage regulation capability and potential for capacity enhancement are then efficiently screened. This greatly reduces the computational burden of subsequent stochastic evaluation. Secondly, Monte Carlo simulation is integrated with the optimized Holomorphic Embedding Method, combined with Latin hypercube sampling. This builds an assessment framework that considers the uncertainties of photovoltaic output and load fluctuation. The established model adopts the Holomorphic Embedding Method to solve deterministic subproblems efficiently. It then evaluates the overall adaptability and robustness of different integration schemes under various uncertain scenarios. Simulation validation on the IEEE-30 bus system demonstrates that the optimal scheme corresponds to nodes {3,19}. The maximum photovoltaic hosting capacity is 81.32 MW. This scheme obtains the minimum comprehensive flexibility score. It verifies optimal operational performance across annual stochastic scenarios. Meanwhile, the proposed method improves computational efficiency by approximately 82% compared with the conventional enumeration method. It maintains calculation accuracy. The results indicate that the application-oriented optimization of the Holomorphic Embedding Method, combined with stochastic scenario analysis and shared energy storage, can improve the photovoltaic accommodation capability and operational flexibility of distribution networks. It provides reliable theoretical and methodological support for the grid integration of high-penetration renewable energy.
Keywords: HEM, distributed photovoltaic, load fluctuation, power grid.
1 Introduction
Under the global push for decarbonization and emission reduction, electrification and renewable energy have become central to the energy transition [1]. Among these, distributed photovoltaics (PV) stand out for their flexibility and proximity-based consumption advantages. They are a key driver in transforming distribution networks into Smart Local Energy Systems (SLES) [2]. The grid integration of distributed PV facilitates the joint “source-grid-load-storage” control. It also provides new approaches for the integrated optimization of combined heat and power (CHP), district heating and cooling networks, and power grids. This plays an important role in improving energy efficiency and optimizing the energy mix [3, 4]. However, the strong intermittency and randomness of PV output create a typical uncertain environment, posing serious challenges to the safe and stable operation of distribution networks [5]. Koirala A et al. pointed out that higher renewable energy penetration intensifies uncertainty in low-voltage distribution systems, and PV hosting capacity must be treated as a stochastic problem [6]. Fatima S et al. further demonstrated that this uncertainty forces distribution network operators to make economic trade-offs between generation curtailment and network upgrades [7]. Although energy storage technologies and demand-side response provide some regulatory capacity, their large-scale coordinated deployment remains insufficient, which amplifies the impact of PV grid integration on voltage, frequency, and power balance [8]. Therefore, accurately calculating PV hosting capacity under uncertain environments has become a critical prerequisite and a frontier research topic for improving grid resilience and supporting energy decarbonization.
The existing approaches for calculating the PV hosting capacity can be classified into two categories: deterministic approaches and probabilistic approaches. The deterministic approaches are generally conservative, as they do not consider randomness, while probabilistic approaches are limited by computational complexity. To overcome these issues, the related work has progressed in two different directions. The first involves deepening models within a probabilistic framework. For example, Madavan A N et al. applied second-order cone programming based on conditional value-at-risk to constrain the risk of constraint violations [9]. Atmaja W Y et al. proposed a Markov chain-based forecasting approach. The results showed that after deploying energy storage, the system hosting capacity increased from 123.58 kW to 3676.4 kW [10]. The second direction introduces auxiliary techniques to simplify the evaluation process. Qammar N et al. used machine learning models to directly map grid feature data to hosting capacity [11]. Some studies take a different angle by enhancing the network’s own control capabilities to indirectly increase capacity. For instance, Hamdan I et al. optimized voltage through model predictive control of smart inverters [12]. Karadeniz A et al. addressed harmonics by deploying passive filters. This created more headroom for PV integration at the device level [13]. Although the above studies promote the development of hosting capacity evaluation from perspectives such as probabilistic modeling, auxiliary algorithms, and network regulation, common limitations still remain. Firstly, probabilistic methods including second-order cone programming and Markov chains can describe uncertainty, yet rely on massive repeated power flow calculations and impose heavy computational burdens. Secondly, machine learning-based methods realize rapid capacity mapping but depend heavily on training data. They lack physical interpretability. Thirdly, regulation enhancement methods such as inverter control and filter configuration mostly mitigate voltage violations at the device level, without improving computational efficiency from the fundamental evaluation algorithm.
Meanwhile, as smart grids and multi-energy coupling in SLES continue to develop, PV hosting capacity calculation faces increasingly high-dimensional and highly uncertain challenges [14]. The Holomorphic Embedding Method (HEM) is a promising approach. It has robust convergence characteristics and is independent of the initial value choice. Ramos A C S et al. presented an HEM-based recursive approach for economic dispatch problems with transmission losses. The results showed that this approach had better convergence performance than the traditional Newton-Raphson (NR) method [15]. Domínguez Á B et al. proposed a multi-stage HEM control scheme that monitors the convergence process through convergence factors. This improves computational performance [16]. In addition, Tian P et al. proposed a fast and flexible power flow calculation method for VSC-based AC/DC hybrid systems using HEM, extending its application to emerging power systems [17]. On the other hand, Particle Swarm Optimization (PSO) has been widely applied to the location and sizing of distributed PV systems. This is due to its simplicity and fast convergence speed. Deng J and Wang Y proposed Lévy flight strategies for PSO, and the results showed that the algorithm could track the global maximum power point correctly under partial shading [18]. Challoob A F et al. further proved that hybrid algorithms composed of PSO and other intelligent algorithms can better enhance the efficiency and speed of maximum power point tracking. This is especially true in complex conditions such as partial shading [19]. The above-mentioned studies are of great significance for designing even more powerful optimizers to find the optimal nodes of PV integration.
Therefore, to efficiently address the challenge of accurately calculating PV hosting capacity under uncertain environments, a two-stage framework is proposed that integrates an improved HEM with a Lévy flight-enhanced PSO. It combines efficient optimization with fast and accurate evaluation. The main innovations and contributions are as follows:
(1) An improved PSO algorithm with Lévy flight search is proposed, which adopts adaptive inertia weights and long-range perturbation strategies, together with a penalty function-based objective model, to efficiently identify the optimal PV grid-connected nodes.
(2) A two-stage evaluation framework is constructed that integrates the optimized application form of HEM with Latin Hypercube Sampling (LHS)-based Monte Carlo Simulation (MCS). An explicit functional relationship between node voltage and power injection is established. This enables an iterative-free and fast power flow solution for massive scenarios.
(3) Simulation validation on the IEEE 30-bus system is conducted to determine the optimal integration scheme and hosting capacity. A comprehensive flexibility score is introduced to assess full-scenario adaptability and long-term robustness. It provides an efficient and accurate analysis method for high-penetration PV grid planning.
2 Distributed PV Integration Capacity Calculation Using Improved HEM
2.1 Optimal Grid Connection Point Selection for Maximum PV Integration
To tackle the problem of high computational dimensionality caused by the large number of PV grid connection points, the first step of this study is to build a multi-objective optimization model. This model takes into account the active power loss of the system. The purpose of this model is to rapidly identify key nodes that improve integration capacity and voltage support. Its framework is shown in Figure 1.
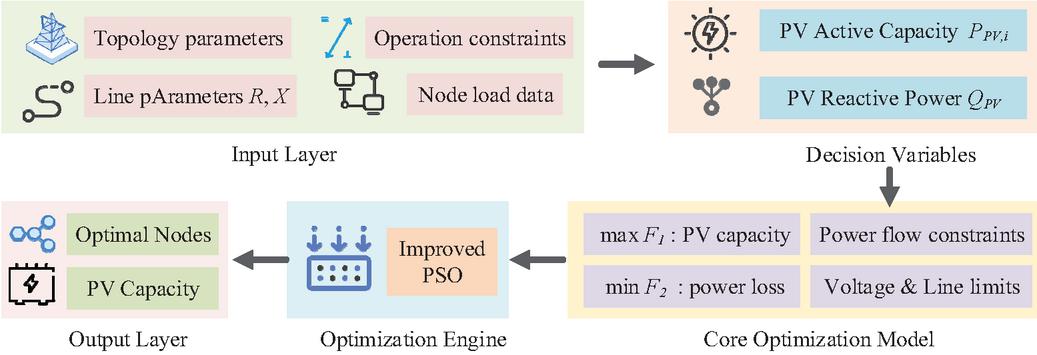
Figure 1 Framework of PV integration capacity assessment.
As shown in Figure 1, the framework takes distribution network topology, line parameters, load data, and security constraints as inputs. Node PV active and reactive power outputs serve as decision variables. The optimization objectives are to maximize integration capacity and minimize network loss. Using the improved PSO algorithm for optimization, the model outputs the optimal grid connection points and integration capacity scheme. The objective function is shown in Equation (1).
| (1) |
In Equation (1), represents the active power output of distributed PV planned at node , is the total number of candidate PV access nodes, and denotes the maximization of total system PV integration capacity. and represent the active and reactive power transmitted at the sending end of a branch, is the voltage magnitude at the sending end, is the branch resistance, and is the minimization of total system active power loss. quantifies the node’s insensitivity to random fluctuations. A lower sensitivity value indicates greater stability of the node voltage under variations in PV power output. The coefficient represents the sensitivity of the voltage at node to injected PV power, which can be directly computed using the power flow Jacobian matrix without requiring additional simulations. This metric is incorporated into the optimization objective. The proposed model then balances steady-state capacity margin and resilience to stochastic disturbances during the node prioritization stage. This enables it to proactively select nodes with strong voltage support and inherent adaptability to uncertain PV output, establishing an optimized foundation for subsequent refined capacity verification under random operating conditions. To ensure safe and stable operation after integration, the model satisfies node power balance constraints and operational security constraints [20, 21]. Assuming that PV connects at unity power factor, , the node power balance equation is given in Equation (2).
| (2) |
In Equation (2), and are the active and reactive power outputs of generators, and are the active and reactive loads of , and are voltage magnitudes, and are the conductance and susceptance of the node admittance matrix, is the voltage angle difference, and is the total number of nodes in the system. Operational security constraints include node voltage limits, line capacity limits, and PV capacity limits. These are detailed in Equation (3).
| (3) |
In Equation (3), represents the apparent power of line , is the set of lines, and is the set of candidate PV access nodes. For the multi-objective problem to be adapted for single-objective optimization algorithms, a linear weighting approach is used to normalize the two objectives, remove dimensional differences, and form a combined fitness function, as expressed in Equation (4).
| (4) |
In Equation (4), and represent the maximum and minimum values of each objective function in the feasible domain, and represent weighting coefficients satisfying . , and represent the normalized capacity objective, power loss objective and sensitivity objective, respectively. Since needs to be maximized while and needs to be minimized, and are transformed as and to unify the optimization direction. A larger Fitness value indicates a better overall performance of the solution. To efficiently solve the multi-objective optimization model of PV access nodes, this study proposes an improved PSO algorithm based on Lévy flight strategy, called IPSO. The algorithm flow is shown in Figure 2.
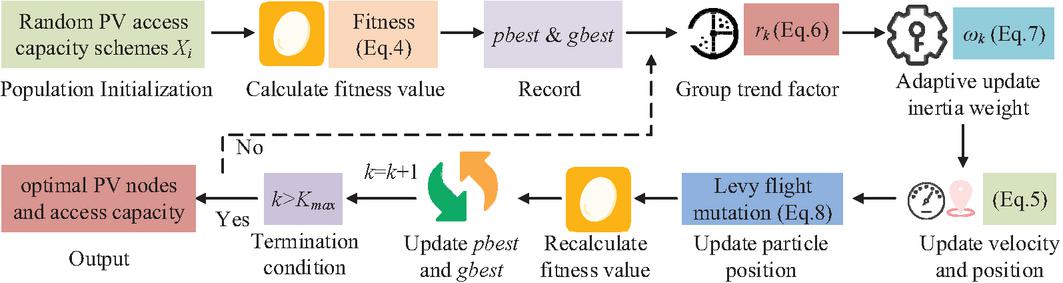
Figure 2 Flowchart of IPSO algorithm for PV access optimization.
As illustrated in Figure 2, IPSO begins with an initialized PV integration capacity scheme. The inertia weight is dynamically updated with a population trend factor to ensure an optimal search state for Lévy flight perturbation. The process updates the particle positions one by one based on the standard PSO iteration and Lévy flight perturbation. The global optimal integration configuration is constantly updated. Once the termination condition is satisfied, the optimal nodes and capacity are obtained. If the position represents a PV integration capacity scheme, its velocity and position update formulas are given in Equation (5).
| (5) |
In Equation (5), is the iterative update step of the PV capacity configuration scheme. is the inertia weight, and are learning factors, and are random numbers in [0, 1]. is the particle’s historical best PV configuration, and is the global best integration configuration of the population. To optimize the execution of the Lévy flight strategy, a population trend factor is defined to represent the convergence degree of the population toward the current best PV configuration. Its schematic is shown in Figure 3.
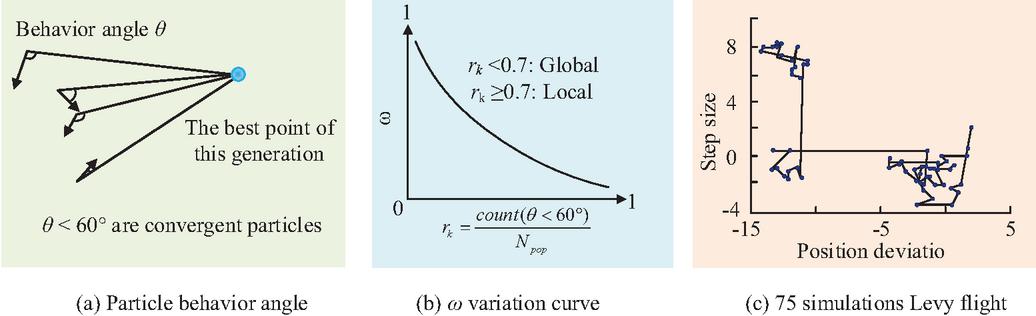
Figure 3 Schematic of Levy flight strategy and population trend factor.
In Figure 3(a), the behavior angle is defined as the angle between the particle’s current velocity vector and the vector pointing to the population’s best position. Particles with less than 60 are considered convergent particles. In Figure 3(b), changes with , enabling automatic switching between global search and local exploitation. is defined in Equation (6).
| (6) |
In Equation (6), represents the total number of particles involved in PV configuration optimization. The adaptive update method based on is given in Equation (7).
| (7) |
In Equation (7), is the adaptive inertia weight of continuous nonlinear mapping. To avoid local optima, Lévy flight perturbation is added after standard updates. As shown in Figure 3(c), the long-range jumps and random walk characteristics of Lévy flight help the algorithm escape local optima. The position update is shown in Equation (8).
| (8) |
In Equation (8), represents the PV capacity perturbation step factor. The term denotes the random step size following a Lévy distribution, where and are both normally distributed random numbers, and is the characteristic exponent (typically set to 1.5). This step size generates long-distance jumps via heavy-tailed probability, thereby assisting the algorithm in escaping from local optima. IPSO can quickly find the best grid connection points and obtain the maximum safe integration capacity of each node. This effectively improves the solving efficiency and configuration rationality of distributed PV grid connection optimization.
2.2 Design of an Assessment Model for Distributed PV System Integration Capacity
Based on the high-quality PV access schemes determined by IPSO, this study proposes an HEM–LHS–MCS evaluation model incorporating the analytical optimization of HEM. The framework is illustrated in Figure 4. This model is designed to assess the maximum safe integration capacity and long-term operational robustness under real uncertain environments, and to address the low computational efficiency of traditional probabilistic power flow methods in massive scenarios.
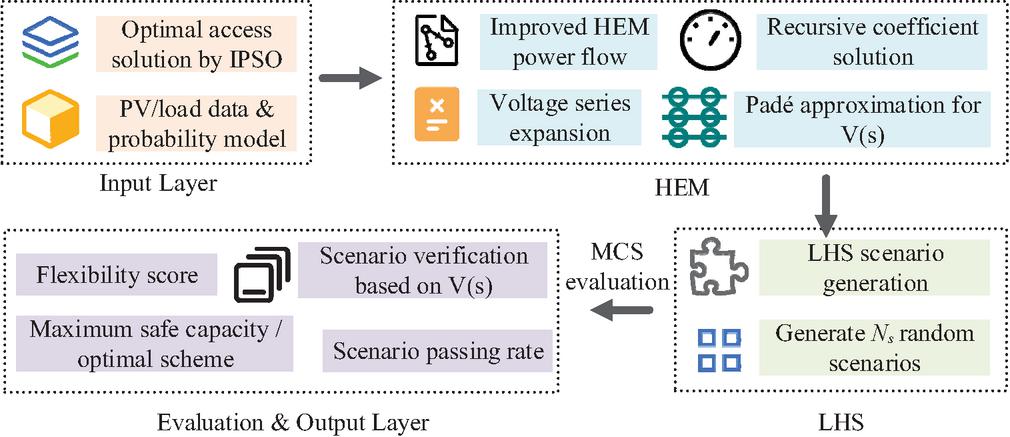
Figure 4 Framework of HEM-LHS-MCS for PV capacity evaluation.
As illustrated in Figure 4, HEM-LHS-MCS uses the IPSO-identified optimal access strategies and past source-load conditions as inputs. It establishes an iterative-free fast power-solving mechanism based on the optimized application of HEM. Such optimization is limited to the application level: the analytical characteristics of HEM are adopted to construct an explicit voltage–power function, and the Padé approximation is introduced to extend the convergence domain. Then, LHS is adopted to generate stochastic scenarios of photovoltaic output and load fluctuation. Within MCS framework, safety verification and statistical evaluation are completed to output the maximum safe hosting capacity and the optimal flexible scheme [22, 23]. The core improvement of HEM lies in establishing an explicit functional relationship between node voltage and power injection multipliers, enabling fast non-iterative power flow calculation for massive scenarios, as shown in Equation (9).
| (9) |
In Equation (9), represents the embedded complex variable, and its complex conjugate is denoted as . represents an element of the node admittance matrix, represents the node voltage holomorphic function. denotes the conjugate value of the voltage holomorphic function evaluated at , this construction ensures that the right-hand side of Equation (9) remains holomorphic with respect to , which is a prerequisite for the power series expansion. represents the node-to-ground shunt admittance, and represents the conjugate of the injected complex power at the node. To achieve non-iterative solution, is expanded into a power series in the complex domain, as shown in Equation (10).
| (10) |
In Equation (10), is the voltage coefficient. To enlarge the convergence domain and ensure stability under high PV penetration scenarios, Padé approximation constructs a rational function approximation of the voltage, as shown in Equation (11).
| (11) |
In Equation (11), and are the approximation orders, and are the approximation coefficients. It should be noted that the power series in Equation (10) has a finite radius of convergence. When (corresponding to the actual system operating point) lies outside the convergence domain, direct summation may lead to divergence. The Padé approximation constructs a rational fraction to analytically extend the voltage function to the entire complex plane, thereby ensuring a convergent power flow solution at . This establishes a direct explicit functional relationship between node voltage and . To efficiently cover the source-load joint uncertainty space, LHS is further used to generate high-quality random scenarios. The process is shown in Figure 5.
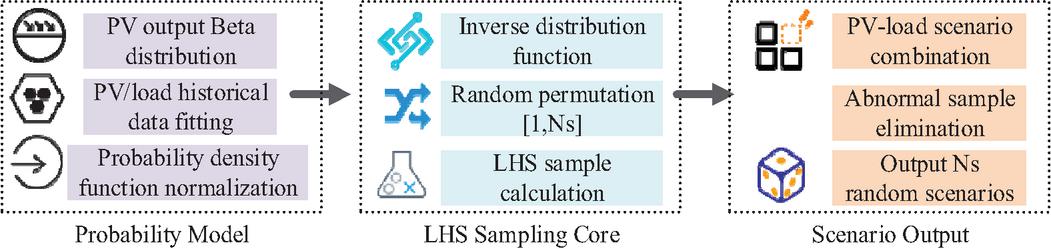
Figure 5 Process of generating high-quality source-load random scenarios using LHS.
As shown in Figure 5, the process first establishes a Beta distribution model of PV output. Then, multi-dimensional uniform sampling and random permutation of LHS generate source-load joint random scenarios. The voltage-power explicit function constructed by HEM verifies scenario validity, and finally outputs high-quality scenarios for system uncertainty assessment. The probability density function of PV output is shown in Equation (12).
| (12) |
In Equation (12), and are the shape parameter determined by fitting historical PV output data, is the gamma function, and is the maximum PV output. The -th random variable in the -th sample is shown in Equation (13).
| (13) |
In Equation (13), is the inverse cumulative distribution function, is the random permutation, is a uniform random number in [0, 1], and is the total number of scenarios generated by LHS. Finally, the model performs probabilistic assessment under the MCS framework. The evaluation process for scenarios generated by LHS is shown in Figure 6.
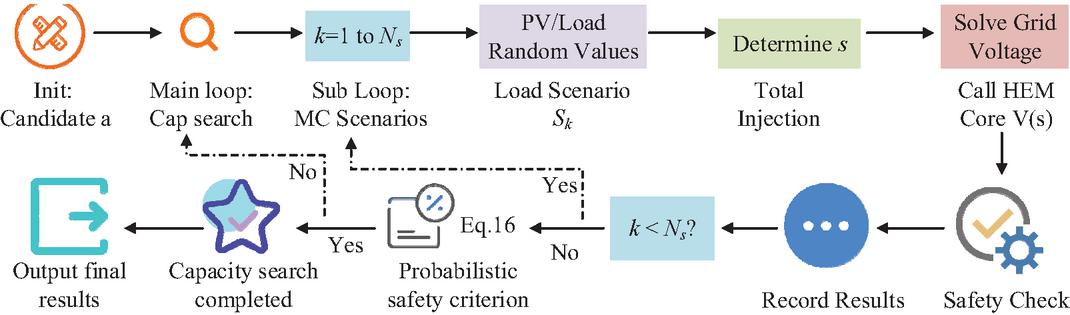
Figure 6 Monte Carlo simulation process for PV capacity assessment using improved HEM.
As shown in Figure 6, the MCS capacity search process based on the improved HEM kernel uses a two-layer loop. The outer loop increments PV capacity, and the inner loop iterates through random scenarios. By calling the pre-constructed voltage function , power flow for each scenario is solved rapidly, constraints are verified, and scenario pass rate and comprehensive flexibility score are calculated. The maximum safe integration capacity and optimal flexibility strategy are identified based on probabilistic criteria. The single scenario adaptability is measured using the flexibility score indicator, as expressed in Equation (14).
| (14) |
In Equation (14), is the single-scenario flexibility score of the -th scheme in the -th random scenario, is the weight coefficient, , , and represent active power, reactive power, and voltage deviation, is the rated voltage of the node, and and are the system active and reactive power base values. The average scores of all scenarios yield the Monte Carlo statistical estimate, or the flexibility score, as indicated in Equation (15).
| (15) |
In Equation (15), is the comprehensive flexibility score of the -th scheme, and is the number of effective scenarios included in the statistics. Determining the maximum integration capacity under uncertainty requires that key constraints are satisfied in the vast majority of scenarios, with the probabilistic criterion shown in Equation (16).
| (16) |
In Equation (16), is the preset small probability threshold used to control the risk of constraint violation. In the process of evaluation, the maximum safe integration capacity is determined by the iterating capacities and the application of the criterion. The proposed model replaces the traditional iterative power flow process with an HEM analytical kernel, which can efficiently simulate a huge amount of random scenarios and significantly improve the calculation speed of uncertainty analysis.
3 Simulation Examples and Analysis
3.1 Test System and Scenario Settings
To verify the proposed approach, this study uses the IEEE 30-bus distribution system as the simulation example. The system topology, line parameters, and load data are obtained from the IEEE PES standard case library. PV generation time-series data were obtained from the NREL PVWatts hourly dataset. Load variations are based on measured data from IEEE DataPort. Simulations were conducted in MATLAB R2022b, with YALMIP and Mosek 9.3 used to solve the optimization problem. The hardware platform is an Intel Core i7-10700 CPU (2.90–4.80 GHz), 16 GB DDR4 RAM, and a 512 GB SSD. The system topology and nodal load distribution are shown in Figure 7.
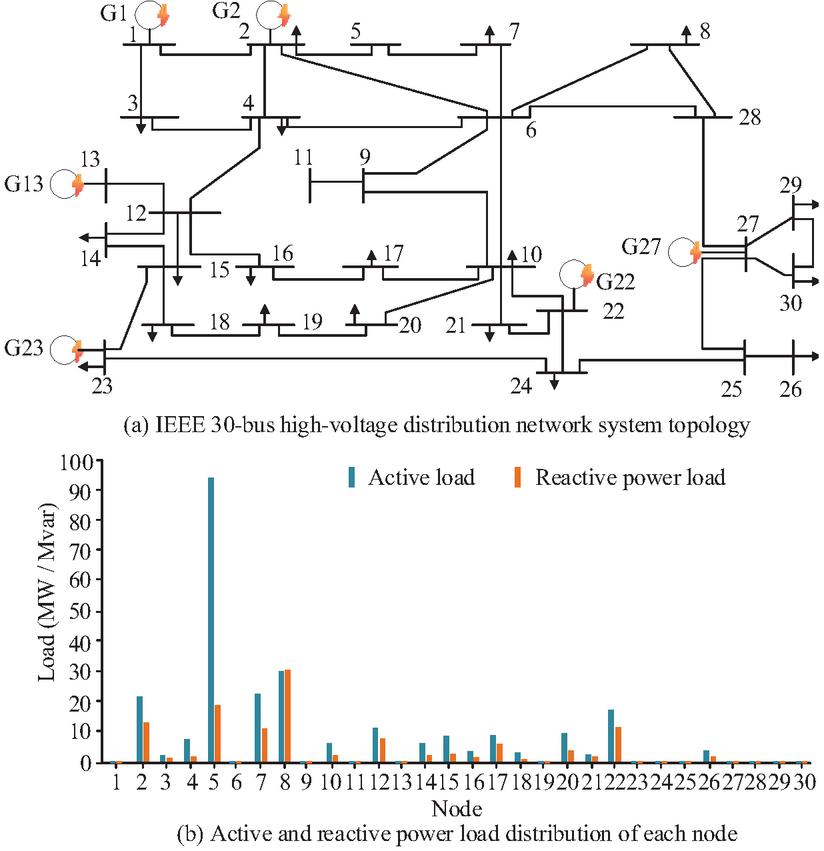
Figure 7 IEEE 30-bus system topology and nodal load distribution.
In Figure 7(a), the system had a base capacity of 100 MVA and a rated voltage of 230 kV, with 30 buses and 41 branches. Bus 1 was the slack bus, while buses 2, 5, 8, 11, 13, 22, 23, and 27 were PV buses, and the rest were PQ buses. As illustrated in Figure 7(b), the system load had an unbalanced distribution. The load was concentrated around buses 2, 5, 7, 8, 12, and 22, with bus 5 having the highest active power load of 94.22 MW. To simulate the uncertain environment with high PV penetration, the PV active power output was represented by a Beta distribution, while the load variation was represented by a normal distribution. Based on this setup, LHS was used to generate 2,000 joint source-load random scenarios. The daily PV output and load variation curves under typical scenarios are shown in Figure 8.
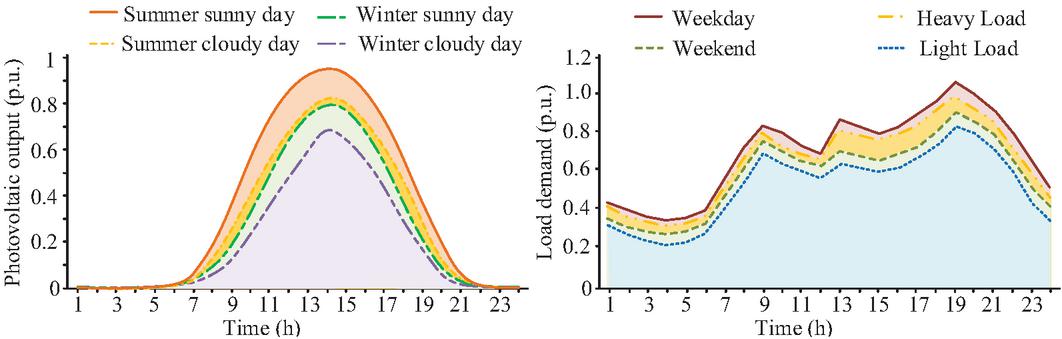
Figure 8 Daily variation curves of PV output and load under typical scenarios.
As shown in Figure 8(a), PV output exhibited a clear single-peak pattern. It was concentrated in the 6:00–20:00 window and was strongly influenced by season and weather. Peak output reached 0.95 p.u. on a clear summer day and dropped to 0.68 p.u. on a cloudy winter day. As shown in Figure 8(b), load followed a typical double-peak pattern with distinct morning and evening peaks. On a heavy-load day, the evening peak at 19:00 reached 1.05 p.u., while the corresponding load on a light-load day was only 0.82 p.u. The peak of the midday PV output was considerably shifted from the morning and evening peaks of the load. This further accentuated the stress on power balancing and voltage regulation in high-penetration PV systems.
3.2 Evaluation of PV Integration Capacity and Connection Schemes
To identify the optimal PV integration nodes, this study first applied the IPSO algorithm for node screening. The PSO population size was set to 30, and the maximum number of iterations was set to 50. The inertia weight range was [0.4, 0.9], the learning factors were and , and the Lévy flight step size factor was 0.01. To validate the screening effectiveness of IPSO, this study compared it against random selection using a normalized composite index based on hosting capacity, network loss, and voltage safety. IPSO identified five optimal candidate schemes, numbered 51–55, corresponding to bus combinations {6, 22}, {10, 29}, {3, 19}, {4, 15}, and {7, 24}. Meanwhile, 50 randomly generated schemes served as the baseline. To further validate the improvements in IPSO, an ablation study was conducted comparing IPSO against standard PSO, adaptive weight PSO (AW-PSO), and Lévy flight PSO (LF-PSO). Results are shown in Figure 9.
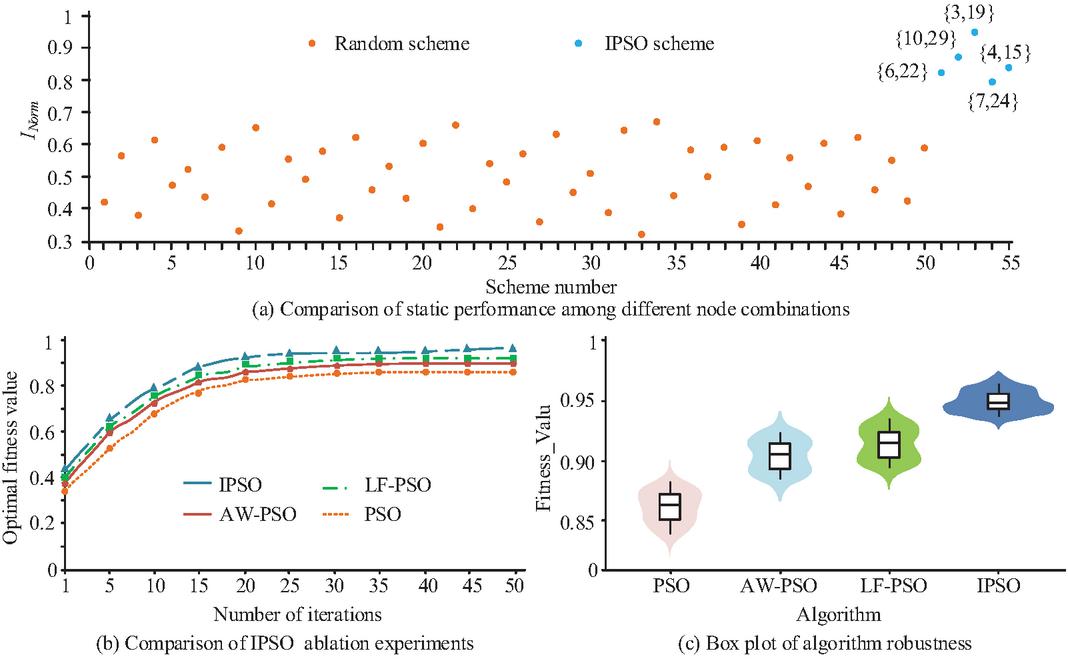
Figure 9 Comparison of node screening performance among IPSO and baseline algorithms.
Note: .
In Figure 9(a), the performance indices of the schemes chosen by IPSO were in the range of 0.79–0.95, which was much higher than that of the randomly chosen schemes, and the best scheme {3, 19} had the maximum index of 0.95. From Figure 9(b), IPSO had the maximum fitness value of 0.96 after 50 iterations and the highest convergence speed. In Figure 9(c), IPSO had the highest median fitness of 0.952 with the smallest range, and LF-PSO had the highest median value but the largest range. These observations proved that IPSO had better accuracy as well as stability. After {3, 19} was identified as the optimal integration scheme, this study applied the HEM-LHS-MCS model to conduct an in-depth analysis of its operational characteristics. The probability distributions of key bus voltages across 2,000 random scenarios, and the violation probability curves as a function of PV capacity for different schemes, are shown in Figure 10.
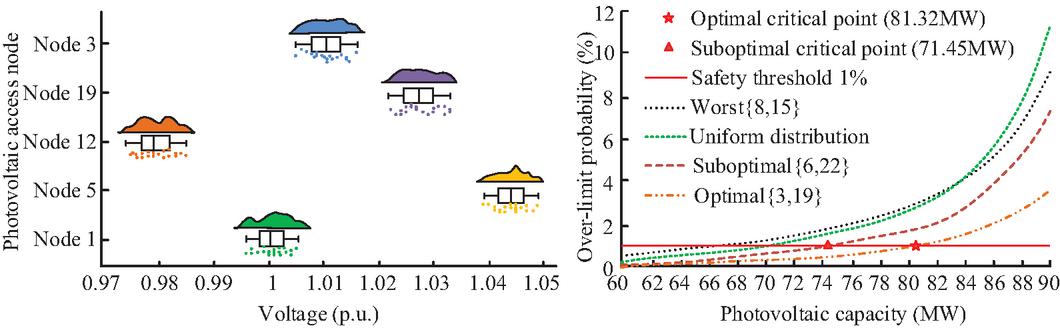
Figure 10 Voltage probability distributions and violation probability curves.
In Figure 10(a), the voltage medians at buses 3 and 19 were 1.010 p.u. and 1.028 p.u., respectively, with concentrated distributions within the safe operating range. The weak bus 12 had a voltage median of 0.980 p.u., and the heavy-load bus 5 had a median of 1.044 p.u. All bus voltages fell strictly within the safe range of [0.95, 1.05] p.u., confirming the global voltage safety of this scheme. From Figure 10(b), the scheme with the least rate of risk increase was scheme {3, 19}, which attained a violation probability of only 0.10% at 60 MW, attaining the 1% safety threshold at 81.32 MW. The next best scheme {6, 22} attained the safety threshold at 71.45 MW, while the uniform distribution scheme and the worst scheme {8, 15} had a higher rate of risk increase. This meant that the optimal selection of nodes could slow down the rate of risk accumulation as capacity increased, hence improving the hosting capacity of the system’s PV. Based on the proposed schemes, all the options were tested using 2,000 random scenarios with a probability safety level of . The overall performance comparison of all the schemes is presented in Table 1.
Table 1 Performance comparison of candidate PV integration schemes
| Max. Safe | Flexibility | Scenario Pass | Expected | |
| Scheme | Capacity (MW) | Score | Rate (%) | Loss (MW) |
| {3, 19} | 81.32 | 1.23 | 99.52 | 4.25 |
| {6, 22} | 71.45 | 1.45 | 98.83 | 4.48 |
| {10, 29} | 79.10 | 1.67 | 97.21 | 4.62 |
| {4, 15} | 72.18 | 1.89 | 96.47 | 4.85 |
| {7, 24} | 68.91 | 2.05 | 95.92 | 5.12 |
| Load-proportional (benchmark) | 62.34 | 2.18 | 95.67 | 5.68 |
| Uniform distribution (benchmark) | 58.67 | 2.45 | 94.32 | 6.12 |
As shown in Table 1, scheme {3, 19} achieved the highest maximum safe hosting capacity of 81.32 MW, which was 13.81% higher than the second-best scheme {6, 22}, 18.01% higher than scheme {7, 24}, and 38.62% higher than the uniform distribution benchmark scheme, and 30.45% higher than the load-proportional benchmark scheme. This scheme also had the lowest comprehensive flexibility index of 1.23, which is reduced by 49.80% and 43.58% compared with the two benchmark schemes, indicating the optimal operational adaptability across stochastic scenarios. The pass rate of the scenario was 99.52%, and the probability of voltage violation was only 0.48%, both of which met the set safety requirements. The expected network loss was 4.25 MW. This was also the lowest among all schemes. The integration scheme identified by the proposed approach had significant advantages in terms of capacity, reliability, and economy. The superior performance of Scheme {3,19} originates from the following reasons: Nodes 3 and 19 are located in the critical transmission corridors of the IEEE 30-bus system, possessing strong voltage support capability. The injected photovoltaic power can be efficiently delivered to load centers, reducing the risk of remote node voltage violations. Meanwhile, this integration scheme disperses power injection points and avoids excessive power accumulation at a single node. It effectively controls network power loss and improves photovoltaic hosting capacity.
To further reveal the composition of the comprehensive flexibility score, the contributions of each item to the score of Scheme {3,19} under different typical scenarios were decomposed, with the weights of the voltage deviation term, network loss term and violation penalty term set to 0.4, 0.3 and 0.3, respectively. The results are presented in Table 2.
Table 2 Composition of flexibility scores for scheme {3,19} in different typical scenarios
| Voltage | Network | Violation | ||
| Scenario | Deviation | Loss | Penalty | Total |
| Type | Contribution | Contribution | Contribution | Score |
| Sunny summer (High PV output) | 0.32 | 0.41 | 0.02 | 0.75 |
| Cloudy winter (Low PV output) | 0.45 | 0.38 | 0.05 | 0.88 |
| Evening peak load | 0.48 | 0.52 | 0.08 | 1.08 |
| Extreme violation scenario | 0.52 | 0.48 | 0.35 | 1.35 |
As indicated in Table 2, under normal operating conditions, the contribution of network loss to the score is slightly higher than that of voltage deviation; while in extreme violation scenarios, the violation penalty term becomes the dominant factor. Scheme {3,19} maintains low voltage deviation and network loss across all scenarios, and presents the minimum violation risk especially under heavy-load and extreme conditions, thus achieving the optimal comprehensive score.
3.3 Comparative Analysis of Computational Efficiency
In order to confirm the computational efficiency of the proposed method, a comparative analysis was performed at both the algorithm level and the framework level. At the algorithm level, the improved HEM was compared with the NR method, the forward-backward sweep method, and the Gauss-Seidel method based on the solution time for a single power flow solution for different sizes of systems. At the framework level, the proposed two-stage framework combining IPSO screening and HEM-LHS-MCS evaluation was compared against the Enumeration-Monte Carlo (Enum-MC) method, LHS-MCS, and the standard PSO-Newton method in terms of total computation time across different scenario sizes. To ensure evaluation fairness, all comparative algorithms are tested under identical hardware and software environments: an Intel Core i7-10700 CPU @ 2.90 GHz, 16 GB RAM, and MATLAB R2022b. The same convergence tolerance ( p.u.) and maximum iteration limit (100 iterations) are adopted uniformly. Furthermore, the overall computational efficiency is measured by the total runtime across 200 scenarios, rather than relying merely on the time consumption of a single power flow calculation. The corresponding results are presented in Figure 11.
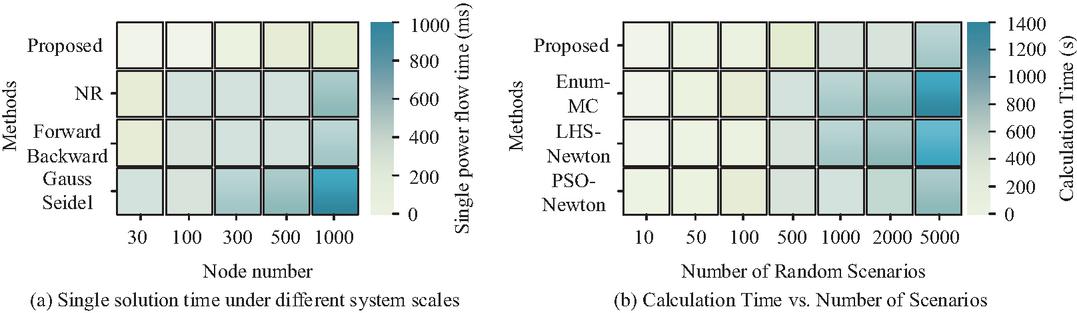
Figure 11 Computational efficiency comparison at the algorithm and framework levels.
As shown in Figure 11(a), the proposed method took only 2.13 ms per single computation, and 28.64 ms for a 1,000-bus system, substantially lower than the NR method (325.82 ms), the forward-backward sweep method (245.27 ms), and the Gauss-Seidel method (925.43 ms), demonstrating the superior scalability of the improved HEM. Figure 11(b) showed that under 2,000 random scenarios, the total computation time of the proposed method was 85.26 s, representing an efficiency improvement of 81.96% over Enum-MC and 72.98% over LHS-MCS. As the number of scenarios increased from 10 to 5,000, the computation time of the proposed method grew only from 0.85 s to 198.55 s, confirming its significantly lower sensitivity to scenario scale. Furthermore, the NR method requires iterative calculations for each individual scenario, while the improved HEM only needs one pre-calculation to determine the power-series coefficients. Such one-time preprocessing overhead can be fully amortized in massive scenario calculations, which constitutes the core advantage of high efficiency for large-scale stochastic evaluation.
In order to fully assess the engineering viability of the proposed approach, the power flow failure rate is used as a measure. It is defined as the number of failures divided by the total number of scenarios of the numerical stability of the approach. Memory efficiency is measured using the peak memory usage and memory release efficiency. The latter is calculated as the peak memory usage minus the post-execution memory, divided by the peak memory usage. Parallel performance is measured using the speedup obtained with 8 threads relative to the single thread case. Results are presented in Table 3.
Table 3 Numerical stability, memory efficiency, and parallel performance comparison
| Failure | Peak | Memory | ||
| Method | Rate (%) | Memory (MB) | Release (%) | Speedup |
| Proposed Method | 0.05 | 156.24 | 95.21 | 6.12 |
| Enum-MC | 0.12 | 285.42 | 88.33 | 3.85 |
| LHS-MCS | 0.08 | 218.73 | 92.16 | 4.25 |
| PSO-Newton | 0.1 | 192.35 | 90.52 | 5.35 |
In Table 3, the proposed algorithm had the lowest failure rate of power flow of 0.05%, which reflected the highest numerical stability. The peak memory usage was 156.24 MB, accounting for 54.75% of the memory usage of Enum-MC. The memory release efficiency was 95.21%, which reflected the highest resource recovery capability. The parallel speedup ratio was 6.12, and the parallel efficiency was 76.50%, indicating the highest parallel computing capability. These results demonstrated that the proposed method achieved high computational accuracy while making efficient use of computational resources and fully exploiting parallel performance.
4 Conclusion
To address the low computational efficiency and insufficient capability to cope with random fluctuations in distributed PV hosting capacity calculation under uncertain environments, this study proposes a two-stage collaborative evaluation approach. This approach combines a Lévy flight improved PSO and the analytic application optimization of HEM. The core innovations and contributions are summarized as follows:
(1) A node screening method based on Lévy flight-improved PSO is proposed. By introducing voltage sensitivity indicators, the collaborative optimization of hosting capacity, economic performance, and anti-disturbance capability is realized.
(2) An HEM–LHS–MCS evaluation framework based on the analytic application optimization of HEM is constructed. The node voltage is expressed as an explicit function of power injection. This achieves an iterative-free fast solution for massive scenarios.
(3) A comprehensive flexibility score is introduced to quantitatively evaluate the long-term operational robustness of integration schemes under uncertain environments.
Simulation results on the IEEE 30-bus system showed that the optimal integration scheme identified by the proposed method was {3, 19}. The maximum safe hosting capacity was 81.32 MW, which was 13.81% higher than that of the second-best scheme. The comprehensive flexibility score was only 1.23. These results demonstrate superior capacity performance and operational adaptability. In terms of computational efficiency, the proposed method required only 2.13 ms per single power flow solution and completed the full evaluation across 2,000 random scenarios in 85.26 s, achieving approximately 82% efficiency improvement over the traditional Enum-MC method. It also offered better numerical stability and parallel performance. These outcomes indicate that the proposed method achieves a good balance between evaluation accuracy and computational complexity. It can serve as an effective tool for the analysis of high-penetration PV grid integration planning.
Nevertheless, there is still room for further improvement in this study. First, the current validation is conducted only for conventional distribution networks. It does not cover complex modern power grids with a high proportion of power electronic devices. Future research may integrate multi-energy coupling and electricity market mechanisms to enhance engineering applicability. Second, the stochastic scenarios generated by independent probability distributions do not fully reflect the spatiotemporal correlation and reverse peak regulation characteristics of generation and load. A Copula-based joint distribution model can be adopted to optimize the fitting accuracy of scenarios. Third, the effectiveness of the optimal Scheme {3,19} is verified using global stochastic data. Differentiated verification for seasonal conditions has not been performed. Follow-up research can classify typical summer and winter operating conditions via cluster analysis. It can then evaluate the adaptability of the scheme in different scenarios and further strengthen the universality of the optimal solution under various meteorological and load conditions.
Funding
This research is supported by the Key Technology Project of China Southern Power Grid Co., Ltd. (GZKJXM20240244).
References
[1] Sun Z, Yu R, Zhu G, Xue Q. Resilience Improvement for Distributed Renewable Energy Grids: Integration of UAV-Assisted Live-Line Inspection and Real-Time Systems. Distributed Generation & Alternative Energy Journal, 2026, 41(02): 271–300. DOI:10.13052/dgaej2156-3306.4122.
[2] Sun B, Jing R, Ge L, Zeng Y, Dong S, Hou L. Quick hosting capacity evaluation based on distributed dispatching for smart distribution network planning with distributed generation. Journal of Modern Power Systems and Clean Energy, 2023, 12(1): 128–140. DOI:10.35833/MPCE.2022.000604.
[3] Xing J, Mu L. A Novel Islanding Detection Method for Distributed PV System Based on PMUs. IEEE Transactions on Smart Grid, 2023, 14(5): 3696–3706. DOI:10.1109/TSG.2023.3236790.
[4] Cheng Y, Li T. Low-Voltage Ride-Through Technology of Distributed Photovoltaic Inverters Based on Model Predictive Current Control. Distributed Generation & Alternative Energy Journal, 2026, 41(02): 355–386. DOI:10.13052/dgaej2156-3306.4125.
[5] Wanninayaka Mudiyanselage C D, Hasan K N, Vahidnia A, Rahman M T. Probabilistic coupled EV-PV hosting capacity analysis in LV networks with spatio-temporal modelling and copula theory. IET Smart Grid, 2024, 7(6): 917–928. DOI:10.1049/stg2.12189.
[6] Koirala A, Van Acker T, Hashmi M U, D’hulst R, Van Hertem D. Chance-constrained optimization based PV hosting capacity calculation using general polynomial chaos. IEEE Transactions on Power Systems, 2023, 39(1): 2284–2295. DOI:10.1109/TPWRS.2023.3258550.
[7] Fatima S, Püvi V, Pourakbari-Kasmaei M, Lehtonen M. Photovoltaic hosting capacity improvement based on the economic comparison between curtailment and network upgrade. IET Generation, Transmission & Distribution, 2023, 17(17): 3848–3860. DOI:10.1049/gtd2.12936.
[8] Cho K H, Kim J, Byeon G, Son W. Optimal sizing strategy and economic analysis of PV-ESS for demand side management. Journal of Electrical Engineering & Technology, 2024, 19(5): 2859–2874. DOI:10.1007/s42835-023-01734-2.
[9] Madavan A N, Dahlin N, Bose S. Risk-based hosting capacity analysis in distribution systems. IEEE Transactions on Power Systems, 2023, 39(1): 355–365. DOI:10.1109/TPWRS.2023.3238846.
[10] Atmaja W Y, Sarjiya, Putranto L M. Development of PV hosting-capacity prediction method based on Markov Chain for high PV penetration with utility-scale battery storage on low-voltage grid. International Journal of Sustainable Energy, 2023, 42(1): 1297–1316. DOI:10.1080/14786451.2023.2261759.
[11] Qammar N, Arshad A, Miller R J, Mahmoud K, Lehtonen M. Machine learning based hosting capacity determination methodology for low voltage distribution networks. IET Generation, Transmission & Distribution, 2024, 18(5): 911–920. DOI:10.1049/gtd2.12933.
[12] Hamdan I, Alfouly A, Ismeil M A. Hosting capacity improvement for solar systems based on model predictive controller of volt-watt-var smart inverter functions. International Journal of Modelling and Simulation, 2025, 45(2): 682–696. DOI:10.1080/02286203.2023.2237400.
[13] Karadeniz A, Balci M E, Hocaoglu M H. Improvement of PV unit hosting capacity and voltage profile in distorted radial distribution systems via optimal sizing and placement of passive filters. Electrical engineering, 2023, 105(4): 2185–2198. DOI:10.1007/s00202-023-01800-y.
[14] Qiu H, Veerasamy V, Ning C, Sun Q, Gooi H B. Two-stage robust optimization for assessment of PV hosting capacity based on decision-dependent uncertainty. Journal of Modern Power Systems and Clean Energy, 2024, 12(6): 2091–2096. DOI:10.35833/MPCE.2023.000488.
[15] Ramos A C S, Freitas F D, Zizzo G. Economic dispatch problem solution via holomorphic embedding method on IEEE 14-bus system for different loading scenarios. IEEE Transactions on Industry Applications, 2023, 60(2): 2664–2672. DOI:10.1109/TIA.2023.3344694.
[16] Domínguez Á B, Cerezo F M E, Rodriguez L R. A Convergence Control Scheme for Multi-Stage Holomorphic Embedding Load-Flow Method. IEEE Transactions on Power Systems, 2024, 40(1): 286–298. DOI:10.1109/TPWRS.2024.3401782.
[17] Tian P, Jin Y, Xie N, Wang C, Huang C. Power flow calculation for VSC-based AC/DC hybrid systems based on fast and flexible holomorphic embedding. Journal of Modern Power Systems and Clean Energy, 2024, 12(5): 1370–1382.
[18] Deng J, Wang Y. Application of Lévy flight particle swarm optimisation in MPPT of photovoltaic system. International Journal of Electronics, 2024, 111(7): 1143–1162. DOI:10.1080/00207217.2023.2210305.
[19] Challoob A F, Bin Rahmat N A, Ramachandaramurthy V K, Humaidi A J. Hybridization of CSA and PSO improves the efficacy of MPPT for solar photovoltaic array with partial shading. International Review of Applied Sciences and Engineering, 2024, 15(3): 323–337. DOI:10.1556/1848.2024.00751.
[20] Iweh C D, Akupan E R. Control and optimization of a hybrid solar PV – Hydro power system for off-grid applications using particle swarm optimization (PSO) and differential evolution (DE). Energy Reports, 2023, 10: 4253–4270. DOI:10.1016/j.egyr.2023.10.080.
[21] Prasad C H, Subbaramaiah K, Sujatha P. Economic Analysis by Optimal Placing of DGs in Distribution Networks by Particle Swarm Optimisation and Gravitational Search Optimisation Algorithm. Distributed Generation & Alternative Energy Journal, 2023, 38(03): 923–942. DOI:10.13052/dgaej2156-3306.3839.
[22] Zhang R, Liu H, Yang M, Wang J, Shang J. Network partitioning and hierarchical voltage regulation for distribution networks using holomorphic embedding method-based sensitivity. IET Generation, Transmission & Distribution, 2023, 17(3): 604–620. DOI:10.1049/gtd2.12745.
[23] Wu X, Chen W, Tian H, Yao Z, Zhao E, Guo Y. Optimization on Photovoltaics and Energy Storage Integrated Flexible Direct Current Distribution Systems of Buildings Considering Load Uncertainty Using Scenario Generation Method. Distributed Generation & Alternative Energy Journal, 2024, 39(2): 297–318. DOI:10.13052/dgaej2156-3306.3924.
Biographies

Qing-sheng Li (June 28, 1971), male, graduated from Guizhou Institute of Technology with a major in Power Systems and Automation, and obtained a bachelor’s degree. After graduation, I worked as a professor-level senior engineer at the Power Grid Planning and Research Center of Guizhou Power Grid Co., Ltd. My current research focuses on new energy storage, distribution networks, and power system simulation.

Xue-peng Mou (November 26, 1982), male, graduated from South China University of Technology with a master’s degree in Power Systems and Automation. After graduation, I worked as a senior engineer at the Power Grid Planning and Research Center of Guizhou Power Grid Co., Ltd. Currently, my research focuses on the operation and control of power systems.

Zhen Li (June 11, 1995), male, graduated from Guizhou University with a master’s degree in Electrical Engineering. After graduation, I worked as an engineer at the Power Grid Planning and Research Center of Guizhou Power Grid Co., Ltd. Currently, my research focuses on electricity pricing, demand-side response, and new energy storage-related work.

Li-shun Yang (December 14, 1990), male, graduated from Jinan University with a major in Automation and obtained a bachelor’s degree. After graduation, I worked as an engineer at Xingyi Power Supply Bureau of Guizhou Power Grid Co., Ltd. My current research focus is on distribution network planning and distribution automation.

Jian-shuai Guo (January 19, 1988), male, graduated from Guizhou University with a major in Electrical Engineering and Automation, earning a bachelor’s degree. After graduation, I worked as an engineer at the Duyun Power Supply Bureau of Guizhou Power Grid Co., Ltd. My current research focus is on primary planning of distribution networks.
Distributed Generation & Alternative Energy Journal, Vol. 41_4, 1003–1030
doi: 10.13052/dgaej2156-3306.4146
© 2026 River Publishers