Application Research of Intelligent Inspection Technology Based on Multi-Source Data Fusion in Digital Power Grid Construction
Shijun Weng1,*, Wenzhen Wang2, Zhuangwei Chen1, Jie Chen2 and Wei Zhao2
1Hainan Power Grid Co., Ltd., Haikou, 570203 Hainan, China
2Hainan Power Grid Co., Ltd. Construction Branch, Haikou, 570203 Hainan, China
E-mail: 45021652@qq.com
*Corresponding Author
Received 14 March 2026; Accepted 07 July 2026
Abstract
Intelligent inspection technology has become a key support to ensure the safe and stable operation of the power grid. In view of the shortcomings of traditional inspection methods in terms of efficiency, accuracy and adaptability, this paper proposes a multi-source fusion architecture for intelligent inspection for digital power grids. By integrating multi-source heterogeneous information such as Unmanned Aerial Vehicle (UAV) remote sensing data, sensor timing information, GIS geographic data and equipment operation and maintenance text, combined with dynamic threshold adjustment, spatiotemporal correlation analysis and cascade attention mechanism, a complete processing process covering data collection, feature extraction, multi-source fusion and decision output is constructed. Experimental verification shows that the model’s F1 score in fault detection reaches 94.8%. Moreover, the performance retention rate in a 5 dB strong noise environment reaches 85.4%, the inference speed reaches 98 frames/second, and the practicality score is 0.83, the generalization ability across data sets is 89.6%, and the scalability retention rate on a thousand-node scale is 93.6%, which significantly optimizes the timeliness of inspections and reduces the consumption of human resources. The multi-source fusion method can not only effectively improve the accuracy of power grid equipment condition monitoring and fault prediction, but also enhance the robustness and practicability of the system in complex environments, and promote the inspection technology to be adaptive and reliable. direction evolution.
Keywords: Digital grid, MFDF, intelligent inspection, cloud collaboration.
1 Introduction
As the core carrier of the intelligent transformation of the modern energy system, the construction process of the digital grid is profoundly changing the operation and maintenance model of the power system. However, traditional inspection technology still faces severe challenges. For example, existing methods mainly rely on a single data source or simple multi-source superposition, and it is difficult to cope with the inconsistency of heterogeneous data in the power grid environment on the spatial and temporal scale. There is an information-island phenomenon in the inspection process, and coordination efficiency among personnel is low. Moreover, the fixed threshold early warning mechanism has a high false alarm rate and is difficult to adapt to the dynamically changing power grid environment. At the same time, the uneven allocation of computing resources under large-scale deployment leads to insufficient real-time performance. These problems seriously restrict the accuracy and reliability of intelligent inspections, and innovative solutions are urgently needed.
This paper proposes and validates a novel intelligent inspection method based on Multi-Source Data Fusion (MFDF), which integrates multi-source data such as UAV remote sensing, sensor timing, GIS geographic information and operation and maintenance text by building a hierarchical fusion architecture to break through traditional limitations. The proposed framework introduces three key innovations: proposing a multi-modal data adaptive alignment mechanism to solve the problem of heterogeneous data integration, designing a two-layer anomaly detection model combined with dynamic statistics and correlation mining to reduce false alarm rates, and developing a lightweight edge-cloud collaboration framework to optimize resource allocation. The main contribution of this research is to establish a complete intelligent inspection technology system. Through algorithm innovation and system verification, it provides theoretical support and practical paths for improving power grid inspection efficiency and reducing operation and maintenance costs.
The proposed MFDF framework integrates heterogeneous information from UAV remote sensing, sensor measurements, GIS data, and operation and maintenance records within a unified fusion architecture, enabling coordinated utilization of multi-source information that is often processed independently in conventional intelligent inspection systems. Through adaptive data alignment, spatiotemporal feature extraction, and edge-cloud collaborative processing, the framework enables comprehensive analysis of equipment operating conditions and fault characteristics. The resulting multi-source information interaction mechanism enhances detection reliability and robustness while maintaining scalability and computational efficiency for intelligent inspection applications in digital power grid environments.
2 Related Works
With the in-depth advancement of digital power grid construction, the application of MFDF technology in the field of intelligent inspection has become a research hotspot.
(1) Power grid fault diagnosis and anomaly detection The core issue in this field lies in how to enhance the accuracy and real-time performance of fault identification through multi-source data, in order to address abnormal events in the complex operating environment of power grid equipment. Early research, such as Wu et al. [1], developed a fault diagnosis system based on multi-source information fusion. By integrating sensor data and historical records, it achieved preliminary detection of common faults in the power grid. However, this method relied on traditional statistical models and had limited ability to capture nonlinear relationships. Zeng et al. [2] introduced information entropy theory to optimize the fusion process, improving the reliability of fault diagnosis. However, their model lacked robustness in strong noise environments. To further reduce the false alarm rate, Wu et al. [3] proposed a data fusion method based on self-attention mechanism, specifically designed for detecting False Data Injection Attacks (FDIAs). They achieved high-precision identification through deep learning, but the computational complexity was high, making it difficult to apply to resource-constrained edge devices. Wu et al. [4] further constructed a hybrid deep network that fused sensor data and network traffic information, performing well in the early stages of FDIA detection, but the interpretability of the model needed to be enhanced. In renewable energy scenarios such as wind power, Liang et al. [5] designed a multi-information fusion algorithm for converter faults, combining signal processing and machine learning to effectively improve diagnosis efficiency. However, the model’s generalization ability was limited to specific equipment types. Yang et al. [6] utilized attention mechanism and residual network to fuse multi-source data, achieving rapid localization of open-circuit faults in cascaded H-bridge inverters. The innovation lay in the parallel fusion architecture, but the challenge of multi-modal data spatiotemporal alignment remained unresolved. Parai et al. [7] applied multi-source fusion technology to analog circuit parameter fault diagnosis, improving detection sensitivity through feature-level fusion. However, the scalability of this method in large power grids remains to be verified. Additionally, Xu et al. [8] applied D-S evidence theory to DC cable insulation defect identification, reducing the false alarm rate by fusing multi-source information. However, the strategy for handling evidence conflicts was still crude.
(2) Power system forecasting and state estimation This direction focuses on enhancing the prediction accuracy of power grid operational parameters through data fusion, in order to support dynamic scheduling and risk prevention and control. Ye et al. [9] achieved grid-level load forecasting based on MFDF, integrating meteorological, historical load, and real-time monitoring data, significantly reducing prediction errors. However, the model exhibited strong dependence on data quality. In the context of wind power scenarios, Wang et al. [10] proposed an AI-driven power forecasting framework. By integrating multi-source information such as wind speed and turbine status, it improved stability under renewable energy integration. Nevertheless, the model demonstrated insufficient adaptability under extreme weather conditions. To address the voltage fluctuation issues brought about by a high proportion of photovoltaic grid integration, Zhang et al. [11] developed a deep multi-fidelity Bayesian fusion method. Through probabilistic modeling, enhancing decision reliability under uncertainty. However, the computational resource consumption was high, making it difficult to meet real-time requirements. Regarding the issue of outage location, Yuan et al. [12] employed a probabilistic graphical model to fuse multi-source data, achieving accurate location of outage areas in the distribution network. Its advantage lies in handling incomplete data, but real-time performance needs to be optimized. Although these studies have made progress in prediction accuracy, the dynamic integration mechanism of multi-source heterogeneous data is still imperfect, especially when dealing with spatiotemporal asynchronous data.
(3) Innovation in data fusion methods Research on core data fusion technology is dedicated to addressing algorithmic bottlenecks in heterogeneous data integration, such as inconsistency, high dimensionality, and computational efficiency issues. He et al. [13] conducted a systematic review of multi-source information fusion technology in intelligent power distribution systems, emphasizing the collaborative analysis value of structured and unstructured data, laying the foundation for subsequent application research. Wu and Hu [14] designed a model based on heterogeneous data fusion for substation safety control systems, capturing equipment associations through graph neural networks and enhancing safety warning capabilities. However, their model exhibits weak adaptability to topological changes. In terms of spatial data fusion, Su et al. [15] utilized drone LiDAR technology to achieve automatic fusion of multi-source data in power corridors, improving inspection efficiency through the combination of point clouds and images. However, this method requires high hardware configuration. Ganjkhani et al. [16] proposed a real-time anomaly classification and localization framework, enhancing system response speed through streaming data aggregation. In terms of knowledge-driven fusion, Han et al. [17] combined knowledge graphs and data fusion to manage quality issues in power equipment, improving decision interpretability. However, the knowledge update mechanism is not robust. Sun et al. [18] designed a heterogeneous multi-parameter feature-level fusion framework for power sensing terminals, verifying its applicability across multiple scenarios. However, they did not fully consider the demand for lightweight computation. Dai et al. [19] evaluated the state of transmission lines based on multi-source parameter fusion. Their method performed robustly in experiments but relies on preset thresholds and lacks sufficient dynamic adjustment capabilities. Wang and Zhao [20] evaluated the state of distribution network equipment based on big data fuzzy decision-making, optimizing maintenance strategies through the fusion of historical operational data. However, their model exhibits weak recognition ability for emerging fault modes.
(4) Application of intelligent warning and management system This direction focuses on the practical deployment of multi-source fusion technology in power grid operation and maintenance, aiming to build an efficient and adaptive intelligent inspection system. Cao et al. [21] developed a comprehensive intelligent warning system for power grids, which integrates temporal, image, and text data to achieve multi-level risk early warning. However, the system has limited generalization ability when applied across regions.
The integration of intelligent inspection technologies and multi-source information processing has also attracted increasing attention in modern power-system applications. Tan et al. [22] developed a data-fusion-based intelligent fault diagnosis framework for wind power generation systems, demonstrating the effectiveness of heterogeneous information integration for improving fault identification performance and operational reliability. Furthermore, Sun et al. [23] investigated a UAV-assisted live-line inspection approach for distributed renewable energy grids, highlighting the role of intelligent inspection technologies in enhancing system resilience and monitoring efficiency. These studies further demonstrate the value of combining intelligent inspection strategies with multi-source information analysis to support the development of digital and resilient power-grid infrastructures.
Wang et al. [24] proposed a digital twin-based monitoring framework for substation secondary systems in distributed generation networks, enabling improved real-time monitoring and fault analysis. Liu et al. [25] introduced a GCN-enhanced digital twin model for distribution network situation perception, improving fault localization and system awareness. These studies highlight the role of digital twin and graph-based methods in smart grid monitoring, while the proposed MFDF framework further extends this by integrating multi-source fusion and spatiotemporal learning for enhanced fault diagnosis.
Based on existing literature, there are still significant deficiencies in the application of MFDF in intelligent inspection: Firstly, most methods rely on a single data source or simple superimposed fusion, lacking an adaptive alignment mechanism for the spatiotemporal inconsistency of heterogeneous data; secondly, fault detection models often adopt fixed thresholds, resulting in high false alarm rates and difficulty in adapting to dynamic power grid environments; in addition, the optimization of computational resource allocation is insufficient, limiting real-time performance in large-scale deployments. This paper proposes a multi-source fusion framework for intelligent inspection in digital power grids (MFDF) to address these shortcomings. Through multi-modal data adaptive alignment, a two-layer anomaly detection model, and a lightweight edge-cloud collaborative framework, it integrates multiple sources of data such as drone remote sensing, sensor time series, GIS geographic information, and operation and maintenance text, aiming to improve inspection accuracy, robustness, and practicality.
Existing multi-source data fusion methods have been widely applied to fault diagnosis, state estimation, anomaly detection, and equipment monitoring; however, these functions are typically addressed separately rather than within a unified intelligent inspection framework. The proposed MFDF framework distinguishes itself through three key innovations. An adaptive multimodal alignment mechanism integrates UAV imagery, sensor time-series data, GIS information, and maintenance records while addressing spatial and temporal inconsistencies among heterogeneous data sources. A dual-layer anomaly detection strategy combining dynamic threshold adjustment and spatiotemporal correlation analysis improves detection reliability and reduces false alarms under varying operating conditions. A lightweight edge-cloud collaborative framework further supports efficient real-time deployment in large-scale digital power grids. By jointly integrating heterogeneous data alignment, anomaly detection, spatiotemporal modeling, and deployment optimization within a single architecture, MFDF provides a more comprehensive intelligent inspection solution than existing methods that address these challenges independently.
3 Intelligent Inspection Algorithm Model Based on MFDF
3.1 Overall Architecture Design
This paper proposes an intelligent inspection multi-source fusion architecture for digital power grids, by integrating multi-source information such as drone remote sensing data, sensor time-series data, GIS geographic information, and equipment operation and maintenance text, and combining dynamic threshold adjustment and spatiotemporal correlation analysis, this architecture achieves real-time monitoring and fault prediction of power grid equipment status. The innovations include:
(1) Multimodal data adaptive alignment mechanism: addressing the inconsistency issue of heterogeneous data across spatiotemporal scales;
(2) Dual-layer anomaly detection model: Combining dynamic statistical analysis and association mining to significantly reduce the false alarm rate;
(3) Lightweight edge-cloud collaborative inference framework: Optimize the allocation of computational resources to meet the real-time inspection needs of large-scale power grids.
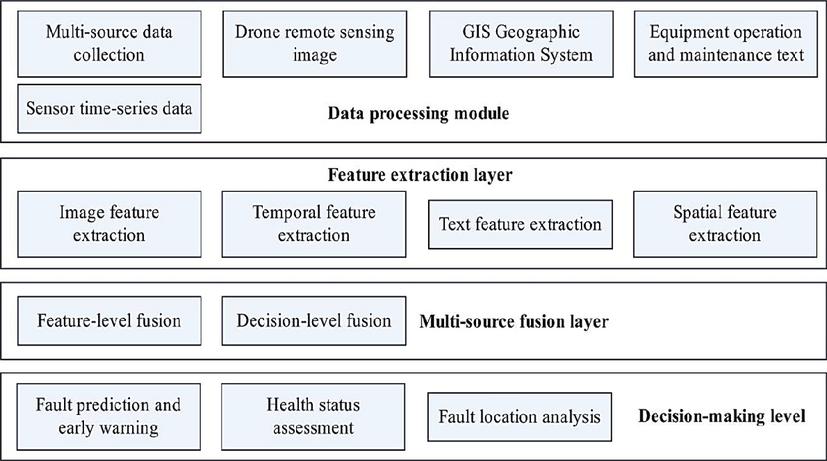
Figure 1 Overall workflow of the system.
The overall workflow of the system is illustrated in Figure 1. The proposed intelligent inspection framework operates through four sequential stages. First, multi-source data acquisition collects heterogeneous information from UAV platforms, IoT sensors, GIS databases, and equipment operation and maintenance records. Next, data preprocessing and feature extraction are performed to obtain representative features from different data modalities. Subsequently, the multi-source fusion module integrates spatial, temporal, and semantic information to construct comprehensive equipment-state representations. Finally, the fault prediction and health assessment module analyzes the fused features to support real-time monitoring, anomaly detection, and intelligent inspection decision-making. Initially, multi-source data are collected through Internet of Things (IoT) sensors, drone aerial photography, and Supervisory Control and Data Acquisition (SCADA) systems, and are preprocessed before being input into the feature extraction module. Subsequently, the fusion module employs a cascaded attention mechanism to integrate heterogeneous features. Finally, the equipment health status assessment is output through the fault prediction model. This architecture supports real-time monitoring and offline analysis, adapting to the dynamically changing environment of the digital grid. Practical deployment of intelligent inspection systems in digital power grids requires careful consideration of cybersecurity, data privacy, and communication reliability. The proposed edge-cloud collaborative architecture provides a foundation for secure data exchange and controlled data access, thereby supporting information security and privacy protection. Furthermore, local processing at edge nodes enables inspection continuity during communication interruptions, while data buffering and redundant communication mechanisms enhance operational reliability under complex network conditions.
Figure 2 presents a conceptual Simulink-style architectural representation of the proposed MFDF intelligent inspection framework. The diagram illustrates the complete processing pipeline, including multi-source data acquisition, preprocessing, feature extraction, cascade attention fusion, spatiotemporal graph convolutional analysis, fault prediction, and adaptive warning generation. It provides a clear visualization of data flow and interactions among modules in the proposed intelligent inspection system.
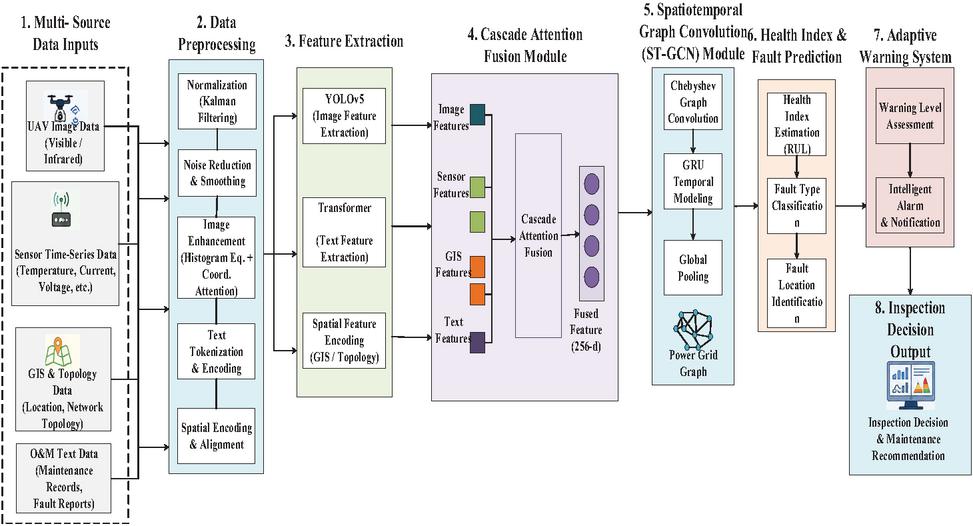
Figure 2 Conceptual Simulink-style architecture of the proposed MFDF system.
3.2 Multi-source Data Preprocessing and Feature Extraction
3.2.1 Dynamic normalization and noise reduction of time series data
Figure 3 shows the complete process of multi-source data preprocessing and feature extraction. The figure adopts a hierarchical design structure, and presents three stages of data input, a preprocessing module and feature extraction from left to right. The figure clearly shows the parallel processing channels of four types of data sources. Sensor time series data are denoised by sliding window normalization and Kalman filtering. UAV remote sensing images undergo histogram equalization and coordinate attention enhancement. GIS geographic information is spatially encoded. Text data is transformed by word segmentation and embedding representation. It is particularly noteworthy that arrow symbols are used in the figure to clarify the data flow direction between modules, and the eigenvectors of different modes are distinguished by color. Transformer encoder work in parallel to finally output feature representations of unified dimensions, providing standardized inputs for subsequent fusion modules. Heterogeneous data sources require modality-specific preprocessing before fusion. Sensor time-series data are denoised and normalized using sliding-window normalization and Kalman filtering. UAV remote sensing images are enhanced through histogram equalization and coordinate attention enhancement. GIS information is spatially encoded into structured feature representations, while operation and maintenance text records are converted into semantic embeddings using a Transformer-based model. The extracted features are subsequently mapped into a unified feature space to reduce differences in scale, format, and dimensionality prior to multimodal fusion.
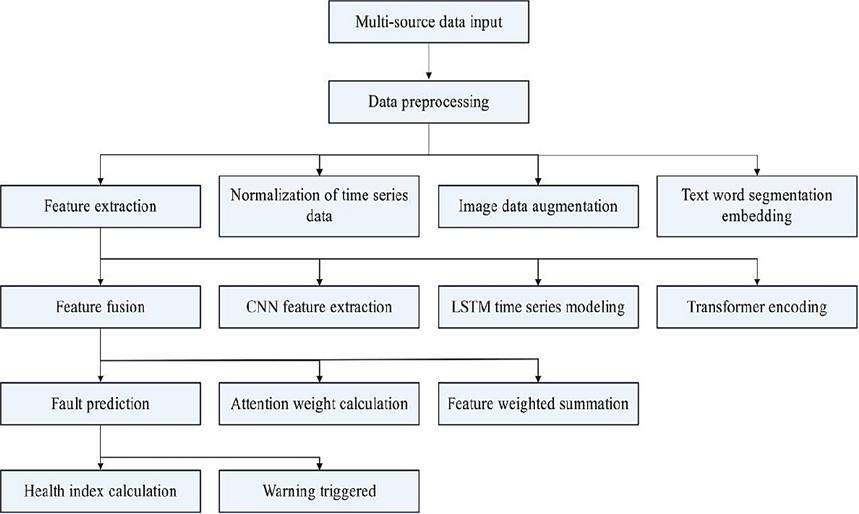
Figure 3 Multi-source data preprocessing and feature extraction.
There are dimensional differences and noise interference in the time series data such as current, voltage and temperature generated by power grid sensors. In this paper, the dynamic normalization method based on sliding window is adopted, and its mathematical expression is:
| (1) |
Among them, represents the original data point at time and are the mean and standard deviation of the data within window , respectively, and is a constant used to prevent division by zero. The window size is adaptively adjusted based on the data sampling frequency.
| (2) |
Among them, is the sampling frequency and is the adjustment factor (usually 5–10).
The state space model is expressed as:
| (3) |
is the state transition matrix, is the control input matrix, is the control vector, is the process noise, is the observed value, is the observation matrix, and is the observation noise. The Kalman gain is calculated as follows:
| (4) |
Among them, is the prior estimation covariance matrix. The status update formula is:
| (5) |
3.2.2 Image data enhancement and feature extraction
This paper improves the YOLOv5 model by combining multi-scale attention mechanism. First, adaptive histogram equalization is used to enhance contrast:
| (6) |
Among them, is the transformation function, is the number of gray levels, is the image size, and is the gray-level histogram.
The coordinate attention (CA) module improves small target detection capabilities by capturing spatial long-range dependencies.
| (7) |
is the input feature map, is the channel attention vector, and are spatial attention vectors, is the Sigmoid function, and and are the attention weights in the height and width directions, respectively.
The loss function adopts Complete Intersection over Union (CIoU) loss:
| (8) |
Among them, IoU represents the intersection over union (IoU), represents the Euclidean distance, and represent the center points of the predicted bounding box and the ground truth bounding box, respectively, represents the length of the diagonal of the minimum bounding rectangle, and measures the consistency of the aspect ratio.
| (9) |
The weight coefficient is .
3.2.3 Text data embedding representation
The equipment operation and maintenance record text extracts features through a pretrained model based on Transformer. First, the text is segmented and mapped into a word vector:
| (10) |
The multi-head self-attention mechanism is calculated as:
| (11) |
is the projection matrix, is the number of heads, is the dimension of each head, and is the output projection matrix.
Position Feed-Forward Network (FFN) enhances nonlinear representation capabilities:
| (12) |
Among them, and are weight matrices, and is usually set to .
3.3 MFDF Model
3.3.1 Cascade attention fusion module
In this paper, a cascade attention fusion mechanism as shown in Figure 3 is designed to improve the robustness of the model through two-stage fusion. The cascade attention fusion module adopts a two-stage structure. Feature-level attention is first applied to adaptively weight and integrate features extracted from sensor, UAV, GIS, and text modalities within a unified feature space. Decision-level attention is then used to refine the fused output by emphasizing reliable modality responses and reducing the influence of inconsistent information. This hierarchical process improves the effectiveness of heterogeneous data fusion. During implementation, features from sensor, UAV, GIS, and text data are projected into a unified feature space, where cross-attention is employed to assign modality-specific weights. The weighted features are then aggregated to obtain the final fused representation.
Feature-level fusion uses multi-head cross-attention to calculate the weight of each modal:
| (13) |
Among them, is the eigenvector of the -th mode, is the global contextual feature, is the weight matrix, and is the attention vector.
Decision-level fusion combines prediction results, and the basic probability allocation function is defined as:
| (14) |
Among them, and represent the confidence assignments for different modalities, and measures the degree of conflict between the evidence.
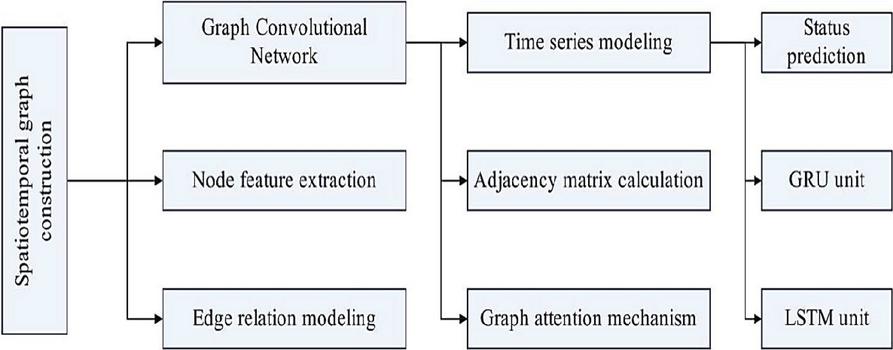
Figure 4 Spatiotemporal graph convolutional network.
3.3.2 Spatiotemporal graph convolutional network
Figure 4 vividly presents the topology of the Spatiotemporal Graph Convolutional Network (ST-GCN). The graph adopts the node-edge network visualization method to map power grid devices into vertices in the graph structure, and the connection relationship between devices is expressed as edges. In the figure, nodes of different shapes are used to distinguish equipment types such as transformers and circuit breakers, and the thickness of the edges reflects the connection strength. The network structure is shown as a two-layer design: the bottom spatial convolutional layer realizes neighborhood information aggregation through Chebyshev polynomial approximation, and the upper temporal convolutional layer uses gated cyclic units to capture the dynamic evolution law. The spectral decomposition process of graph Fourier transform and the message passing mechanism in feature propagation are specifically marked in the figure. Through the three-dimensional coordinate axis display, the figure clearly embodies the joint modeling idea of spatial dimension and time dimension, in which the Z axis represents the time series, and the X-Y plane shows the spatial distribution of equipment.
The power grid topology is modeled as a graph structure , where nodes represent devices and edges represent connection relationships. Each power grid component is represented as a graph node, while electrical and geographical relationships are modeled as graph edges. Graph convolution and GRU operations are jointly applied to capture spatial dependencies and temporal dynamics for fault analysis. The spatiotemporal graph convolution operation captures spatial dependencies through spectral graph convolution:
| (15) |
To reduce computational complexity, Chebyshev polynomial approximation is adopted:
| (16) |
Among them, is the scaled Laplacian matrix, is the Chebyshev polynomial, and represents learnable parameters.
The temporal dimension is modeled dynamically through a Gated Recurrent Unit (GRU):
| (17) |
represents the update gate, represents the reset gate, and represents element-wise multiplication.
3.4 Fault Prediction and Health Management
3.4.1 Health index calculation
Figure 5 constructs the decision flow chart of fault prediction and health management. The figure adopts a closed-loop control structure. It uses health index calculation as the core and includes four main links: status monitoring, threshold judgment, early warning trigger and decision feedback. In the figure, the real-time changes of the device health index (HI) are visually displayed in the form of dashboard, and the state degradation process is represented by color gradient (green-yellow-red). In the early warning mechanism part, the chart uses a dynamic threshold curve to show the comparison between historical data and real-time monitoring values, highlighting the outlier detection logic. The fault propagation model is represented by Markov state transition diagram, in which the nodes represent the equipment state and the directed edges label the transition probability. The figure also includes a maintenance strategy generation module, which shows the processing schemes corresponding to different fault levels through the decision tree structure.
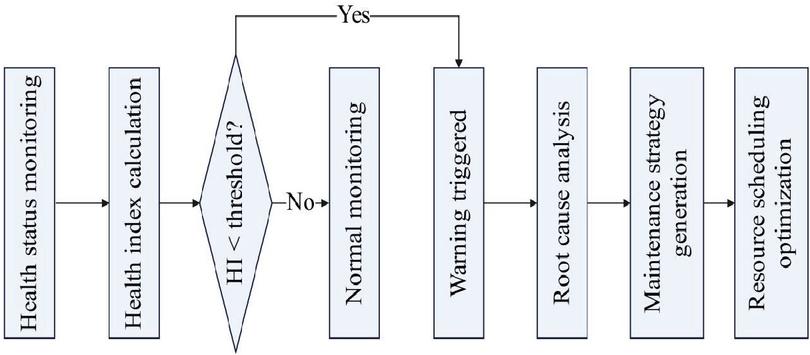
Figure 5 Fault prediction and health management.
By fusing multi-source features, a device Health Index (HI) is constructed, and its calculation is based on weighted feature fusion and regularization constraints:
| (18) |
Among them, represents the Sigmoid function, and represents the feature weights, which are learned through an attention mechanism:
| (19) |
The regularization term prevents overfitting, and is a hyperparameter.
The dynamic update mechanism of health index considers equipment aging factors:
| (20) |
Among them, is the forgetting factor, and is the change in health at the current time.
3.4.2 Adaptive early warning mechanism
The early warning threshold is dynamically adjusted according to historical data to avoid false alarms caused by fixed thresholds:
The warning threshold is adaptively updated based on the statistical characteristics of monitoring observations within the analysis window. Specifically, the threshold is determined by the baseline threshold and the standard deviation of the observed data. Under stable operating conditions, the threshold remains close to the baseline value, whereas increased operational fluctuations result in a higher threshold, thereby reducing false alarms while maintaining sensitivity to abnormal conditions.
| (21) |
Among them, is the baseline threshold, is the sensitivity coefficient, and is the predicted value. The anomaly score is calculated as follows:
| (22) |
Among them, represents the sliding standard deviation. A warning is triggered whens . The warning threshold is dynamically updated based on the statistical characteristics of recent monitoring data. An alarm is generated when the anomaly score exceeds the adaptive threshold, enabling fault detection under varying operating conditions while reducing false alarms caused by fixed thresholds.
The fault propagation model uses Markov process to describe the state transition:
| (23) |
The state transition probability matrix is estimated by historical data to realize fault prediction.
3.5 Model Optimization and Training Strategy
Figure 6 systematically illustrates the implementation scheme of model optimization and training strategy. The figure takes the form of a flow block diagram, which describes in detail the complete training cycle from parameter initialization to model convergence. The figure highlights the parallel structure of the multi-task learning framework, in which the main task (fault classification) and auxiliary tasks (life prediction, anomaly detection) are hard shared through the parameter sharing layer. The optimization algorithm part shows the parameter updating process of AdamW optimizer in the form of computational graph. The cosine annealing curve is drawn in the learning rate scheduling part, and the key stages of warm-up period, stable period and decline period are marked. The loss function calculation part shows the combination of focus loss and Huber loss through formula explosion diagram, and distinguishes the contribution degree of different loss terms by color coding.
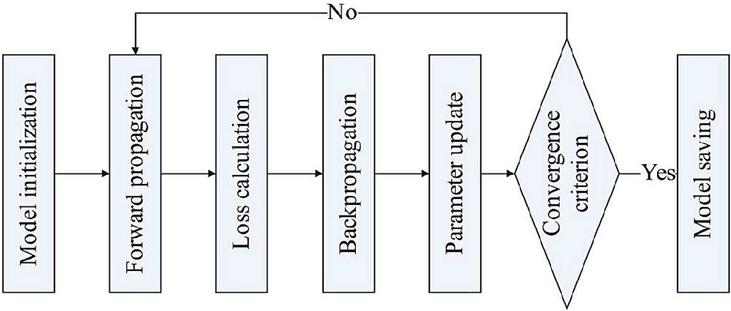
Figure 6 Model optimization and training strategy.
A multi-task learning structure with hard parameter sharing is adopted. The main task is fault classification, and the auxiliary tasks include equipment life prediction and anomaly detection. The loss function combination is:
| (24) |
Among them, the classification loss adopts focus loss to solve the category imbalance:
| (25) |
Regression loss enhances robustness using Huber loss:
| (26) |
AdamW optimizer is used, combining weight attenuation with learning rate warm-up:
| (27) |
The learning rate is adjusted by the cosine period:
| (28) |
Among them, is the current training steps and is the total number of steps.
3.6 Computational Complexity Analysis
The computational complexity of the proposed MFDF framework is primarily determined by the spatiotemporal graph convolution module, the Transformer-based text encoding module, and the multi-modal fusion mechanism.
For the spatiotemporal graph convolution (Chebyshev-based GCN with order ), the time complexity is approximately , where is the number of edges and is the feature dimension. The temporal modeling using GRU introduces an additional complexiy of , where denotes the sequence length. The Transformer-based text encoder contributes a complexity of , where is the text sequence length and is the embedding dimension. The multi-modal attention fusion module operates approximately in , where is the number of modalities.
Therefore, the overall time complexity of the MFDF framework can be approximated as:
| (29) |
The space complexity is mainly determined by graph feature storage, temporal hidden states, and multimodal feature representations, and can be expressed as:
| (30) |
Although the computational cost increases with graph size and sequence length, the proposed edgecloud collaborative architecture reduces the computation burden at individual nodes by distributing processing across layers. This design improves efficiency in large-scale deployments.
4 Model Performance Verification Test
This section aims to comprehensively verify the comprehensive performance of the proposed MFDF Intelligent Inspection Algorithm (MFDF) in the digital grid environment through systematic experimental design. The experiment will conduct comparative analysis with current mainstream advanced models from multiple dimensions, including accuracy, robustness, practicality, interpretability, generalization ability, and scalability, using rigorous data to demonstrate the effectiveness and progressiveness of the proposed model.
4.1 Test Method
This paper utilizes three representative global public datasets to establish an evaluation benchmark, ensuring the comprehensiveness and fairness of the experiment. The UAV remote sensing data were obtained from the Electrical Fault Detection and Classification dataset on the Kaggle platform. Sensor temporal data were sourced from the UCI Household Electric Power Consumption dataset. GIS information was derived from the spatial location and network topology attributes associated with the power equipment records. Operation and maintenance text data were obtained from the IEEE DataPort Power System Fault Report corpus, which contains equipment fault reports, maintenance records, and inspection logs. The sensor time-series data originates from the “Household Electricity Consumption” dataset in the UCI Machine Learning Repository, encompassing over 2 million multi-dimensional time-series records. The visual data of power grid equipment is sourced from the “Electrical Fault Detection” dataset on the Kaggle platform, featuring tens of thousands of visible light and infrared images of insulators, circuit breakers, and other equipment. The textual data on equipment status is drawn from the “Power System Fault Report” corpus on IEEE DataPort. The UCI Household Electric Power Consumption dataset contains 2,075,259 measurements collected at a one-minute sampling rate over 47 months, providing baseline operational data. The Electrical Fault Detection and Classification dataset comprises approximately 12,000 simulated samples covering LG, LL, LLG, LLL, and LLLG fault conditions. The Power System Faults dataset includes 506 records spanning line breakage, transformer failure, and overheating events under diverse environmental conditions. Collectively, these datasets provide both normal operating data and diverse fault scenarios for comprehensive model evaluation. All datasets undergo a rigorous preprocessing workflow: time-series data is smoothed and aligned using dynamic normalization based on sliding windows and Kalman filtering; image data is enhanced through adaptive histogram equalization and a coordinate attention mechanism to highlight key features; textual data is tokenized and semantically embedded using a Transformer model, ultimately mapping multi-source heterogeneous data into a 256-dimensional feature space to provide consistent input for subsequent fusion. The heterogeneous datasets were aligned using common equipment identifiers, geographic locations, and synchronized inspection time windows. UAV images, sensor measurements, GIS information, and operation and maintenance text records corresponding to the same equipment and inspection period were combined into unified samples. Each sample consisted of one UAV image, one sensor feature vector, one GIS feature vector, one text embedding, and a common fault label, ensuring spatial, temporal, and semantic consistency before feature fusion. Robustness evaluation was performed by injecting additive Gaussian white noise (AWGN) into the sensor time-series data at signal-to-noise ratio (SNR) levels of 20 dB, 10 dB, and 5 dB. The noisy samples were generated using zero-mean Gaussian noise with variance adjusted to achieve the target SNR. To further assess resilience to incomplete observations, random data masking with missing rates of 15% and 30% was applied. Model robustness was quantified using the performance retention rate, calculated as the percentage of baseline performance preserved under noisy and incomplete data conditions.
All experiments were conducted on a workstation equipped with an NVIDIA RTX 3080 GPU, an Intel Core i9 processor, and 256 GB RAM. The models were implemented using Python and PyTorch under the Windows operating system. The reported inference speed was measured using a batch size of one under the same computational environment for all compared methods. The proposed MFDF framework was validated using an offline dataset-based evaluation approach. Performance assessment was conducted under controlled experimental conditions using publicly available benchmark datasets rather than cross-validation, real-time deployment, or hardware-in-the-loop simulation. The evaluation focused on fault detection accuracy, robustness, generalization ability, interpretability, and scalability. The generalization evaluation is conducted through cross-dataset validation using heterogeneous datasets with different fault distributions and operating conditions, while scalability testing is performed on progressively enlarged simulated power grid networks ranging from 100 to 1000 nodes to assess performance stability under increasing system complexity. Validation was performed using multiple benchmark datasets encompassing diverse fault categories, operating conditions, and heterogeneous data modalities. In addition, comparative evaluation against representative machine learning and deep learning models was conducted to assess the effectiveness, robustness, and adaptability of the proposed MFDF framework across different intelligent inspection scenarios.
The experimental subjects encompass the MFDF model proposed in this paper, alongside five cutting-edge baseline models: SVM, CNN, LSTM, YOLOv5, and BERT. The selected baseline models represent widely adopted approaches for intelligent inspection and fault detection tasks. SVM was selected as a representative traditional machine learning method, CNN and YOLOv5 as image-based deep learning models, LSTM as a temporal sequence modeling approach, and BERT as a text semantic analysis model. These benchmark methods cover conventional machine learning, visual inspection, temporal feature learning, and textual information processing, enabling a comprehensive evaluation of the proposed MFDF framework across different data modalities and fault detection paradigms. The comparative experimental design spans seven dimensions: performance comparison tests (evaluating core metrics such as accuracy and F1 score), robustness tests (simulating noise of varying intensities and data $$$$$$), practicality tests (measuring inference speed and resource consumption), ablation tests (analyzing the contribution of each module), interpretability tests (quantifying the consistency between model decisions and expert knowledge), and supplementary generalization tests (cross-dataset and cross-regional validation) and scalability tests (testing the model’s ability to handle power grids of different sizes). Among these, the interpretability tests involved 10 power system engineers with over 5 years of experience for evaluation.
The practicality score is a composite indicator that evaluates deployment efficiency by combining normalized inference speed, memory footprint, and energy consumption. Higher inference speed and lower resource requirements contribute to a higher practicality score. Generalization ability is quantified using the average Domain Adaptation Accuracy (DA-Acc) obtained across unseen target datasets without additional fine-tuning and is calculated as the arithmetic mean of the individual DA-Acc values. The scalability retention rate is defined as the percentage of the baseline F1-score preserved under larger network topologies and is calculated as the ratio between the F1-score achieved at the target scale and the corresponding baseline F1-score obtained on the small-scale network.
4.2 Test Results
(1) Performance comparison test
In this test, all models are independently trained to convergence, and the results are shown in Table 1.
Table 1 Performance comparison of baseline models with input data types and evaluation protocol
| Accuracy | Recall | F1 | ||||
| Models | Input Data | Evaluation Protocol | Rate | Precision | Rate | Score |
| SVM | Sensor features | 70% Train – 30% Test split | 82.3 | 81.5 | 80.7 | 81.1 |
| CNN | Image data | 70% Train – 30% Test split | 88.7 | 87.9 | 87.2 | 87.5 |
| LSTM | Timeseries sensor data | 70% Train – 30% Test split | 89.2 | 88.4 | 88.1 | 88.2 |
| YOLOv5 | UAV inspection images | 70% Train – 30% Test split | 91.5 | 90.8 | 90.3 | 90.5 |
| BERT | Textual reports | 70% Train – 30% Test split | 90.1 | 89.3 | 88.9 | 89.1 |
| This article (MFDF) | Image + Sensor + GIS + Text | 70% Train – 30% Test split | 95.8 | 94.9 | 94.7 | 94.8 |
As shown in Table 1, the proposed MFDF model achieves the highest performance among all compared methods, with an F1-score of 94.8%. Compared with both traditional machine learning and deep learning baseline models, MFDF demonstrates superior fault detection performance. In particular, it achieves a 4.3 percentage point improvement over the best-performing baseline model (YOLOv5), highlighting the effectiveness of the proposed multi-source data fusion framework for intelligent power grid inspection. All baseline models are evaluated using different input modalities such as sensor data, image data, time-series data, and textual reports, while the proposed MFDF integrates multi-source data including image, sensor, GIS, and text. A consistent evaluation protocol with a 70% training and 30% testing split is applied to all models to ensure fair and unbiased performance comparison.
Similar improvements are observed in precision and recall metrics, indicating that the integration of sensor, image, and textual information enables more comprehensive feature extraction. These results demonstrate that the proposed multi-source fusion strategy effectively enhances fault detection accuracy and classification reliability compared with conventional machine learning and single-modal deep learning approaches.
(2) Robustness test
In this test, by injecting Gaussian noise (5 dB–20 dB) with different signal-to-noise ratios into the test data and randomly masking some data (missing rate 15%–30%), the interference and data incompleteness in reality are simulated, and the decline of model performance is evaluated to test its stability. The results are shown in Table 2.
Table 2 Robustness test results (% performance retention)
| This Article | ||||||
| Disturbance Condition | SVM | CNN | LSTM | YOLOv5 | BERT | (MFDF) |
| 20 dB noise | 85.2 | 90.1 | 91.3 | 93.5 | 92.1 | 96.8 |
| 10 dB noise | 72.4 | 82.7 | 84.5 | 87.9 | 85.3 | 92.1 |
| 5 dB noise | 58.9 | 70.2 | 73.1 | 78.5 | 75.6 | 85.4 |
| 15% missing data | 65.3 | 78.9 | 81.2 | 85.7 | 82.4 | 90.3 |
| 30% data missing | 51.7 | 65.4 | 68.9 | 74.2 | 70.1 | 82.6 |
Table 2 indicates that model performance decreases as noise intensity increases and data completeness deteriorates. However, MFDF consistently achieves the highest performance retention under all disturbance conditions. Under the severe 5 dB noise scenario, MFDF maintains 85.4% performance retention, exceeding YOLOv5 by 6.9 percentage points and LSTM by 12.3 percentage points. This demonstrates that the adaptive fusion mechanism and spatiotemporal feature modeling effectively reduce the influence of noisy and incomplete observations, thereby improving model robustness.
(3) Practicability test
In this test, on a hardware platform equipped with NVIDIA RTX 3080, the time consumption (frame rate), GPU memory footprint, and energy consumption of a single inference of the model are tested, and the comprehensive practicality score is calculated to evaluate its engineering deployment potential. The practicality score was determined based on three metrics: inference speed (frames per second), GPU memory footprint (MB), and energy consumption per inference (Joules). Models with higher processing efficiency and lower computational resource requirements achieved higher practicality scores. The results are shown in Table 3.
Table 3 Practicability test results
| Inference | Memory | Energy | Practicality | |
| Models | Speed (fps) | Footprint (MB) | Consumption (J) | Score |
| SVM | 120 | 50 | 0.5 | 0.72 |
| CNN | 95 | 280 | 2.1 | 0.68 |
| LSTM | 88 | 320 | 2.8 | 0.65 |
| YOLOv5 | 105 | 450 | 3.5 | 0.71 |
| BERT | 75 | 520 | 4.2 | 0.62 |
| This article (MFDF) | 98 | 380 | 2.9 | 0.83 |
Although MFDF does not achieve the highest inference speed among all methods, it obtains the highest practicality score of 0.83. Compared with BERT, the proposed framework significantly reduces memory consumption and energy usage while maintaining superior detection performance. These results indicate that MFDF achieves a favorable balance between computational efficiency and diagnostic accuracy, making it suitable for deployment in practical digital power grid inspection scenarios.
(4) Ablation test
In this test, the key components (attention fusion module, spatiotemporal graph convolution module, dynamic normalization layer) in the MFDF model are gradually removed, and the simplified model is trained and tested under the same conditions to quantify the contribution of each module to the final performance. The results are shown in Table 4.
Table 4 Ablation test results (% F1 fraction)
| Sensor | Image | Text | Multi-source | |
| Model Variants | Data | Data | Data | Fusion |
| Complete model | 94.2 | 93.8 | 92.7 | 94.8 |
| Remove attentionless fusion | 90.1 | 89.7 | 88.5 | 91.3 |
| Remove spatiotemporal graph convolution | 88.7 | 87.9 | 86.4 | 89.5 |
| Remove dynamic normalization | 85.3 | 84.1 | 83.2 | 86.7 |
| Single mode only optimal | 91.5 | 90.8 | 89.3 | – |
The ablation results verify the contribution of each proposed component to the overall framework. Removing the attention fusion module decreases the multi-source fusion F1-score from 94.8% to 91.3%, while removing the spatiotemporal graph convolution module reduces the multi-source fusion F1-score from 94.8% to 89.5%, corresponding to a performance loss of 5.3 percentage points. This result quantitatively demonstrates the contribution of spatiotemporal correlation analysis to fault detection performance. The largest performance degradation occurs when dynamic normalization is removed, resulting in an F1-score of 86.7%. These observations confirm that each module contributes significantly to the final detection capability of the MFDF framework.
(5) Interpretability test
This test combines quantitative and qualitative evaluation, and invites 10 domain experts to score the model attention diagram and fault location results. By calculating the consistency score (0–1) between the model attention weight and the expert labeled area, and the geometric accuracy of fault location, the comprehensibility and credibility of the model decision-making are comprehensively measured, and the results are shown in Table 5.
Table 5 Interpretability test results
| Attentional | Positioning | Expert | |
| Models | Consistency | Accuracy (%) | Rating (1–5) |
| SVM | 0.62 | 75.3 | 3.2 |
| CNN | 0.71 | 82.7 | 3.8 |
| LSTM | 0.68 | 81.9 | 3.6 |
| YOLOv5 | 0.75 | 87.5 | 4.1 |
| BERT | 0.73 | 85.8 | 3.9 |
| This article (MFDF) | 0.89 | 92.4 | 4.6 |
MFDF achieves the highest attention consistency score, positioning accuracy, and expert evaluation score among all compared models. The attention consistency value of 0.89 indicates strong agreement between model decision regions and expert judgment. Furthermore, the fault localization accuracy of 92.4% demonstrates that the proposed framework not only provides accurate predictions but also offers improved interpretability and decision transparency for practical power grid inspection applications.
(6) Generalization ability test
In this test, the domain adaptation evaluation framework is adopted, and the model trained on the source dataset is directly applied to three unseen target datasets with different distributions (IEC TC57, IEEE PES, CEAI) to test its cross-regional and cross-grid generalization performance. The evaluation was performed without further fine-tuning on the target datasets, enabling the assessment of model performance under different data distributions and operating environments. The generalization ability was measured using the average Domain Adaptation Accuracy (DA-Acc) obtained across the three target datasets. The results are shown in Table 6.
Table 6 Generalization ability test results (%)
| IEC TC57 | IEEE PES | CEAI | Mean | MMD | |
| Models | Dataset | Dataset | Dataset | DA-Acc | Score |
| SVM | 76.3 | 74.8 | 72.1 | 74.4 | 0.152 |
| CNN | 82.7 | 80.9 | 78.5 | 80.7 | 0.118 |
| LSTM | 84.1 | 82.3 | 79.7 | 82 | 0.105 |
| YOLOv5 | 87.5 | 85.2 | 83.6 | 85.4 | 0.089 |
| BERT | 85.8 | 83.9 | 81.4 | 83.7 | 0.096 |
| This article (MFDF) | 91.2 | 89.7 | 87.9 | 89.6 | 0.062 |
As shown in Table 6, MFDF consistently achieves the highest performance across all unseen target datasets while obtaining the lowest Maximum Mean Discrepancy (MMD) score. The average domain adaptation accuracy reaches 89.6%, which is 4.2 percentage points higher than YOLOv5. These results demonstrate that the proposed framework learns domain-invariant representations and maintains stable performance under different data distributions and operating environments.
(7) Scalability test
In this test, simulated power grid topology data of different node sizes (100, 500, 1000 nodes) are constructed to test the performance and resource consumption changes of the model when handling increasing data volumes. The simulated power grid topology follows a hierarchical distributed architecture comprising substations, transmission nodes, and monitoring terminals, reflecting a large-scale smart grid deployment scenario. The network size was gradually increased from 100 to 1,000 nodes to evaluate the scalability of the proposed model under increasing data volume and computational demand. The test focuses on the F1-score retention rate and training efficiency to evaluate the feasibility of its application to large-scale actual power grids. The results are shown in Table 7.
Table 7 Scalability test results
| Memory | F1 | F1 | |||
| Training | Footprint | Score | Retention | ||
| Data Size | Models | Time (h) | (GB) | (%) | (%) |
| Small scale | SVM | 0.5 | 2.1 | 81.1 | – |
| (100 nodes) | CNN | 1.2 | 5.3 | 87.5 | – |
| LSTM | 2.1 | 6.8 | 88.2 | – | |
| YOLOv5 | 1.8 | 8.5 | 90.5 | – | |
| BERT | 3.5 | 10.2 | 89.1 | – | |
| This article (MFDF) | 1.5 | 7.1 | 94.8 | – | |
| Medium scale | SVM | 2.1 | 10.5 | 75.3 | 92.8 |
| (500 nodes) | CNN | 5.7 | 26.8 | 82.4 | 94.2 |
| LSTM | 9.3 | 34.1 | 83.7 | 94.9 | |
| YOLOv5 | 7.2 | 42.5 | 86.9 | 96 | |
| BERT | 15.8 | 51.3 | 84.2 | 94.5 | |
| This article (MFDF) | 6.3 | 35.7 | 91.5 | 96.5 | |
| Large scale | SVM | 8.9 | 41.2 | 68.7 | 84.7 |
| (1000 nodes) | CNN | 22.5 | 105.6 | 76.3 | 87.2 |
| LSTM | 37.4 | 136.2 | 78.9 | 89.5 | |
| YOLOv5 | 28.7 | 170.3 | 82.1 | 90.7 | |
| BERT | 63.1 | 204.8 | 79.5 | 89.2 | |
| This article (MFDF) | 25.3 | 142.7 | 88.7 | 93.6 |
The scalability evaluation demonstrates that all models experience increased computational cost as the network size grows. Nevertheless, MFDF maintains an F1 retention rate of 93.6% when the system scale increases to 1,000 nodes, outperforming all baseline models. This result confirms that the lightweight edge-cloud collaborative architecture effectively supports large-scale deployment while preserving diagnostic performance and computational efficiency.
(8) Simulink-Based Validation Test
A MATLAB/Simulink-based distribution network model was constructed to validate the proposed MFDF framework in a practical power-system environment. The simulation incorporated normal operating conditions, voltage sag faults, over-current faults, load variations, and sensor noise disturbances to assess the framework’s fault detection and monitoring capabilities. Voltage and current measurements generated by the Simulink environment were processed by the proposed framework, and the corresponding fault detection performance is presented in Table 8.
Table 8 Simulink-based fault validation results
| Detection | Precision | Recall | ||||
| Scenario | Voltage Profile | Current Profile | MFDF Output | Delay (ms) | (%) | (%) |
| Normal operation | 1.00 p.u. steady | 0.72 p.u. steady | Normal | 0 | 99.1 | 98.8 |
| Voltage sag fault | 1.00 to 0.72 p.u. | 0.74 to 0.91 p.u. | Voltage fault | 18 | 97.6 | 97.1 |
| Over-current fault | 0.98 to 0.93 p.u. | 0.75 to 1.38 p.u. | Current fault | 16 | 98 | 97.4 |
| Load variation | 1.00 to 0.94 p.u. | 0.71 to 1.05 p.u. | Load variation | 23 | 96.8 | 96.2 |
| Sensor noise (20 dB) | Noisy 0.981.02 p.u. | Noisy 0.69-0.76 p.u. | Normal/noise rejected | 21 | 96.1 | 95.6 |
The results demonstrate that the proposed MFDF framework accurately detects various operating conditions and fault events while maintaining high precision and recall. Furthermore, the framework effectively suppresses measurement noise and provides rapid fault identification with detection delays below 25 ms, supporting its applicability in practical digital power-grid inspection environments.
(9) Statistical Validation of Key Performance Metrics
Statistical validation was performed using five independent experimental runs with different random initialization seeds. The mean value and standard deviation were computed for the principal evaluation metrics to assess the consistency of the proposed MFDF framework. The statistical results are presented in Table 9.
Table 9 Statistical validation of key performance metrics
| Metric | Mean (%) | Standard Deviation |
| F1-score | 94.8 | 0.6 |
| Robustness Retention | 85.4 | 0.8 |
| Scalability Retention | 93.6 | 0.5 |
The results indicate limited variation across the five independent experimental runs. The low standard deviations obtained for the F1-score, robustness retention, and scalability retention demonstrate that the proposed MFDF framework produces stable and consistent performance under different random initialization conditions, supporting its reliability and repeatability.
5 Conclusion
This paper systematically investigates intelligent inspection technology based on MFDF in digital power-grid environments, and demonstrates the effectiveness of the proposed MFDF model in improving the accuracy and efficiency of power grid equipment condition monitoring. Its core contribution is the development of a hierarchical fusion architecture that integrates temporal, image, and textual data to achieve adaptive alignment and collaborative analysis of multi-modal information. The test results show that the model has an F1 score of 94.8% in fault detection, which is 4.3% higher than the optimal baseline model. Meanwhile, it maintains a performance level of 85.4% under 5 dB noise conditions. The inference speed reaches 98 fps, with a practicality score of 0.83, a cross-dataset generalization ability of 89.6%, and a scalability retention rate of 93.6%, confirming its comprehensive advantages in accuracy, robustness, and engineering deployment. The integration of multiple heterogeneous data sources introduces additional computational complexity and resource requirements, particularly in large-scale deployment scenarios. Real-time deployment performance may be affected by communication latency, data synchronization overhead, and the resource constraints of edge computing devices. In addition, environmental factors such as adverse weather conditions, sensor malfunctions, incomplete observations, and image quality degradation can influence the consistency and reliability of multi-source data fusion. Performance degradation may occur under conditions involving severe sensor noise, substantial missing data, and fault patterns that differ significantly from the training data distribution. These conditions reduce the availability and reliability of multi-modal information, thereby affecting the effectiveness of the fusion and fault detection processes. However, the model performance still relies on high-quality labeled data, and its ability to generalize extremely rare faults and rapid adaptability to new equipment types is still insufficient. Future research will focus on few-shot learning and online incremental learning mechanisms and online incremental learning mechanisms to reduce data dependence, enhance adaptive capabilities, and promote the development of intelligent inspections in a more independent and reliable direction.
Declarations
Data Availability
Not applicable
Conflicts of Interest
The authors declare that they have no known competing financial interests or personal relationships that could have influenced the work reported in this paper.
Funding Statement
This research did not receive any specific grant from funding agencies in the public, commercial, or not-for-profit sectors.
Author Contribution
Shijun Weng: Conceptualization, Methodology, Supervision, Writing – original draft preparation. Wenzhen Wang: Software, Formal analysis, Data curation. Zhuangwei Chen: Investigation, Validation, Experimental implementation. Jie Chen: Visualization, Writing – review & editing, Verification. Wei Zhao: Resources, Project administration, Final approval of the manuscript.
All authors have read and agreed to the published version of the manuscript.
Ethical Approval
This article does not contain any studies involving human participants or animals performed by any of the authors.
Consent to Participate
Not applicable.
Consent to Publication
All authors have provided consent for publication of this manuscript.
Competing Interests
The authors declare no competing interests.
References
[1] Z. Wu, T. Liu, G. Li, and J. Zhao, “A Fault Diagnosis System for Power Grid Based on Multi-Source Information Fusion,” AIP Conference Proceedings, vol. 2238, p. 020012, 2020. doi:10.1063/5.0011035.
[2] X. Zeng, X. Xiong, and Z. Luo, “Grid Fault Diagnosis Based on Information Entropy and Multi-Source Information Fusion,” International Journal of Electronics and Telecommunications, vol. 67, pp. 143–148, 2021. doi:10.24425/ijet.2021.135956.
[3] Y. Wu, Q. Wang, N. Guo, Y. Tian, F. Li, and X. Su, “Efficient Multi-Source Self-Attention Data Fusion for FDIA Detection in Smart Grid,” Symmetry, vol. 15, p. 1019, 2023. doi:10.3390/sym15051019.
[4] Y. Wu, Y. Sheng, N. Guo, F. Li, Y. Tian, and X. Su, “Hybrid Deep Network Based Multi-Source Sensing Data Fusion for FDIA Detection in Smart Grid,” in Asia Power and Electrical Technology Conference, pp. 310–315, 2022. doi:10.1109/APET56294.2022.10072807.
[5] J. Liang, K. Zhang, A. Al-Durra, and D. Zhou, “A Multi-Information Fusion Algorithm for Fault Diagnosis of Power Converter in Wind Power Generation Systems,” IEEE Transactions on Industrial Informatics, vol. 20, pp. 1167–1179, 2023. doi:10.1109/TII.2023.3271358.
[6] W. Yang, J. Gu, X. Wang, and W. Wang, “Attention-Parallel Multisource Data Fusion Residual Network-Based Open-Circuit Fault Diagnosis of Cascaded H-Bridge Inverters,” Journal of Power Electronics, vol. 24, pp. 875–886, 2024. doi:10.1007/s43236-024-00777-6.
[7] M. Parai, S. Srimani, K. Ghosh, and H. Rahaman, “Multi-Source Data Fusion Technique for Parametric Fault Diagnosis in Analog Circuits,” Integration, vol. 84, pp. 92–101, 2022. doi:10.1016/j.vlsi.2022.01.005.
[8] Y. Xu, Z. Li, G. Huang, Y. Qian, G. Sheng, and X. Jiang, “Application of Multi-Source Information Fusion Based on D-S Evidence Theory in Insulation Defect Identification of DC XLPE Cable,” High Voltage, vol. 6, pp. 599–607, 2021. doi:10.1049/hve2.12129.
[9] H. Ye, X. Teng, B. Song, K. Zou, M. Zhu, and G. He, “Multi-Source Data Fusion-Based Grid-Level Load Forecasting,” Applied Sciences, vol. 15, p. 4820, 2025. doi:10.3390/app15094820.
[10] Q. Wang, Y. Wang, K. Zhang, Y. Liu, W. Qiang, and W. Q. Han, “Artificial Intelligent Power Forecasting for Wind Farm Based on Multi-Source Data Fusion,” Processes, vol. 11, p. 1429, 2023. doi:10.3390/pr11051429.
[11] J. Zhang, J. Zhao, J. Yang, and J. Zhao, “Deep Multi-Fidelity Bayesian Data Fusion for Probabilistic Distribution System Voltage Estimation,” IEEE Transactions on Power Systems, vol. 39, pp. 3661–3672, 2023. doi:10.1109/TPWRS.2023.3295795.
[12] Y. Yuan, K. Dehghanpour, Z. Wang, and F. Bu, “Multisource Data Fusion Outage Location in Distribution Systems via Probabilistic Graphical Models,” IEEE Transactions on Smart Grid, vol. 13, pp. 1357–1371, 2021. doi:10.1109/TSG.2021.3128752.
[13] X. He, H. Dong, W. Yang, and W. Li, “Multi-Source Information Fusion Technology and Its Application in Smart Distribution Power System,” Sustainability, vol. 15, p. 6170, 2023. doi:10.3390/su15076170.
[14] B. Wu and Y. Hu, “Analysis of Substation Joint Safety Control System Based on Multi-Source Heterogeneous Data Fusion,” IEEE Access, vol. 11, pp. 35281–35297, 2023. doi:10.1109/ACCESS.2023.3264707.
[15] C. Su, X. Wu, Y. Guo, C. S. Lai, L. Xu, and X. Zhao, “Automatic Multi-Source Data Fusion Technique of Powerline Corridor Using UAV LiDAR,” in IEEE International Smart Cities Conference, pp. 1–5, 2022. doi:10.1109/ISC255366.2022.9922293.
[16] M. Ganjkhani, A. Gholami, J. Giraldo, A. K. Srivastava, and M. Parvania, “Multi-Source Data Aggregation and Real-Time Anomaly Classification in Power Distribution Systems,” IEEE Transactions on Smart Grid, vol. 15, pp. 2191–2202, 2023. doi:10.1109/TSG.2023.3316548.
[17] X. Han, J. Jiang, C. Zhang, Z. Wen, G. Chen, and Y. Liu, “Quality Problems Management of Electric Power Equipment Based on Knowledge–Data Fusion Method,” IET Generation, Transmission & Distribution, vol. 14, pp. 745–751, 2020. doi:10.1049/iet-gtd.2019.0832.
[18] Y. Sun, Y. Liu, F. Tian, C. Cui, and C. Li, “Heterogeneous Multi-Parameter Feature-Level Fusion for Multi-Source Power Sensing Terminals,” in Neural Networks, Information and Communication Engineering, pp. 273–276, 2021. doi:10.1117/12.2615162.
[19] W. Dai, M. Wang, J. Guo, Z. Li, D. Qiao, and Z. Shang, “Transmission Line Condition Assessment Technology Based on Multi-Source Parameter Fusion,” Journal of Physics: Conference Series, vol. 2108, p. 012018, 2021. doi:10.1088/1742-6596/2108/1/012018.
[20] N. Wang and F. Zhao, “Condition Assessment of Distribution Network Equipment Based on Large Data Fuzzy Decision-Making,” Energies, vol. 13, p. 197, 2020. doi:10.3390/en13010197.
[21] Z. Cao, J. Sun, X. Du, and J. Zhang, “Research on Power Grid Intelligent Warning System Based on Multi-Source Data Fusion,” in Sensors and Information Technology Conference, pp. 136–141, 2024. doi:10.1117/12.3029432.
[22] Y. Tan, K. Liang, and Z. Zhang, “Research on Intelligent Fault Diagnosis of Wind Power Generation System Based on Data Fusion,” Distributed Generation & Alternative Energy Journal, pp. 1847–1872, 2022. doi:10.13052/dgaej2156-3306.3766.
[23] Z. Sun, R. Yu, G. Zhu, and Q. Xue, “Resilience Improvement for Distributed Renewable Energy Grids: Integration of UAV-Assisted Live-Line Inspection and Real-Time Systems,” Distributed Generation & Alternative Energy Journal, pp. 271–300, 2026. doi:10.13052/dgaej2156-3306.4122.
[24] X. Wang, Y. Lei, Z. Zhilin, W. Yesheng, and H. Zhihai, “Digital Twin–Enabled Monitoring and Modeling of Substation Secondary Systems in Distributed Generation Networks,” Distributed Generation & Alternative Energy Journal, pp. 793–822, 2025. doi:10.13052/dgssssaej2156-3306.4048.
[25] Y. Liu, H. Bai, and W. Li, “A Distribution Network Operational Situation Perception Technology Based on Graph Convolutional Neural Network-Enhanced Digital Twin Model,” Distributed Generation & Alternative Energy Journal, vol. 41, no. 2, pp. 301–326, 2026. doi:10.13052/dgaej2156-3306.4123.
Biographies

Shijun Weng, Senior Engineer, holds a Master’s degree in Electrical Automation from North China Electric Power University. His main research interests cover the construction of smart grids and relevant fields.

Wenzhen Wang, Senior Engineer, received his full-time undergraduate degree and Bachelor’s degree in Power System and Its Automation from Changsha Electric Power College. He is mainly engaged in and researches power engineering construction management and the development of new power systems.

Zhuangwei Chen, Engineer, holds a Bachelor’s degree in Mechatronic Engineering from Harbin University of Science and Technology. His main research field covers digital power grid engineering construction.

Jie Chen, Engineer, obtained his Bachelor’s degree in Thermal Energy and Power Engineering from Changsha University of Science and Technology. His primary research focus lies in digital power grid engineering construction.

Wei Zhao, Assistant Engineer, holds a Bachelor’s degree in Electronic Science and Technology from Shanghai University of Electric Power. His main research field covers electronic information engineering.
Distributed Generation & Alternative Energy Journal, Vol. 41_5, 1355–1390
doi: 10.13052/dgaej2156-3306.4156
© 2026 River Publishers