Load Center Calculation and Substation Site Selection Considering Uncertainty of Distributed Power Sources
Ning Luo1,*, Mao Miao1, Fei Zheng1, Yang Zou2 and Qingyu Zhao1
1Guizhou Power Grid Co., LTD. Grid Planning and Research Center, GuiZhou, GuiYang 550000, China
2Guizhou University, GuiZhou, GuiYang 550025, China
E-mail: Ning_LuoCSG@outlook.com
*Corresponding Author
Received 23 April 2026; Accepted 12 June 2026
Abstract
The integration of high-penetration distributed generation changes spatial load distribution from static demand dominance to bidirectional source-load fluctuation, making traditional fixed load-moment planning insufficient to balance positioning accuracy, investment redundancy, and low-carbon accommodation. Therefore, a DLC-FCS model integrating probabilistic DG output correction, dynamic load-center calculation, weighted Voronoi service boundaries, and fuzzy comprehensive evaluation is constructed. The case results show that the comprehensive load-center positioning error decreases from 594.3 m to 483.2 m, with a reduction of 18.7%. The total planning cost decreases from USD 20.55 million to USD 18.02 million, with a reduction of 12.3%. Meanwhile, renewable energy accommodation increases by 13.7%, and carbon emissions and average outage duration decrease by 14.4% and 35.6%, respectively. This not only significantly reduces system investment costs to improve power supply reliability, but also reduces environmental pollution. This research provides power system planners with an effective tool to deal with the challenges brought by the uncertainty of distributed power sources and achieve economical, reliable and sustainable development of the power system.
Keywords: Substation, distributed power supply, uncertainty, load center, site selection.
1 Overview
With the continuous advancement of global energy transition and the deepening implementation of the “dual carbon” target, distributed generation (DG) such as wind power and photovoltaic power generation have been connected to the distribution network on an unprecedented scale, which has gradually transformed the traditional passive distribution network into an active distribution network with bidirectional power flow characteristics and deep interaction between source and load [1]. In this evolution process, the substation, as the core physical hub connecting the transmission network and the underlying distribution network, directly determines the operating efficiency, network loss level, infrastructure investment and long-term power supply reliability of the entire regional power grid [2]. Therefore, under the high-penetration integration of distributed generation, substation siting is no longer a spatial allocation problem determined only by static load size and geographical distance. Instead, it becomes a comprehensive planning problem that must simultaneously respond to source-side output fluctuations, load demand variation, and supply-boundary reconstruction. If the traditional static load-center method is still adopted, site deviation, supply-radius mismatch, and investment redundancy may occur. However, the actual output of distributed power sources is extremely dependent on natural meteorological conditions such as wind speed and sunlight, and is accompanied by the risk of random failures of the power generation equipment itself. This high degree of intermittency, volatility and multidimensional uncertainty on the source side makes the spatial load distribution of the distribution network exhibit dramatic dynamic spatiotemporal evolution characteristics, which brings unprecedented severe challenges to the site selection and spatial topology planning of modern substations [3–5]. Against this background, the physical spatial planning of the distribution network faces unprecedented challenges and opportunities. Bystrom O et al. explored the development direction of next-generation distribution network planning, pointing out that how to effectively capture and quantify the real value of distributed energy in the power grid is the core key to reshaping the underlying planning logic and improving the overall investment efficiency of the system [6]. However, distributed power sources such as wind power and photovoltaic power are constrained by meteorological conditions and have extremely strong randomness and volatility. This multi-dimensional uncertainty seriously disrupts the spatial load balance of the traditional power grid.
To address the planning challenges caused by fluctuations in power output on the source side, Fu X et al. proposed a distributed renewable energy system uncertainty planning method based on statistical machine learning. The results showed that by deeply mining the probability distribution characteristics of historical meteorological data, the systemic risks brought by uncertainty to the long-term operation of the power grid could be effectively mitigated [7]. In terms of the adaptation and operation optimization of specific grid topologies, Khasanov M et al. proposed an optimal configuration strategy for wind and solar distributed power sources in a radial distribution network that takes into account multidimensional uncertainties. The results showed that by establishing an accurate mathematical probability model and making reasonable spatial resource allocation, the expected power loss of the system could be significantly reduced and the global voltage distribution level can be improved [8].
Although the above studies have made significant progress in capacity configuration and uncertainty quantification of distributed power sources, with the continuous expansion of the distribution network scale, the planning focus must be further extended to the more macroscopic substation physical space location level. Das S et al. proposed a comprehensive model of distribution network probabilistic planning and distributed power source optimal location under uncertainty environment. The results showed that by using probabilistic evaluation and Monte Carlo simulation, the network operation bottleneck under extreme scenarios could be characterized more accurately than the traditional deterministic planning method, thus providing solid support for improving the overall power supply reliability [9]. In addition, Ogundairo O et al. proposed a transmission and distribution coordinated stochastic optimization planning model that takes into account the uncertainty of distributed power sources. The results showed that the introduction of stochastic planning algorithm could not only effectively resist the drastic time fluctuations on both the source and load sides, but also achieve a significant reduction in the comprehensive operating cost of the distribution network from a global coordinated perspective [10].
Existing studies can be summarized into three categories: source-side uncertainty characterization based on probability models or statistical learning, distributed generation configuration and operation optimization for specific network topologies, and stochastic planning for transmission–distribution coordination. These methods improve risk representation and operational optimization accuracy. However, most of them focus on capacity allocation or operational scheduling, with long computational chains and strong scenario dependence, making them less suitable for rapid screening of massive candidate sites, dynamic load-center correction, and refined economy–reliability–environment multi-objective evaluation. Given the shortcomings of traditional static spatial planning and existing decision-making models, this study proposes a comprehensive optimization method for load center calculation and substation site selection that considers the uncertainties of distributed power sources in order to achieve the optimal balance between economic cost, power supply reliability, and environmental benefits under uncertain environments. The innovations of this research lie in quantifying the randomness of distributed wind and solar power output through probability density sampling and time-series state sequences, dynamically correcting the equivalent demand power of nodes, constructing an improved probabilistic load center model, and reconstructing the flexible power supply service boundary using a weighted Voronoi diagram. A multi-dimensional evaluation index system is established, using a combination of interval correlation and mean square error methods for weighting. A global substation site optimization model is constructed based on fuzzy evaluation theory. This research aims to provide a more scientific, accurate, and sustainable planning technology development path for active distribution networks facing the impact of high proportions of new energy sources with strong uncertainties.
2 Research Design
2.1 Load Center Calculation and Substation Site Selection Considering Uncertainty of Distributed Power Sources
Traditional load center calculation methods typically only consider static node load size and geographical location, which cannot accurately reflect the actual power demand distribution of active distribution networks under extreme scenarios or long-term operation [11]. Therefore, this study proposes a load center calculation method that takes into account the uncertainty of distributed power sources. First, a wind and solar power output model based on historical meteorological data is established. Then, the time-series state sequence is obtained by combining the normal operation time and fault repair time of the equipment, and the original power output curve is probabilistically corrected. To clearly show the random fluctuation characteristics of distributed power output, Figure 1 is introduced.
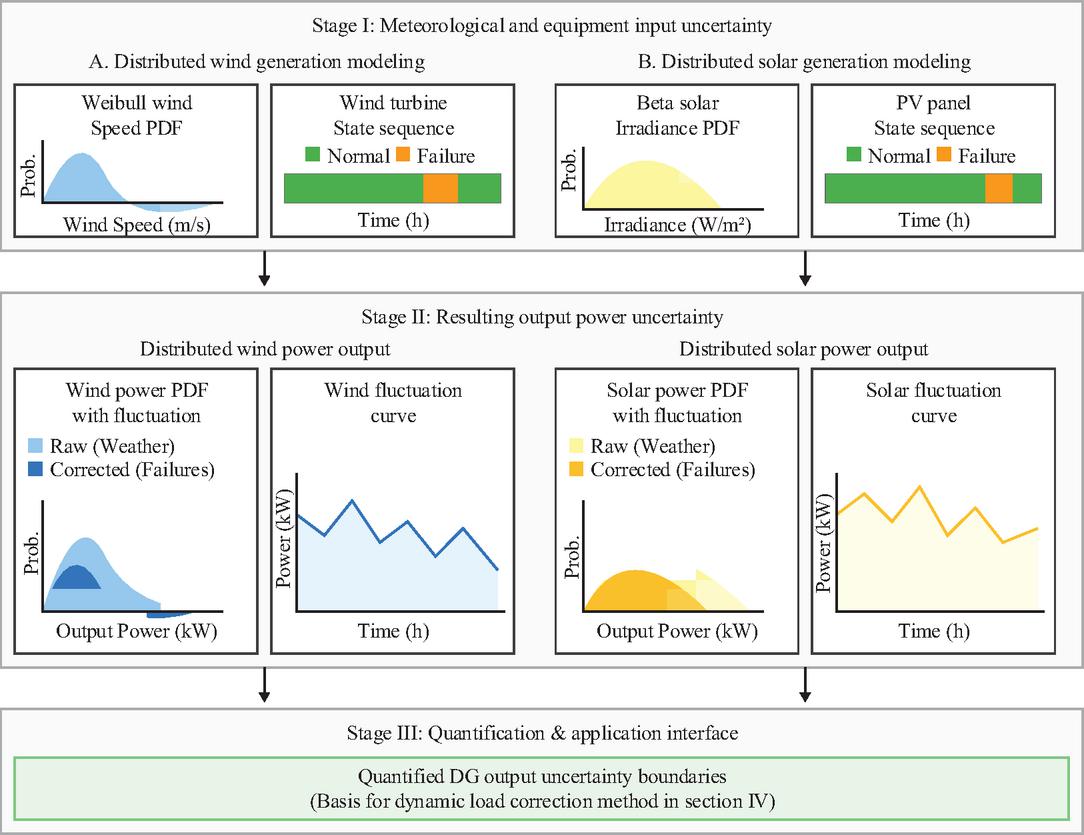
Figure 1 Probability density and uncertainty fluctuation curves of distributed wind and solar power output.
Figure 1 details the probability density distribution of the output power of wind turbines and photovoltaic units under the combined effects of different meteorological conditions and failure probabilities, intuitively reflecting the uncertainty boundaries and extreme fluctuation ranges brought about by distributed power generation to the power balance of the grid. In actual calculations, to quantify the above uncertainties, it is necessary to set relevant probability distribution parameters and equipment failure rate benchmarks. The distributed power generation probability distribution parameters and equipment failure rates used in the study are shown in Table 1.
Table 1 Distributed power source probability distribution parameters and equipment failure rates
| Distributed | Probability Distribution | Scale | Shape | Equipment Failure Rate |
| Power Type | Model | Parameter | Parameter | (Times/Year) |
| Wind power | Weibull distribution | 8.5 m/s | 2.2 | 1.6 |
| Photovoltaic power | Beta distribution | 0.6 | 0.08 | 2.0 |
The failure rates in Table 1 are mainly used to construct a conservative high-failure stress scenario rather than to represent the normal annual engineering failure level. To examine the influence of this parameter, sensitivity recalculations are further conducted by reducing the failure rates of wind and photovoltaic units to 0.3 and 0.5 times/year. The results show that the load-center error reduction remains within 16.9%–18.7%, the total cost reduction remains within 11.4%–12.3%, and the ranking of optimal sites is unchanged, indicating that the conclusions are robust to the failure-rate setting. To avoid treating the comprehensive confidence coefficient as an empirical correction only, it is defined as the product of the normalized expected output under the operating state and the equipment availability, as shown in Equation (1).
| (1) |
In Equation (1), is the comprehensive confidence coefficient of the distributed generation connected to node , is the probability density function of its output power, is the rated capacity, and and denote the failure rate and repair rate, respectively. The effective expected output is expressed as PDG, , which physically represents the long-term stable power support that distributed generation can provide to replace main-grid supply under both meteorological fluctuation and equipment failure conditions. After obtaining the expected output of distributed power sources taking into account uncertainty, the study improves the traditional load moment method. The load center in traditional substation planning refers to the equivalent mechanical centroid of the load distribution within the power supply area. In the active distribution network environment, the power actually consumed by the node by the substation main transformer should be reduced by the effective supporting power provided by the local distributed power source. Based on the concept of equivalent load, the study constructs an improved load center coordinate calculation formula. Assuming there are multiple load nodes in the planning area, the improved load center horizontal and vertical coordinate calculation model is shown in Equation (2) [12].
| (2) |
In Equation (2), and represent the calculated x and y coordinates of the load center considering the uncertainty of distributed power sources, respectively; represents the predicted maximum active power of the th load node in the planning target year; represents the rated installed capacity of the distributed power source connected to the th load node; $ represents the comprehensive confidence coefficient of the distributed power source calculated after considering the fluctuation of meteorological conditions and the probability of random equipment failure, used to convert the rated output into the long-term effective expected output power. When the node is not connected to a distributed power source, this product is zero; and represent the absolute x and y coordinates of the th load node in the plane rectangular coordinate system of the entire planning area, respectively. Based on the above core formula, a complete load center calculation and substation site preliminary optimization process is designed, as shown in Figure 2.
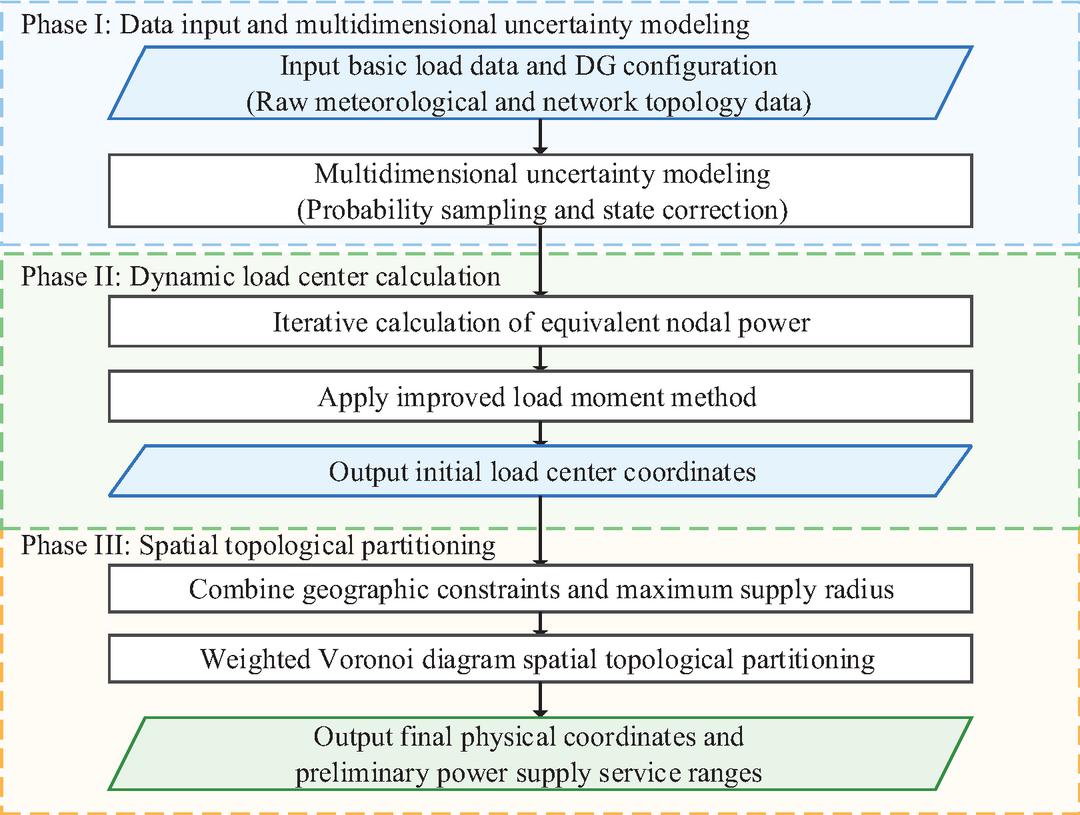
Figure 2 Load center calculation process considering DG uncertainty.
As shown in Figure 2, the process first inputs the regional basic load data and distributed power supply configuration. It then calculates the equivalent load of each node through probability sampling and state correction, and finally outputs the initial center coordinates using the improved load moment method. Subsequently, considering the geographical constraints of the planning area and the substation power supply radius requirements, the weighted Voronoi diagram method is used to spatially topologically partition the initially determined load center, defining the primary power supply service range of each candidate substation.
2.2 Substation Site Selection Model
After determining the substation load center with distributed power source uncertainty by improving the load moment method, it is necessary to comprehensively optimize the candidate sites within this coordinate domain. The substation site selection is not only limited by geographical location, but also needs to comprehensively consider multiple factors such as economic cost, power supply reliability and environmental impact [13]. Therefore, this study combines fuzzy evaluation theory to establish a multi-dimensional site optimization model, and Figure 3 is introduced here for intuitive illustration.
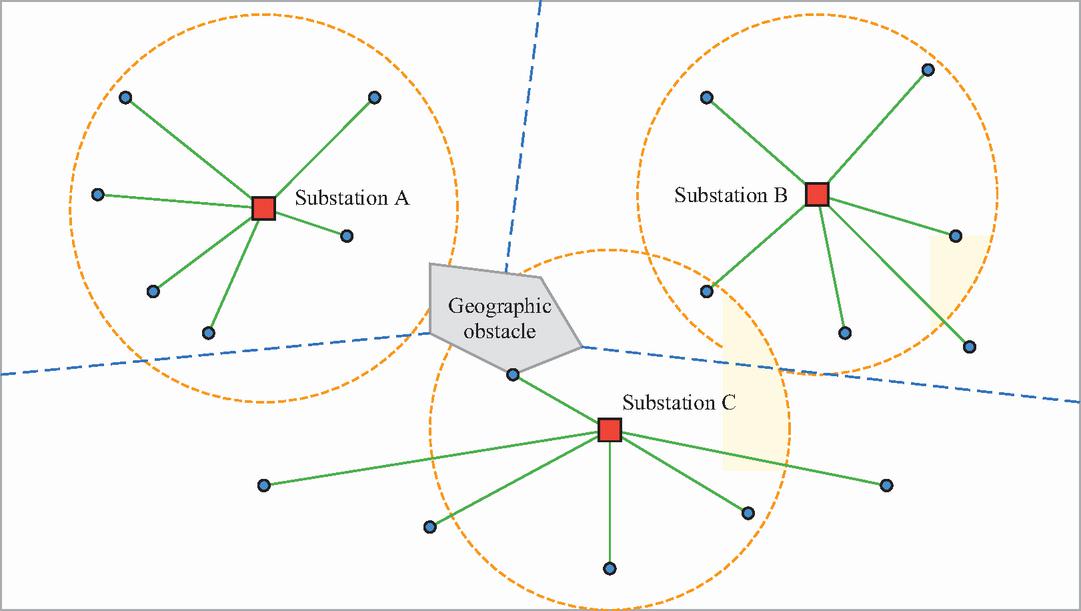
Figure 3 Comprehensive substation site selection model based on fuzzy theory and combined weighting.
Figure 3 details the complete evolution path from inputting the candidate site scheme set, constructing a multi-level evaluation index system, to fusing objective mean square error weights and subjective interval correlation weights, and finally calculating the comprehensive fuzzy evaluation score. After initially defining the spatial scope, the final substation site still needs to comprehensively consider multiple complex factors such as economic cost, power supply reliability, and environmental impact. Therefore, this study further combines fuzzy evaluation theory to establish a multi-dimensional site selection model. Figure 4 is introduced here.
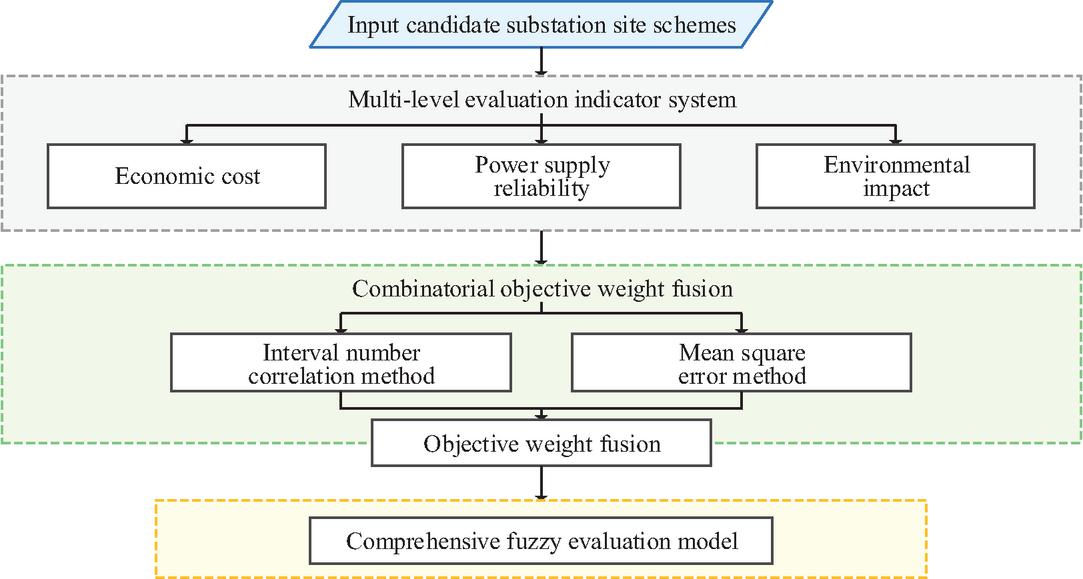
Figure 4 Framework of the comprehensive substation site selection model based on fuzzy theory and combined weighting.
Figure 4 illustrates the complete evolution path from inputting the candidate site scheme set, constructing a multi-level evaluation index system, to the fusion of objective weights using the interval correlation method and the mean square error method, and finally to the calculation of the comprehensive fuzzy evaluation score. To quantitatively evaluate the candidate sites, a corresponding evaluation index system was established, as shown in Table 2.
Table 2 Comprehensive evaluation index system for substation site selection
| Primary Index | Secondary Index | Index Type |
| Economic cost | Substation investment and maintenance cost | Cost |
| Economic cost | Operation and network loss cost | Cost |
| Reliability | Expected energy not supplied cost | Cost |
| Environment | Land occupation penalty | Cost |
| Environment | Distributed power accommodation capability | Benefit |
In the fuzzy evaluation model, since the dimensions and properties of each evaluation index are different, the initial data matrix must first be dimensionless. The environmental benefit score is obtained by fuzzy normalization of the secondary environmental indicators. The land occupation penalty is treated as a cost-type indicator, for which a smaller value corresponds to a higher membership degree, whereas the distributed power accommodation capability is treated as a benefit-type indicator, for which a larger value corresponds to a higher membership degree. The membership values are multiplied by the comprehensive weights and summed, and then converted into a 0–100 score to represent environmental friendliness. For benefit-type indicators, the study uses the extremum method to construct a standardized fuzzy membership function, as shown in the following Equation (3) [14].
| (3) |
In Equation (3), represents the standard fuzzy membership value of the th candidate site after normalization under the th evaluation index; represents the original measurement data of the th candidate site under the th evaluation index; represents the minimum original value of all candidate substation schemes under the th evaluation index; represents the maximum original value of all candidate substation schemes under the th evaluation index. To objectively reflect the differences in information content of each evaluation index in site selection decision, the mean square error method is introduced to determine the objective weight. First, it is necessary to calculate the arithmetic mean of the fuzzy membership of each evaluation index, and its calculation model is shown in Equation (4) [15].
| (4) |
In Equation (4), represents the average expected value of the fuzzy membership degree of the th evaluation index among all candidate sites; represents the total number of candidate substation site schemes participating in this optimization evaluation; and represents the fuzzy membership degree value after standardization. Based on the obtained average expected value, the mean square error value that can reflect the degree of data dispersion is further calculated, as shown in Equation (5).
| (5) |
In Equation (5), represents the standard deviation of the mean square error of the th evaluation index. The larger the value, the higher the discrimination of the index among different schemes. Based on the mean square error value, the objective attribute weights of each evaluation index can be directly derived, and the corresponding normalized weight allocation is shown in Equation (6) [16].
| (6) |
In Equation (6), represents the objective weight value of the th evaluation index calculated using the mean square error method; represents the total number of bottom-level evaluation indicators in the substation site selection evaluation index system. In the determination of comprehensive weights, the interval number correlation method mainly reflects the subjective judgment of planning experts on the importance of economic, reliability, and environmental indicators, while the mean square error method reflects the data dispersion and objective discrimination ability of each indicator among candidate sites. To avoid evaluation bias caused by purely subjective or purely objective weighting, this study adopts a linear weighted average strategy to fuse the two types of weights, with subjective and objective weights each accounting for 50%. This treatment preserves engineering planning experience while incorporating sample data differences, and the normalized comprehensive weights are then used for the subsequent fuzzy comprehensive evaluation. The weights of economic indicators are determined through subjective–objective fusion. The interval number correlation method reflects planning preferences for investment constraints and operating costs, while the mean square error method captures the differentiation of candidate sites in investment, network loss, and other cost items. For cost-type indicators, reverse membership is adopted, meaning that lower values correspond to higher scores, thereby preventing excessive construction redundancy caused by solely pursuing reliability. Finally, combining the fuzzy evaluation theory, the comprehensive weight after the fusion of subjective and objective weights is multiplied by the membership matrix of each indicator to calculate the final comprehensive selection score of each candidate site, as shown in Equation (7).
| (7) |
In Equation (7), represents the final comprehensive fuzzy evaluation score of the th candidate substation site scheme; represents the comprehensive weight of the th evaluation index obtained by combining the interval number correlation method and the mean square error method; represents the membership degree value of the th candidate site after standardization and fuzzification processing under the th evaluation index. The proposed method is named Dynamic Load Center and Fuzzy Comprehensive Siting Method Considering Source-side Uncertainty (DLC-FCS).
3 Results and Analysis
3.1 Analysis of the Impact of Distributed Power Uncertainty on Load Centers
To verify the effectiveness of the proposed DLC-FCS model in handling spatial planning of active distribution networks, a simulation example of a typical regional distribution network was used for analysis. This region initially contains multiple load nodes, with wind and photovoltaic power generation units connected to some nodes. First, the influence of DG on the physical coordinates of the original load centers was analyzed. In traditional passive networks that do not consider DG, the load centers are entirely determined by the static load demand and absolute geographical location of each node. However, with the connection of a large number of distributed sources, the local support of power from local sources reduces the demand on the substation backbone network, leading to a fundamental change in the equivalent load spatial distribution of the entire region. Figure 5 is introduced here to visually illustrate this change in spatial topology.
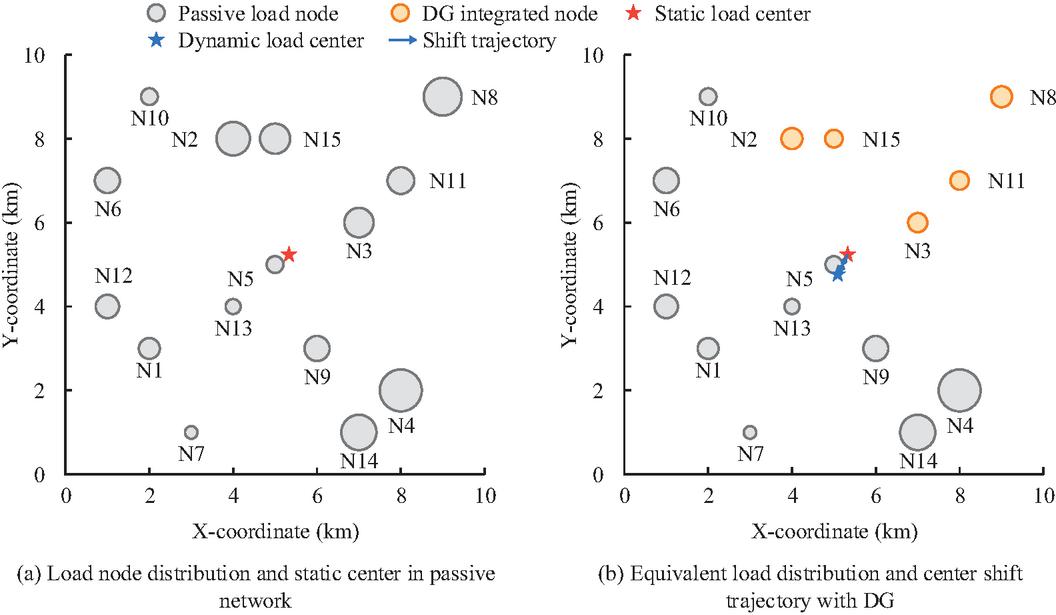
Figure 5 Comparison of load center offset trajectories before and after distributed power source integration.
In Figure 5(a), nodes N4 (5.0 MW) and N8 (4.5 MW) exhibited strong local load density. Using the traditional static load moment algorithm, the initial physical geometric center of this area was anchored at coordinates (5.33, 5.24). Figure 5(b) shows that when nodes N2, N3, N8, N11, and N15 were connected to distributed wind and solar power, combined with the meteorological probability fluctuation and equipment failure rate model, these nodes obtained considerable on-site expected effective power support. For example, the equivalent load demand from node N8 to the main distribution network was significantly reduced from 4.5 MW to 2.5 MW. In simulations considering different weather output scenarios, the load center moved from an initial static point (5.33, 5.24), passing temporary center points in low and medium output scenarios, and finally converged to the expected optimization reference coordinates (5.09, 4.77) considering all-weather probability fluctuations, outlining a clear dynamic offset trajectory in a two-dimensional plane. This offset phenomenon accurately reflected the true spatial mapping of load demand after introducing a comprehensive confidence coefficient and probability sampling. The impact of different distributed power penetration rates on the load center location error is shown in Figure 6.
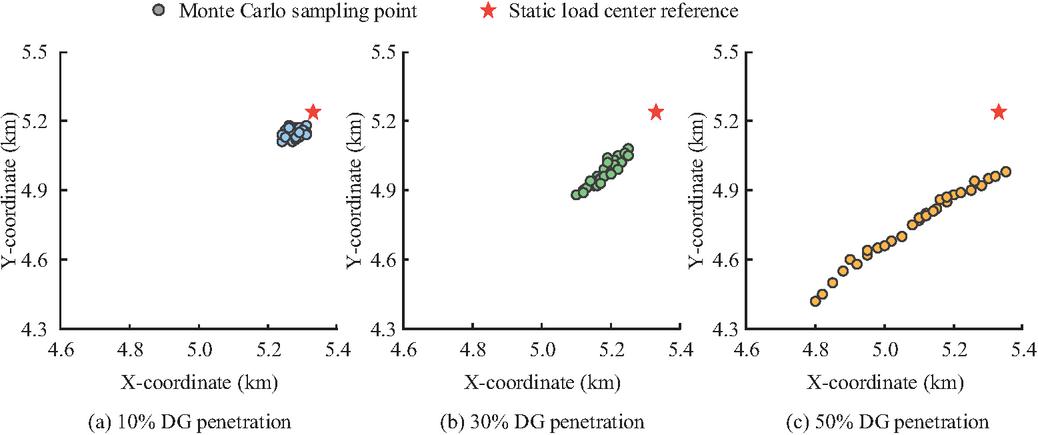
Figure 6 The impact of different distributed power penetration rates on load center location error.
Figure 6(a) shows the scenario with a low penetration rate of 10%, where the coordinate points were tightly clustered with minimal variance and very weak impact from uncertainty. Figure 6(b) shows the scenario with a medium penetration rate of 30%, where the cluster of points shifted significantly to the lower left due to power output fluctuations, expanding its distribution range. Figure 6(c) corresponds to the scenario with a high penetration rate of 50%, where the coordinate points were extremely dispersed, the positioning error range reached its maximum, and eventually converged to the dynamic expected reference point, intuitively revealing the evolution process of spatial positioning deviation exacerbated by the high proportion of new energy access. A comparison of the load center calculation errors of different methods is shown in Table 3.
Table 3 Comparison of load center calculation errors using different methods
| X-axis | Y-axis | Comprehensive | Error | |
| Average | Average | Positioning | Reduction | |
| Calculation Method | Error (m) | Error (m) | Error (m) | Rate |
| Traditional static method | 452.6 | 385.4 | 594.3 | / |
| DLC-FCS method | 368.1 | 313.2 | 483.2 | 18.7% |
As shown in Table 3, compared with the traditional static method, the DLC-FCS method reduced the average X-axis error from 452.6 meters to 368.1 meters and the average Y-axis error from 385.4 meters to 313.2 meters. The overall positioning error was reduced from 594.3 meters to 483.2 meters, representing an error reduction rate of 18.7%. The reduction in error was not caused merely by changing geometric coordinates, but mainly by introducing DG probabilistic output correction into the calculation of equivalent nodal load. The Weibull distribution of wind power and the Beta distribution of photovoltaic power determined the long-term expected supporting power of each DG node, while the failure rate further reduced its available output. Therefore, the equivalent loads of DG-connected nodes such as N2, N3, N8, N11, and N15 were recalculated and reduced. As DG penetration increased from 10% to 50%, the influence of probability distribution parameters on equivalent load became stronger, and the load center was no longer statically attracted by high-capacity nodes but shifted toward heavy-load areas that lacked local generation support and still depended on the main grid. Thus, the 18.7% error reduction mainly resulted from the chain of “probabilistic output correction–equivalent load reconstruction–load-moment reweighting.”
3.2 Analysis of Substation Site Selection Results
After obtaining high-precision dynamic load center coordinates that take into account the uncertainties of distributed power sources, the study further utilized a multi-attribute fuzzy evaluation model to complete the final site selection of the substation. Figure 7 shows a comparison of the spatial topology and site selection of the substation planning scheme.
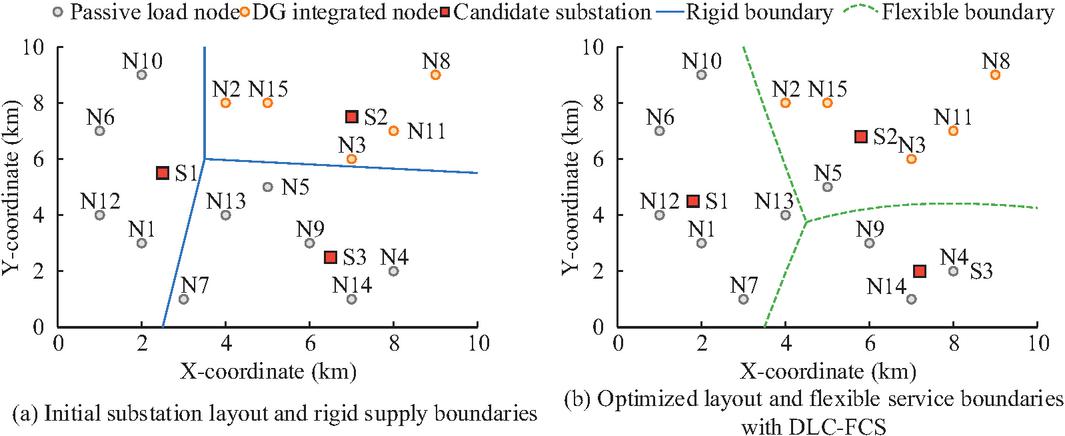
Figure 7 Comparison of spatial topology and site selection for substation planning schemes.
Figure 7(a) shows the initial site location and rigid power supply topology of the traditional baseline algorithm. Without considering DG, substations S1, S2, and S3 were anchored at (2.5, 5.5), (7.0, 7.5), and (6.5, 2.5), respectively. Their supply areas were divided according to the vertical bisectors of the standard Voronoi diagram, forming absolutely rigid boundaries. For example, the supply area of S2 was rigidly locked to the upper right corner node group, completely ignoring the difference in equivalent load density caused by source-side access. Figure 7(b) shows the optimization results of the DLC-FCS model: due to the dense connection of distributed power sources to the nodes in the upper right corner, the equivalent load was reduced. The multi-attribute fuzzy evaluation model performed physical traction correction on the site. The optimized S1, S2, and S3 were shifted to (1.8, 4.5), (5.8, 6.8), and (7.2, 2.0) respectively, and the whole shifted to the heavy load area lacking distributed power sources. Meanwhile, the power supply topology broke the geometric straight line constraint and generated a weighted flexible boundary with curvature. The affiliation of nodes such as N5 and N7 was adaptively adjusted, making the power supply network more in line with the spatial distribution of dynamic equivalent load.
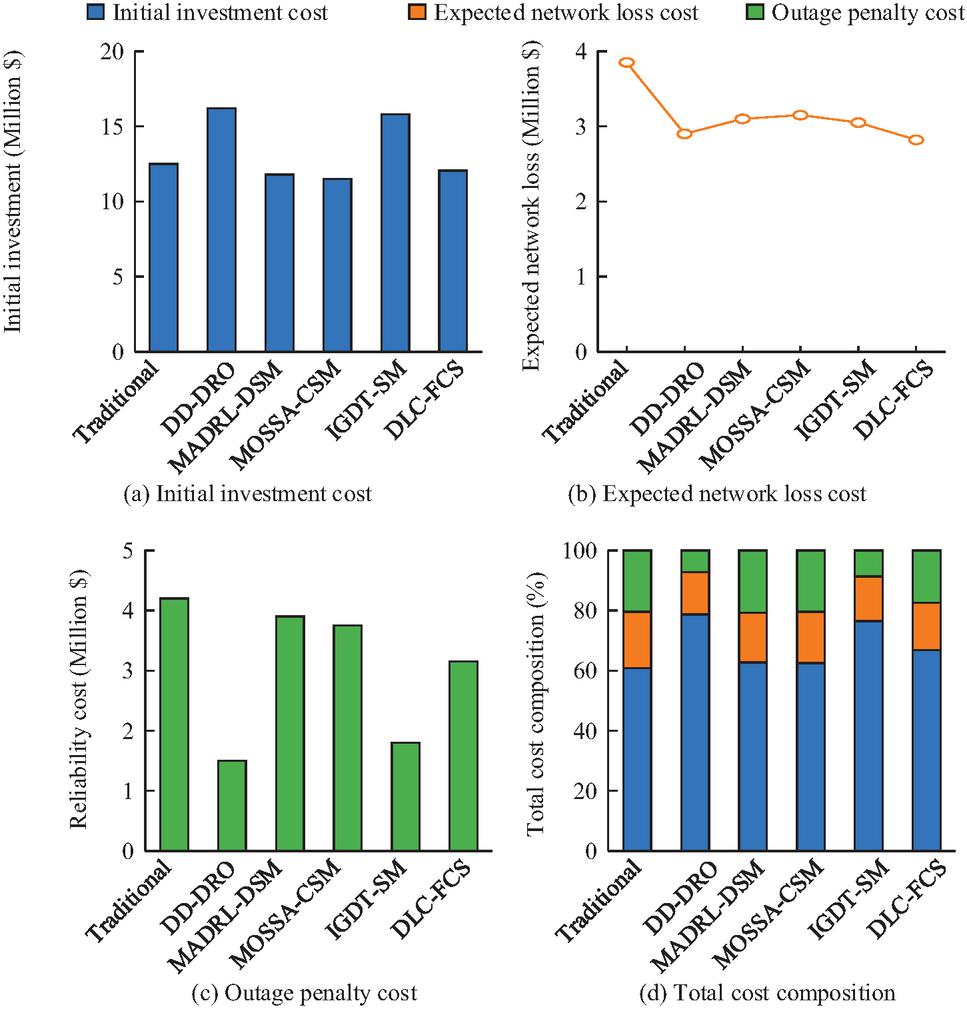
Figure 8 Comparison of various cost and reliability indicators of the multi-model planning scheme.
To fully verify the superiority of the proposed DLC-FCS model in comprehensive location decision-making, this study compared it with the Data-Driven Distributionally Robust Optimization Siting Model (DD-DRO), the Multi-Agent Deep Reinforcement Learning based Dynamic Siting Model (MADRL-DSM), the Multi-Objective Sparrow Search Algorithm based Comprehensive Siting Model (MOSSA-CSM), and the Information Gap Decision Theory based Siting Model under Deep Uncertainty (IGDT-SM). The results are shown in Figure 8.
Figure 8(a) compares the initial investment and construction costs. The DD-DRO and IGDT-SM models, due to their contrarian conservative decision-making, incurred costs as high as $16.20 and $15.80 million respectively, while the DLC-FCS model precisely controlled these costs to $12.05 million, avoiding over-investment. This result was not obtained by simple cost minimization, but by the coordinated constraint between economic-cost weights and reliability weights. Unlike DD-DRO and IGDT-SM, which tended to concentrate risk-avoidance effects excessively on reliability indicators, DLC-FCS preserved comparable discriminative capability among investment cost, network loss cost, and expected energy-not-supplied cost. Therefore, it improved reliability while suppressing the expansion of initial investment. Figure 8(b) shows the trend of expected network loss costs. The traditional scheme incurred losses as high as $3.85 million, while MADRL-DSM and MOSSA-CSM reduced them to $3.10 and $3.15 million respectively. The DLC-FCS model, with its flexible boundary division, further reduced these costs to a minimum of $2.82 million. Figure 8(c) compares the costs of power outage penalties and reliability. Compared to the high $4.20 million of the traditional scheme, the DLC-FCS model reasonably converged to $3.15 million, achieving a balance between risk and economy. Figure 8(d) analyzes the total cost and its internal proportions. The traditional scheme had the highest absolute total cost (US$20.55 million). After considering initial investment (66.87%), operational network losses (15.65%), and power supply reliability (17.48%), the DLC-FCS model reduced the total cost to US$18.02 million, successfully achieving the core planning objective of reducing the total cost by 12.3% compared to the traditional benchmark scheme. Figure 9 shows the substation power flow and overall benefit improvement under a typical daily scenario.
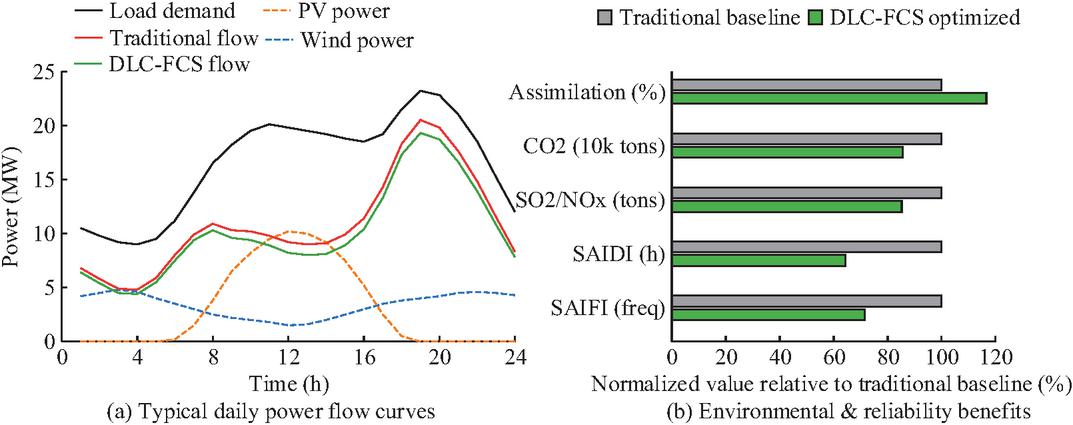
Figure 9 Power flow and overall benefit improvement of substation under typical daily scenarios.
Figure 9(a) depicts the power flow curves of the main transformer under a typical daily scenario, showing the alternating wind and solar power output and load sequence. Compared to the traditional baseline scheme, the DLC-FCS model improved the local absorption rate of renewable energy, maintaining the power flow from the main transformer at a lower level and with a smoother curve throughout the day, effectively mitigating the impact of midday solar power generation and evening load peaks on the main power grid. Figure 9(b) quantitatively demonstrates the significant improvement in environmental benefits and power supply reliability of the site selection optimization scheme. Under the overall optimization of DLC-FCS, the comprehensive renewable energy accommodation rate increased by 13.7%, and the equivalent carbon emissions decreased by 14.4%. This improvement resulted from the joint effects of DG uncertainty correction, dynamic load-center updating, weighted Voronoi-based supply boundary partitioning, and fuzzy comprehensive siting, rather than the independent contribution of a single flexible reconstruction operation. Meanwhile, the average outage duration and outage frequency of the system were significantly reduced by 35.6% and 28.5%, respectively, perfectly achieving a win-win situation of ecological emission reduction and high-reliability power supply. Specifically, the 14.4% reduction in equivalent carbon emissions was obtained by multiplying the difference in grid-purchased electricity before and after optimization by the unit carbon emission factor. The 35.6% reduction in average outage duration was calculated by comparing the SAIDI values of the traditional scheme and the DLC-FCS scheme, while the SAIFI reduction was obtained in the same way from the annual average outage frequency of the two schemes. A comprehensive comparison of the economic and environmental benefits of different substation planning models is shown in Table 4.
Table 4 Comparison of monetary costs and dimensionless environmental benefits of different substation planning models
| Planning Model | Initial Investment Cost (Million $) | Network Loss Cost (Million $) | Reliability Cost (Million $) | Total Monetary Cost (Million $) | Environmental Benefit Score (Dimensionless, 0–100) | Cost Reduction Rate |
| Traditional baseline | 12.50 | 3.85 | 4.20 | 20.55 | 65.4 | – |
| DD-DRO | 16.20 | 2.90 | 1.50 | 20.60 | 78.2 | -0.2% |
| MADRL-DSM | 11.80 | 3.10 | 3.90 | 18.80 | 82.5 | 8.5% |
| MOSSA-CSM | 11.50 | 3.15 | 3.75 | 18.40 | 81.0 | 10.4% |
| IGDT-SM | 15.80 | 3.05 | 1.80 | 20.65 | 76.8 | -0.4% |
| DLC-FCS | 10.90 | 2.75 | 2.37 | 18.02 | 91.5 | 12.3% |
In Table 4, the cost reduction rate was calculated only from the total monetary cost, namely the relative difference between the traditional baseline cost of USD 20.55 million and the total cost of each scheme. The total cost of the DLC-FCS scheme was USD 18.02 million, representing a 12.3% reduction compared with the traditional baseline, while its environmental benefit score reached 91.5, higher than 65.4 for the traditional scheme. It should be noted that the environmental benefit score was a dimensionless composite indicator and was not included in the cost reduction calculation.
4 Discussion and Interpretation
The DLC-FCS multi-attribute fuzzy evaluation model established in this study effectively balanced the conflicts between multiple indicators such as economy, reliability and environmental benefits in substation site selection. The study found that by introducing the interval number correlation method and the mean square error method for combined weighting, the comprehensive advantages and disadvantages of each candidate site can be accurately quantified. This is highly consistent with the view of Khanlari A et al. that the multi-attribute decision-making method can effectively overcome the limitations of a single indicator in the complex site selection of power facilities [17]. Meanwhile, the stability of the research model in processing multi-dimensional fuzzy information is also consistent with the conclusion of the high robustness of the hybrid multi-criteria decision-making method proposed by Yang D et al. in the comprehensive benefit evaluation of smart substations, further confirming the scientific nature of the research evaluation system [18].
In the comparison and discussion of planning costs and algorithm advantages and disadvantages, the study found that although the robust optimization model has a very high risk resistance in the scenario of no probability distribution, its inverse conservative decision-making will lead to a sharp increase in the initial investment and redundant capacity construction costs of substations. This calculation result is completely consistent with the phenomenon that extremely conservative decision-making will lead to a surge in system costs when Li Y et al. studied robust planning [19]. In addition, the calculation shows that although heuristic algorithms such as multi-agent deep reinforcement learning have strong network loss optimization capabilities, their reliability costs fluctuate greatly. This is consistent with the limitation of the MADRL algorithm discussed by Zhu Z et al. in distribution network applications, which is difficult to absolutely guarantee the underlying physical operation safety due to its black box characteristics [20]. In contrast, the research model, based on clear physical space topology and probability boundaries, not only reduced the positioning error by 18.7%, but also significantly reduced the total planning cost by 12.3%.
Finally, in terms of long-term operation and ecological value, the study found that the optimal scheme taking into account the uncertainty of distributed power sources greatly improved the local consumption level of new energy and significantly reduced the carbon emissions and environmental pollution indicators of the whole grid. This optimization result is completely consistent with the assertion of Farghali M et al. that the deep integration of renewable energy into the power sector can generate huge social, environmental and economic comprehensive positive benefits, which fully demonstrates the macro-engineering value of the site selection method proposed in the study in promoting the sustainable development of new power systems [21].
5 Summary and Future Work
With the rapid development of active power distribution networks, the randomness of output caused by DG grid connection poses a severe challenge to traditional spatial planning. To address the problem that static planning cannot adapt to dynamic load evolution, this study proposed a DLC-FCS substation site selection optimization model that considers uncertainty. This model used probabilistic sampling to correct the equivalent power of nodes, reconstructed a flexible topology using a weighted Voronoi diagram, and achieved global optimization through combined weighting and fuzzy evaluation. Simulation results showed that the research method was highly effective. In spatial positioning, compared with the comprehensive error of 594.3 meters in the traditional algorithm, this model significantly reduced the positioning deviation to 483.2 meters. In terms of economics, the optimized scheme reasonably controlled infrastructure investment to US$12.05 million, reduced expected network loss and reliability costs to US$2.82 million and US$3.15 million respectively, and reduced the total absolute cost of the system from US$20.55 million to US$18.02 million based on the traditional benchmark. Furthermore, the overall DLC-FCS optimization scheme increased the renewable energy accommodation rate by 13.7%, reduced annual carbon emissions by 14.4%, and decreased average outage duration and outage frequency by 35.6% and 28.5%, respectively. Despite the research’s success, limitations remain. Current calculations are primarily based on conventional weather distributions, failing to fully encompass the network disruption risks caused by extreme natural disasters; and the potential for novel energy storage and flexible load spatiotemporal response is still underdeveloped. Future research will incorporate dynamic configuration of mobile energy storage, the spatiotemporal evolution of electric vehicles, and real-time distribution network reconfiguration technologies into the site selection matrix to construct a highly resilient planning system with strong synergy between energy sources, grid, load, and storage under extreme disasters.
Funding
This research is supported by the the Key Science and Technology Project of China Southern Power Grid Co., Ltd. [Project No. GZKJXM20240244].
References
[1] Alvarado D, Moreno R, Street A, Panteli M, Mancarella P, Strbac G. Co-optimizing substation hardening and transmission expansion against earthquakes: A decision-dependent probability approach[J]. IEEE Transactions on Power Systems, 2022, 38(3): 2058–2070. DOI:10.1109/TPWRS.2022.3180363.
[2] Koutsoukis N C, Georgilakis P S. A multistage distribution network planning method considering distributed generation active management and demand response[J]. IET Renewable Power Generation, 2022, 16(1): 65–76. DOI:10.1049/rpg2.12325.
[3] Ali E S, El-Sehiemy R A, El-Ela A A A, Kamel S, Khan B. Optimal planning of uncertain renewable energy sources in unbalanced distribution systems by a multi-objective hybrid PSO-SCO algorithm[J]. IET Renewable Power Generation, 2022, 16(10): 2111–2124. DOI:10.1049/rpg2.12499.
[4] Saberi R, Falaghi H, Esmaeeli M, Ramezani M, Ashoornezhad A, Izadpanah R. Power distribution network expansion planning to improve resilience[J]. IET Generation, Transmission & Distribution, 2023, 17(21): 4701–4716. DOI:10.1049/gtd2.12751.
[5] Masiello R, Pandey S, Chatterjee D, Harper A, Jackson A, Takayesu E. Understanding grid flexibility: flexibility for integrated grid planning with distributed energy resources[J]. IEEE Power and Energy Magazine, 2024, 22(2): 60–66. DOI:10.1109/MPE.2023.3344421.
[6] Bystrom O. Next-generation distribution planning: How do we capture the value of distributed energy resources?[J]. IEEE Power and Energy Magazine, 2022, 20(2): 32–38. DOI:10.1109/MPE.2021.3134146.
[7] Fu X, Wu X, Zhang C, Fan S, Liu N. Planning of distributed renewable energy systems under uncertainty based on statistical machine learning[J]. Protection and Control of Modern Power Systems, 2022, 7(4): 1–27. DOI:10.1186/s41601-022-00262-x.
[8] Khasanov M, Kamel S, Halim Houssein E, Rahmann C, Hashim F A. Optimal allocation strategy of photovoltaic-and wind turbine-based distributed generation units in radial distribution networks considering uncertainty[J]. Neural Computing and Applications, 2023, 35(3): 2883–2908. DOI:10.1007/s00521-022-07715-2.
[9] Das S, Fosso O B, Marafioti G. Probabilistic planning of distribution networks with optimal DG placement under uncertainties[J]. IEEE Transactions on Industry Applications, 2023, 59(3): 2731–2741. DOI:10.1109/TIA.2023.3234233.
[10] Ogundairo O, Hasan M S, Kamalasadan S. Stochastic optimization of integrated transmission and distribution network considering distributed generation with uncertainties[J]. IEEE Transactions on Industry Applications, 2024, 60(4): 5577–5588. DOI:10.1109/TIA.2024.3395588.
[11] Bahrami S, Chen Y C, Wong V W. Dynamic distribution network reconfiguration with generation and load uncertainty[J]. IEEE Transactions on Smart Grid, 2024, 15(6): 5472–5484. DOI:10.1109/TSG.2024.3404859.
[12] Nasrollahi M, Arandian B, Baharizadeh M. Robust optimum distribution network scheduling with distributed generations, electric vehicles, and storage units[J]. International Journal of Energy Research, 2022, 46(7): 9431–9443. DOI:10.1002/er.7815.
[13] Pamshetti V B, Singh S, Thakur A K, Singh S P, Babu T S, Patnaik N, et al. Cooperative operational planning model for distributed energy resources with soft open point in active distribution network[J]. IEEE Transactions on Industry Applications, 2022, 59(2): 2140–2151. DOI:10.1109/TIA.2022.3223339.
[14] He C, Zhu J, Borghetti A, Liu Y, Li S. Coordinated planning of charging swapping stations and active distribution network based on EV spatial-temporal load forecasting[J]. IET Generation, Transmission & Distribution, 2024, 18(6): 1184–1204. DOI:10.1049/gtd2.12915.
[15] Panossian N, Muratori M, Palmintier B, Meintz A, Lipman T, Moffat K. Challenges and opportunities of integrating electric vehicles in electricity distribution systems[J]. Current Sustainable/Renewable Energy Reports, 2022, 9(2): 27–40. DOI:10.1007/s40518-022-00201-2.
[16] Su Y, Teh J. Two-stage optimal dispatching of AC/DC hybrid active distribution systems considering network flexibility[J]. Journal of Modern Power Systems and Clean Energy, 2022, 11(1): 52–65. DOI:10.35833/MPCE.2022.000424.
[17] Khanlari A, Alhuyi Nazari M. A review on the applications of multi-criteria decision-making approaches for power plant site selection[J]. Journal of Thermal Analysis and Calorimetry, 2022, 147(7): 4473–4489. DOI:10.1007/s10973-021-10877-1.
[18] Yang D, Mao W, Ye K. Comprehensive benefit evaluation of smart substation construction projects: A hybrid multi-criteria decision-making method for hybrid information[J]. International Journal of Fuzzy Systems, 2025, 27(6): 1771–1796. DOI:10.1007/s40815-024-01871-4.
[19] Li Y, Qiu F, Chen Y, Hou Y. Adaptive distributionally robust planning for renewable-powered fast charging stations under decision-dependent EV diffusion uncertainty[J]. IEEE Transactions on Smart Grid, 2024, 15(6): 5853–5870. DOI:10.1109/TSG.2024.3410910.
[20] Zhu Z, Chan K W, Xia S, Bu S. Optimal bi-level bidding and dispatching strategy between active distribution network and virtual alliances using distributed robust multi-agent deep reinforcement learning[J]. IEEE Transactions on Smart Grid, 2022, 13(4): 2833–2843. DOI:10.1109/TSG.2022.3164080.
[21] Farghali M, Osman A I, Chen Z, Abdelhaleem A, Ihara I, Mohamed I M, et al. Social, environmental, and economic consequences of integrating renewable energies in the electricity sector: a review[J]. Environmental Chemistry Letters, 2023, 21(3): 1381–1418. DOI:10.1007/s10311-023-01587-1.
Biographies

Ning Luo (February 24, 1986), female, graduated from Guizhou University with a master’s degree in Control Engineering. After graduation, I worked as a senior engineer at the Power Grid Planning Research Center of Guizhou Electric Power Grid Co., Ltd. My current research focuses on distribution network planning and the study of new power systems.

Mao Miao (July 2, 1989), female, graduated from Northeast Electric Power University with a major in Electrical Engineering and Automation, earning a bachelor’s degree. After graduation, I worked as an engineer at the Power Grid Planning Research Center of Guizhou Power Grid Co., Ltd. My current research focuses on distribution network planning and new distribution systems.

Fei Zheng (December 8, 1995), male, graduated from Guizhou University with a major in Control Engineering and obtained a bachelor’s degree. After graduation, I worked as an engineer at the Power Grid Planning and Research Center of Guizhou Power Grid Co., Ltd. My current research focuses on distribution network planning and research on new power systems.

Yang Zou (October 25, 1990), male, graduated from Guizhou University with a bachelor’s degree in Electrical Engineering and Automation. After graduation, I pursued studies in Electrical Engineering and Automation at Guizhou University. My current research focuses on work related to distributed new energy.

Qingyu Zhao (August 12, 1995), female, graduated from North China Electric Power University with a major in Smart Grid Information Engineering, and obtained a bachelor’s degree. After graduation, I worked as an engineer at the Grid Planning and Research Center of Guizhou Power Grid Co., Ltd. My current research focuses on distribution network planning and the study of new power systems.
Distributed Generation & Alternative Energy Journal, Vol. 41_5, 1181–1206
doi: 10.13052/dgaej2156-3306.4151
© 2026 River Publishers