Study on Mechanical Properties and Fatigue of Cold-rolled Steel Plate for Distribution Transformer
Jia Hailong1,*, Wang Zhihui1, Wang Shengjie1, Chen Wenqiang2, Liu Gaofei1 and Liu Jingzhi1
1State Grid Qinghai Electric Power Research Institute Xining Qinghai 810008 China
2State Grid Qinghai Electric Power company. Xining Qinghai 810001 China
E-mail: hailong5885@163.com
*Corresponding Author
Received 27 May 2024; Accepted 29 July 2024
Abstract
The oil tank steel plate of the distribution transformer is covered with welds, and the fatigue failure of the oil tank often occurs in the internal defects of fillet welds. Given the above problems, this paper puts forward the bearing capacity calculation formula of cold-rolled steel plate and carries on the force analysis of steel plate and the fatigue analysis of weld through finite elements. Based on the theory of plastic limit design, the ultimate flexural bearing capacity of the control section of steel plate members is proposed. The calculation formula of equivalent structural stress is given based on the calculation method of structural stress and linear elastic fracture mechanics, and the calculation method of fatigue life and fatigue cumulative damage is given. Then, the elastic-plastic equation is solved according to three criteria: Mises yield criterion, plastic flow criterion, and strengthening criterion. Based on the above numerical simulation analysis, the mechanical model of steel plate weld is constructed, the mesh is divided, the boundary conditions are restricted and the same load is applied. ABAQUS analysis results show that the stress distribution curve of the connector has a maximum value at X 80 mm and X 210 mm, that is, the top surface of the connector steel plate has an obvious stress concentration at 80 mm and 210 mm. When the length of the weld is not more than 60 times the size of the welding foot, the full section of the core plate will yield, and the maximum stress value of the weld element will not exceed the tensile strength value of the welding material. The error of the results calculated by the formula in this paper is mostly within 10%, and the rest is basically within 20%. Therefore, the bearing capacity formula of the steel plate in this paper has ideal calculation accuracy and can provide effective guidance for the design of distribution transformer oil tanks.
Keywords: Bearing capacity, equivalent structural stress, fracture mechanics, finite element analysis, transformer.
1 Introduction
The oil tank is an important part of the large power transformer. In the process of production and manufacturing, the tank has weld defects that are difficult to detect due to its large size, complex structure, and wide variety of welds [1]. During operation, the iron core, winding, and fan oil pump induce box vibration, so that weld seepage and oil leakage often occur in the defective welds of the transformer oil tank in the later stage, which greatly affects its operation safety and service life [2]. To ensure the safety and reliability of the transformer, it is very important to analyze the fatigue damage of the transformer tank. The analysis of the fatigue life of the corner welds on the transformer tank is crucial to ensure the safety and reliability of the transformer. According to statistics, about 30% of oil leakage faults in transformers are caused by poor quality of welding joints. Among them, the L-shaped angle welds on the side wall of the transformer tank have complex stress conditions, are difficult to inspect, and often have minor defects, making them a common site of failure. Therefore, it is important to analyze the fatigue life of the corner welds on the transformer tank.
Liu Jun and colleagues developed an all-encompassing safety assessment model for pressure vessels, integrating the contemporary fatigue fracture assessment techniques applied to transformer steel plate welds. Su and associates, drawing on the stress-based approach and adhering to ASME V2 and EN13445 standards, delved into the fatigue life analysis of pressure vessel flat seal angle welds. Saju and team utilized electron beam welding with varying parameters for Inconel 718 and Nimonic 80A superalloys, revealing through simulation that an increase in tool speed and stroke speed led to heightened temperatures within the weld zone, with the forward tool side experiencing higher temperatures than the rear [5, 6]. Jiang Gongfeng et al. performed a strain-controlled low-cycle fatigue life test on pressure vessel stainless steel, demonstrating that pre-strain strengthening enhances structural fatigue life. Hugaas and collaborators estimated the residual life of a damaged pressure vessel by determining the S-N curve associated with local fiber-initiated fatigue failure. Lastly, Kabiri and associates employed the residual strain energy approach to estimate the fatigue life of composite pressure vessels.
Welds are widely distributed in the steel plate of the distribution transformer oil tank, and the fatigue failure phenomenon of the oil tank is often concentrated in the internal defects of the fillet welds. Addressing this pivotal issue, this study delves into the comprehensive analysis of the load-bearing capacity assessment model for cold-formed steel plates. Utilizing the finite element technique, an exhaustive stress analysis is executed, with a particular emphasis on the weld’s fatigue performance. Theoretical insights are garnered through the application of the plastic limit design principle, which forms the basis for proposing a novel equation to estimate the maximum bending capacity of the governing section in steel plate structures. Moreover, an integrative approach is adopted, blending the methodology for structural stress computation with the principles of linear elastic fracture mechanics, leading to the development of an equivalent stress model. In terms of fatigue life prediction, an effective method for calculating fatigue life is proposed based on the principal S-N curve, and the calculation strategy of fatigue cumulative damage is discussed. To simulate and analyze the stress-strain state of steel plate weld more accurately, the elastic-plastic equation is solved in detail by following the Mises yield criterion, plastic flow criterion, and strengthening criterion. On this basis, through the numerical simulation technology, the mechanical model of the steel plate weld is constructed, the mesh is divided, the reasonable boundary conditions are set up, and the corresponding load is applied. This series of research methods not only improves the accuracy of analysis but also provides a strong theoretical basis and technical support for solving the problem of fatigue failure of distribution transformer oil tanks.
2 Equivalent Structural Stress and Bearing Capacity of Steel Plate Based on Fracture Mechanics
2.1 Equivalent Structural Stress and S-N Curve
At present, there are two main methods to analyze structural fatigue crack growth: energy balance theory and stress field strength theory. The Stress Intensity Theory necessitates the computation of the Stress Intensity Factor, an essential criterion for assessing the potential for crack propagation. This factor is determined by the stress field and the displacement field surrounding the crack tip, hence necessitating a comprehensive understanding of these dynamics. Consider an infinite plate with a centrally located through-crack of length 2a, subjected to biaxial tensile stresses. The stress distribution at the crack tip is depicted in Figure 1.
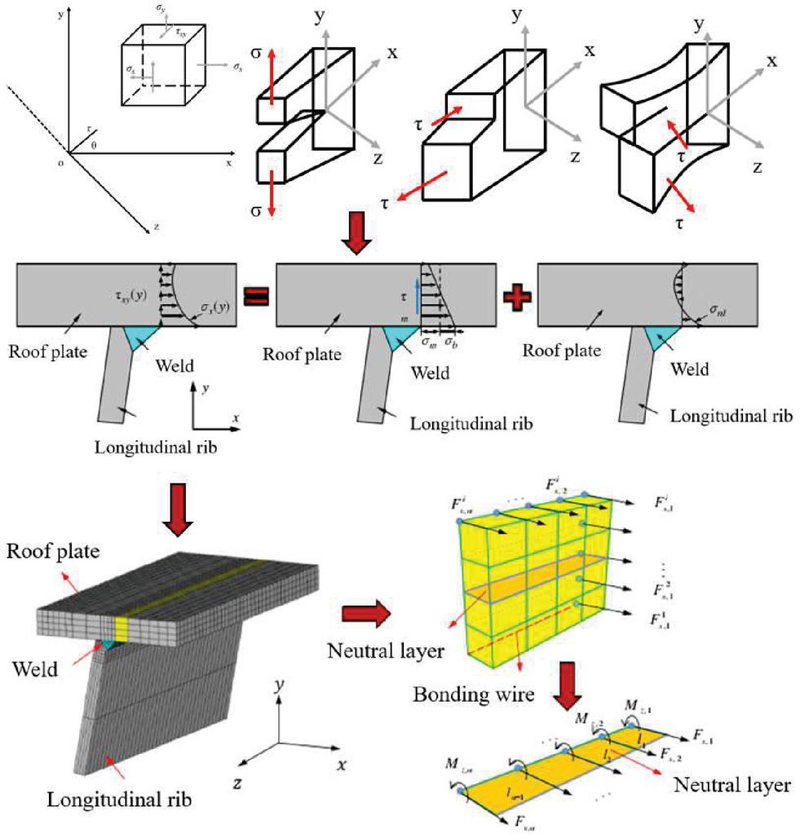
Figure 1 Equivalent structure diagram.
According to linear elastic fracture mechanics, the stress field, displacement field and the corresponding stress-intensity factor calculation formula of a certain point P(r,o) at the tip of fatigue crack of type I, type II and type III can be obtained, which can be simplified to the following formula according to the similarities of the formulas.
| (1) | |
| (2) | |
| (3) |
In the above formula: (i,j = 1,2,3) are stress components. (i-1, 2, 3) is the strain component. () and () are functions of the polar Angle . r and are polar coordinates of the crack front. is the stress intensity factor. is the nominal stress (type I cracks, is the normal stress , type II and III cracks, is the shear stress ). Y is the shape factor. a is the crack size.
Due to the presence of notch stress in the welded joints of the welded structure, the stress distribution exhibits a significant degree of nonlinearity, posing challenges for direct solutions. However, this complexity can be mitigated by decomposing the stress into two distinct components [11]. The first part of stress is only related to and balanced with external forces, which can be decomposed into film stress caused by tensile action and bending stress caused by bending action. The second part of stress is called notch stress , which is in a self-equilibrium state.
The thickness of the plate is , and the membrane stress is calculated according to Equation (4):
| (4) |
Bending stress is calculated according to Equation (5):
| (5) |
Structural stress is the force balanced with external force, and its value is calculated according to Equation (6):
| (6) |
In the above formula: is the normal stress of the section. is the linear force per unit length of the toe line. mx is the bending moment per unit length of the toe wire.
The joint force and joint bending moment of each column in the thickness direction are converted into the joint force on the neutral layer, and finally, the line force is obtained from Equation (7) according to the balance relationship of the force [12].
| (7) |
Matrix in Equation (7) is the inverse matrix of equivalent element matrix L and is only related to node distance, and its equivalent element matrix L is expressed as follows:
| (8) |
In the same way, the expression of the line bending moment can be obtained. Therefore, the structural stress of each node can be obtained by using the node force matrix and the bending moment force matrix of each node according to Equation (9):
| (9) |
The normal stress S-N curve is generally determined by the following formula:
| (10) |
The above formula is expressed in log-log mode:
| (11) |
Considering the discreteness of the fatigue data and ensuring the safety of the design, the fatigue strength curve must have a certain survival rate:
| (12) |
Where: is fatigue life. m is the negative inverse of the slope of the S-N curve. v is the standard deviation of lgN. d is the guarantee rate parameter. Table 1 lists the guarantee rate parameters corresponding to common survival rates.
Table 1 Guarantee rate parameters
| Survival rate | 50 | 84.14 | 90.33 | 95.06 | 97.61 | 97.81 | 99.87 |
| Guarantee rate parameter | 0 | 1 | 1.3 | 1.66 | 1.94 | 2 | 3 |
Fatigue can be categorized into two distinct types based on the number of failure cycles: high-cycle fatigue and low-cycle fatigue. At high cycle fatigue, the stress level of the action is low, and the number of failure cycles is generally higher than 1010. In low-cycle fatigue, the stress level is higher, and the number of failure cycles is generally lower than 1010. The S-N curve of each basic standard is only applicable to high-cycle fatigue, but not to low-cycle fatigue. The applicable range of AWS, IIW, and JSSC is N 10, the applicable range of BS is N 10, and the applicable range of GB is N 510.
2.2 Ultimate Bending Capacity of Cold Rolled Steel Plate
In this section, before computing the bending capacity of the control section, it is imperative to conduct a thorough assessment of the local buckling phenomenon exhibited by the cold-rolled steel plate situated on the compression side of the section. According to relevant research results [13, 14], through the brief calculation of Equations (13)–(14), it can be seen that the crest part of the cold-rolled steel plate on the compression side is effective in all sections during the stress process of the member, and will not suffer local buckling. And in the cold rolling process, the two sides of the steel plate are usually in contact with other materials or their undeformed parts, such continuous support can effectively resist the trend of local buckling. Therefore, it can be judged that the rest of the inner part of the cold rolled steel plate on the pressed side will not have local buckling. Thus, it can be shown that under the bending state of cold-rolled steel plate composite members, the cold-rolled steel plate on the compression side of the section is always effective in the full section, and its bearing capacity will not be reduced due to local buckling [15]. After this is clear, the ultimate bending bearing capacity of the control section of the member can be obtained according to the plastic limit design theory, as shown in Equation (15).
| (13) | |
| (14) | |
| (15) |
Where: is the buckling equivalent coefficient. and are local buckling coefficients and local buckling stresses, respectively. The parameters , , , and represent the steel yield strength, ultimate strength, elastic modulus, and Poisson’s ratio, respectively. The variable tw signifies the thickness of the cold-rolled steel plate. The term designates the ultimate bending capacity of the control section. Additionally, , , and denote the lengths of the crest plate, slope plate, and trough plate in the cold-rolled steel plate, respectively.
Once the ultimate bending bearing capacity of the control section is determined through Equation (15), it is possible to deduce the bending moment at the mid-span section of the member, when the control section is subjected to its ultimate stress state [16]. This calculation is based on the mechanical relationship between the internal force in the middle section of a simply supported beam and the applied external load. Subsequently, this analysis yields the maximum mid-span load that the member can sustain, as detailed in Equations (16) and (17).
| (16) | |
| (17) |
Where: is the mid-span section bending moment of the cold-rolled steel composite member of the transformer under the ultimate stress state. is the maximum mid-span load that can be borne by cold-rolled steel composite members of transformers.
3 Finite Element Mechanical Model of Transformer Steel Plate
3.1 Welding Stress-strain Analysis
Heat input in the welding process will lead to stress and deformation of weld parts, and the distribution law of stress and deformation will change with the change of welding heat input (welding process) [17]. During the welding process, as the heat source is applied, the localized temperature of the metal material within the weldment experiences a rapid escalation. This transformation results in a shift from the elastic to the plastic state, alongside a change in the constitutive relationship between stress and strain from a linear to a nonlinear pattern.
In the context of numerical simulation for welding, the application of thermoelastoplasticity adheres to a set of presumptions based on the thermoelastoplastic finite element method. These presumptions encompass the Von Mises yield criterion, which determines the onset of plastic deformation, the plastic flow criterion, which describes the behavior of the material during plastic deformation, and the reinforcement criterion, which accounts for the material’s hardening behavior.
(1) Von Mise yield criterion When the stress of the metal material is less than its yield limit, the stress and strain are linearly related, and the deformation of the metal material is elastic. When the stress on the metal material exceeds its yield strength, plastic deformation will occur [18]. Mises yield criterion refers to the stress state of each point in the object after deformation, and when the stress value of one point exceeds the yield limit, it reaches the plastic state and maintains the conditions followed by its plastic properties. The expression of Mises’s yield criterion is:
| (18) |
In the formula, , , and are the principal stresses in the three orthogonal directions, MPa.
(2) Plastic flow criterion Plastic flow quasi describes the direction of plastic strain after the plastic deformation of a material. When the plastic strain is perpendicular to the yield surface, it is called the correlated flow criterion, otherwise, it is called the non-flow criterion [19]. The expression of the flow criterion for the correlation between stress and plastic strain increment states is shown in (19):
| (19) |
Where: represents plastic strain increment. is a plastic multiplier.
(3) Strengthen the principles of Huai The strengthening criterion describes the development process of yield criterion with strain increment. The two main reinforcement criteria in the ABAQUS program are isotropic reinforcement and follow-up reinforcement [20]. Isotropic strengthening refers to the expansion in size that occurs as a direct consequence of the amount of work performed by the plastic deformation of the material within its yield surface. According to the Mises criterion, this expansion occurs uniformly in all directions, from the initial yield surface to the subsequent yield surface [21]. Conversely, follow-up strengthening involves the movement of the yield surface in the direction of yielding, while maintaining its original size.
In the finite element analysis of welding thermoelastic-plastic phenomena, four fundamental relations are taken into account: the strain-displacement relation (compatibility condition), the stress-strain relation (constitutive relation), the equilibrium condition, and the corresponding boundary condition.
The strain-displacement relation describes the relationship between displacement and strain at various points inside an object. In finite element analysis, this relationship is usually expressed by geometric equations. For small deformations, a linear geometric equation, Hooke’s law, can be used. The stress-strain relation describes the response of a material under stress, which is the constitutive model of the material. In thermoelastoplastic analysis, the commonly used constitutive models include the linear elastic model, elastoplastic model, and thermoelastoplastic model. The equilibrium condition means that at any given moment, the stress distribution inside the body must satisfy the equilibrium equation of the forces. This includes the static equilibrium equation and the dynamic equilibrium equation. The boundary conditions define the force and displacement constraints of an object on the boundary. In the welding thermoelastoplastic analysis, the boundary conditions include the constraint of the welding area, external load, fixed support, and so on.
(1) Stress-strain relationship (compatibility condition) The stress-strain relationship of the material in the elastic or plastic state is:
| (20) |
Where [D] is an elastic or plastic matrix. {C} Temperature-dependent vector.
In the elastic zone:
| (21) | |
| (22) |
Wherein, a denotes the coefficient of linear expansion, while T represents the temperature. Now, within the plastic zone, the material’s yield conditions are defined as follows:
| (23) |
Here, represents the yield function, while denotes the yield stress function, which is inherently linked to the temperature and plastic strain, as stated in [22].
Under the plastic flow criterion, the plastic strain increment can be mathematically expressed as:
| (24) |
When in the plastic zone, the load is being unloaded.
(2) Equilibrium equation The equilibrium equation in a unit of the structure is:
| (25) |
Among them:
| (26) | |
| (27) |
Balance equations of the whole component:
| (28) |
3.2 Construction of Finite Element Mechanical Model
The transformer plays a key role in power transmission, welding is the main processing technology in transformer manufacturing, and its stress distribution and deformation after welding is the premise of the whole transformer safety work. The upper and lower case of transformer oil are connected by bolts, and then the interface is sealed by welding [23]. In this study, the welding of the upper box is mainly considered. The upper box is mainly composed of box wall, box top, edge, and channel steel. The welding assembly process is as follows: first, the box wall is spliced, then the channel steel is welded to the box wall, then the box wall is welded to the box edge, and finally, the top of the box is welded. To reduce the number of welds and save calculation time, it is assumed that the channel steel and the box wall are integrated, that is, the welding stress and deformation between the channel steel and the box wall are not considered. In this paper, six butt welds of box wall splicing, four fillet welds of box wall and box edge, and four fillet welds of box wall and box cover welding are mainly studied. For the welding of the butt weld, spot welding is first used to fix it, and then the weld is segmented. In addition, the external loads involved in the welding process, such as the lifting of the box wall, the box edge and the box cover, and the flipping, are not considered in the numerical simulation calculation. The specific model is shown in Figure 2.
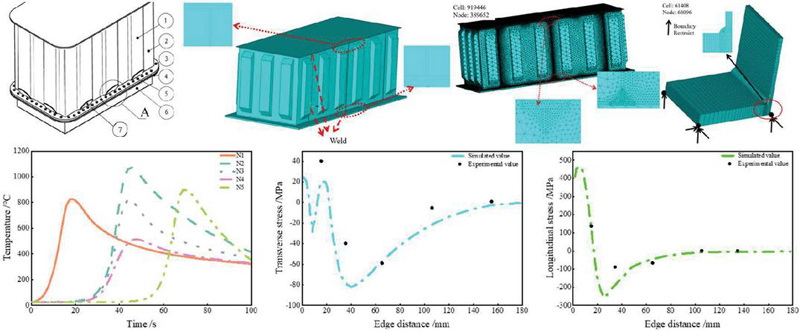
Figure 2 Finite element model.
The rectangular rubber gasket used in this model is made of nitrile rubber.
As the rubber material is superelastic, the following assumptions are proposed for the sealing gasket [24]:
(1) It is assumed that the change in working environment temperature does not affect the sealing performance of the gasket.
(2) Assume that the rubber material is continuous and uniform.
(3) The longitudinal compression rate of the sealing gasket is controlled by the specified displacement of the constrained boundary.
The internal pressure of the transformer flange is related to the height of the box, and it can be seen from the above that the transformer internal pressure selected in this paper is 0.3 MPa. M30 bolts are used according to flange standards. The material properties at room temperature are shown in Table 2.
Table 2 Material performance parameters
| Name | Materials | Elastic model | Poisson’s ratio | Yield strength |
| Francois | Q460 | 2.06 | 0.3 | 345 |
| gasket | NBR | 6.2 | 0.49 | 3.48 |
| Bolt | 45 steel | 2.08 | 0.268 | 640 |
The basic parameters of the model are shown in Table 3.
Table 3 Transformer tank analysis model parameters table
| Name | Value |
| Width | 100 |
| Thickness of the flange plate | 40 |
| Box wall plate thickness | 12 |
| Length | 144 |
| Thickness | 24 |
| Slot depth | 4.6 |
| Slot width | 13 |
Based on ABAQUS analysis and calculation, a set of bolts along the transformer box is selected to establish a model. To simplify the calculation as far as possible in the sealing system in this paper, since flanges, gaskets, and bolts are all axisymmetric structures, a three-dimensional mechanical model can be established by taking 1/2 of the total structure according to the principle of symmetry. For the sealing of larger flanges, a closed sealing structure must be adopted. The bolt and nut were simplified to model, and the bolt was bound and restrained with the lower flange so that there was no relative displacement between them [25]. In the model, except for the gasket using the C3D8RH hexahedron element, the other structures in the system are divided into meshes using the C3D8R hexahedron element. The 3D model grid is generated by sweep. Gasket and contact key areas pay attention to the subdivision grid.
Based on the symmetry of structure and load, symmetric boundary conditions should be added to all the symmetric surfaces of bolts and upper and lower flanges. To simulate the actual situation, the left side of the lower flange should be fully constrained, the vertical direction of the upper flange should be free, the compression rate should be controlled by adjusting the displacement of the vertical direction of the upper flange, and the other directions should be restricted. The Coulomb friction model is adopted for the contact between the rectangular sealing gasket and the upper and lower flanges, in which the friction coefficient of the contact position between the gasket and the flange is selected as 0.2, and the uniformly distributed pressure load is applied to the side of the gasket that is in contact with the insulating oil in the box to simulate the liquid pressure.
The loads are applied in two steps:
(1) In the first analytical step, a small preload is applied, selecting a cross-section on the bolt where the force is applied, and maintaining the model in a stable state of loading. The second load step changes the preload to its actual required size. The remaining load steps maintain the current length of the bolts.
(2) Apply internal pressure to the surface that bears it. Define the boundary conditions.
4 Simulation Analysis
4.1 Bending Bearing Capacity Analysis of Cold Rolled Steel Plate
To further substantiate the efficacy and precision of the theoretical formula for initial bending bearing capacity, a comprehensive analysis was conducted using 128 finite element model examples organized into 8 distinct groups. These examples varied in terms of the geometric parameters of the finite element model. A comparative study was then undertaken between the initial bending bearing capacity values derived from the theoretical formula and the outcomes obtained from the finite element simulations, as depicted in Figures 3 and 4. The theoretical formula for the initial bending capacity of different , , , and conditions closely matches the numerical simulation results, only when these four parameters are sufficiently large will they affect the simulation, resulting in minor differences. At the same time, the verification results further show that the error of the results calculated by the formula is mostly less than 10%, and the rest is less than 20%.
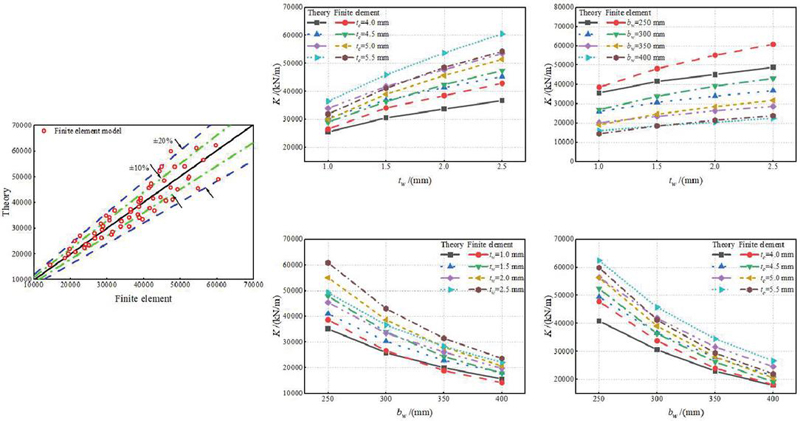
Figure 3 Comparison between theoretical formula and simulation of flexural capacity.
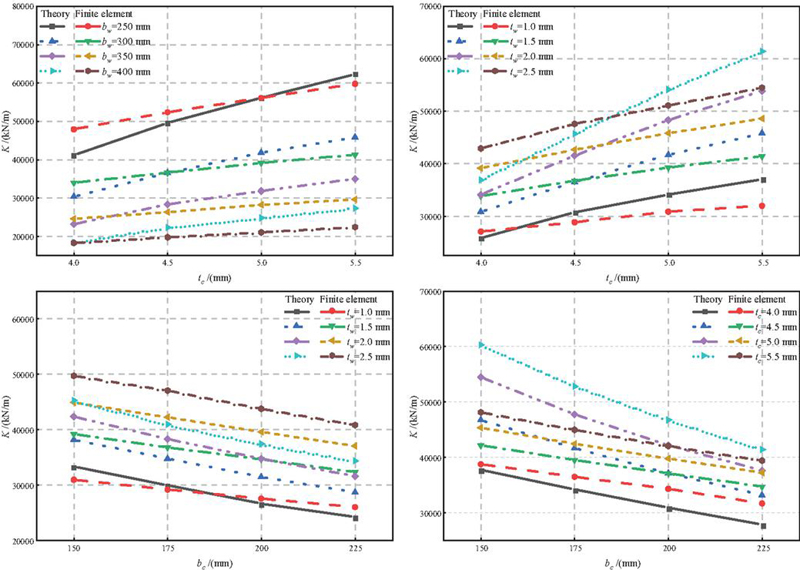
Figure 4 Bearing capacity affected by different parameters.
This section verifies the validity of the theoretical formula based on the comparison of the calculation results of the initial bending bearing capacity of cold-rolled transformer steel plate members with the measured results and the finite element numerical calculation results. At the same time, it is shown that the formula has ideal calculation accuracy, which can provide a theoretical reference design basis for the practical engineering design of the new composite component.
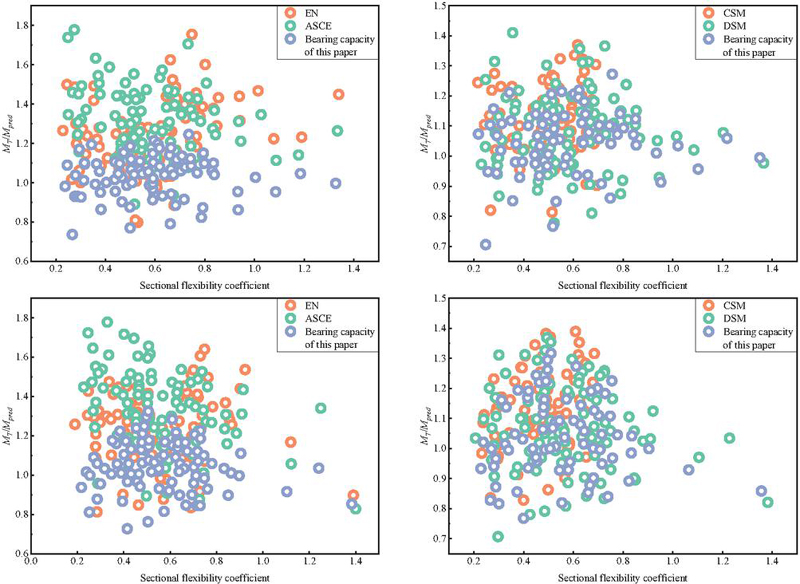
Figure 5 Analysis of flexural bearing capacity of steel plate members.
From Figure 5, the following observations can be gleaned: (1) The proposed formula in this study yields data points that cluster around an ordinate value of 1.0, demonstrating excellent concordance between calculated and experimental results. (2) When the section compliance coefficient exceeds 0.75, calculations per the European and American specifications yield comparable values. However, due to the conservative effective width coefficient in the European standard, its calculated values are marginally lower than those from the American standard. This threshold of 0.75 aligns approximately with the effective width coefficient of 1 in the novel effective width method presented in this work. (3) In the range of 0.65 to 0.75 for the section compliance coefficient, the ratio of test to calculated values for both European and American specifications is notably higher than when the coefficient is above 0.75. This suggests that the component is functioning in full section, necessitating the application of European and American specifications to accurately calculate the effective section and enhance the test-to-calculated value ratio. (4) When the section flexibility coefficient lies between 0.62 and 0.65, the component falls under Class 3 in the European code, and the section’s yield bending moment, along with corner reinforcement, is considered its bending capacity. At this point, the European code’s calculated value closely aligns with the experimental results. (5) For section compliance coefficients below 0.62, the section is classified as either Class 1 or Class 2 in the European code. As the section compliance coefficient decreases, the ratio of test to calculated values for both European and American codes generally increases, with the American code’s calculated value being lower. The maximum bending capacity in the European code is determined by the product of the nominal yield strength and the plastic section modulus. As the section flexibility coefficient diminishes, the stress-enhancing properties of stainless steel become more evident, leading to stresses in the member that significantly surpass the nominal yield strength. This paper advocates for a more rational approach, using the product of the ultimate tensile strength and the plastic section modulus as the upper limit for the section’s bending capacity.
As can be seen from the figure, when the material parameters generated by the cold-formed component materials in this paper are used to calculate the bending capacity of the component, the ratio of the test value to the calculated value is similar to that calculated by the material parameters in the test (Figure 5). From the above analysis, it can be seen that when the production mode of the component is clear, the material performance parameters of the cold-formed component materials in this paper are used to calculate the flexural bearing capacity of the component, which is in good agreement with the test data, and the calculation accuracy is significantly improved.
4.2 Influence Analysis of Steel Plate Weld Connection
Figure 6 illustrates the stress distribution across a steel plate subjected to varying weld lengths. Upon straining the connector, the peak stress is observed at the welded right-angle position on the steel plate’s top surface. As the joint undergoes strain, the top surface of the connector’s steel plate initially attains the steel’s yield strength. If the stress level on the top surface of the steel plate remains below this yield strength, the remaining connector remains in the elastic regime. Analyzing the stress distributions of 502016, 602016, and 702016 connectors, it becomes evident from the plotted lines that under the ultimate tensile load, all the stresses at the top surface of these three connector types’ steel plates are below the actual yield strength of the steel. This shows that all parts of the three types of connectors are completely in the elastic stage during the whole connection joint stress process, and the connector has no deformation.
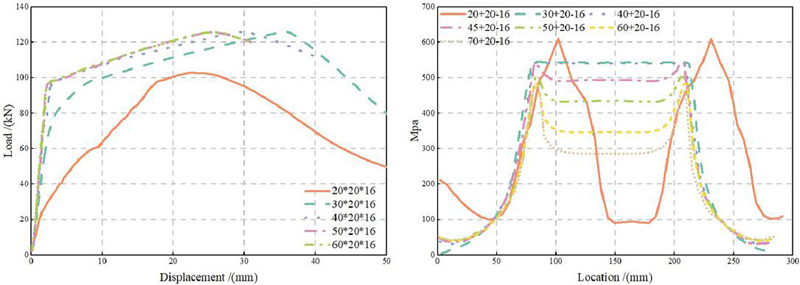
Figure 6 Stress distribution curve of welding length variation.
As can be seen from the figure, the stress distribution curve of the connector has a maximum stress value at x 80 mm and x 210 mm, that is, there is an obvious stress concentration between the top of the connector steel plate at 80 mm and 210 mm. The mechanism of the stress concentration phenomenon is that the steel bar connected by the plate connector exerts a biased load relative to the steel plate, so the stress maximum occurs at the right angle formed by the welded straight thread sleeve and the steel plate. At the same time, due to the symmetry of the connector itself, the maximum stress value at 80 mm and 210 mm is the same, and the stress distribution curve is completely symmetric with X 145 mm as the symmetry axis.
It can be seen that the maximum stress values of 50*20*16, 60*20*16, and 70*20*16 connectors at the 80 mm stress concentration are 510.7 MPa, 492.1 MPa, and 468.5 MPa respectively, and the stress ratio at the stress concentration is 1:0.963:0.917. This shows that with the increase in the height of the steel plate, the maximum stress value at the stress concentration also decreases gradually.

Figure 7 Stress distribution curve of steel plate thickness change.
Observing Figure 7, the stress distribution curve of 50*15*16 connectors reveals that under the ultimate tensile load, localized steel within the 50*15*16 connector plate attains the yield strength, leading to localized plastic deformation. This deformation aligns precisely with the load-displacement curve for the 50*15*16 connector. Additionally, the stress distribution curve of 50*10*16 connectors indicates that under the ultimate tensile load, the steel plate at the welded right angle of the connector undergoes significant plastic deformation. In the deformation cloud map, the steel located at X 40–120 mm and X 200–280 mm exceeds the yield strength, attaining the ultimate tensile strength of the connector’s steel, ultimately leading to the fracture of the steel plate. Due to the fracture of the steel plate X 40–120 mm and X 200–280 mm, the stress in the X 140–180 mm segment decreases rapidly, and the bottom of the stress distribution curve appears. At the same time, because the Angle of the end of the steel plate is very large, there is serious extrusion cutting between the steel bar the welded straight thread sleeve, and the welded steel pipe, so the same stress at the welded straight thread sleeve and the welded steel pipe reaches the yield strength of the steel. Moreover, the stress distribution is irregular, and the end of the welded straight thread sleeve and welded steel pipe appear obvious extrusion deformation. The maximum stress values of 50*20*16, 50*25*16, and 50*30*16 connectors at 80 mmm are 510.7 MPa, 445.9 MPa, and 398.2 MPa respectively, and the stress ratio of the maximum stress value is 1:0.73:0.779. This shows that with the increase of the thickness of the steel plate, the maximum stress value at the stress concentration also decreases gradually.
As depicted in Figure 8, a study was conducted to examine the effect of weld length on the average shear strength of welds, utilizing three types of Q460 steel with varying yield strengths and two types of E55 welding materials. The findings indicate that, when the weld length is shorter than 60 times the size of the weld foot, the core plate experiences yielding, and consequently, the average shear strength of the weld remains stable. Moreover, it is observed that a higher yield strength of the steel correlates with a higher average shear strength of the weld. Conversely, when the weld length surpasses 60 times the weld foot size, the weld itself yields, resulting in a decrease in the average shear strength of the weld as the length increases.
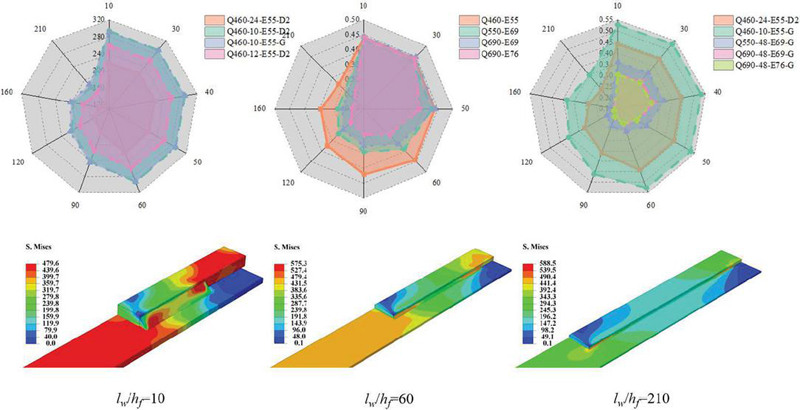
Figure 8 Numerical analysis of joints with different weld lengths.
Figure 8 shows the numerical results of 9 joints of different weld lengths modeled using Q460 steel and E55 welding materials. When the weld length does not exceed 60 times the weld toe size, the entire section of the core plate undergoes yielding, and the maximum von Mises stress value of the weld element remains below the tensile strength of the E55 welding material. However, as the weld length increases, the stress in the weld also intensifies. To mitigate the risk of weld failure, the maximum von Mises stress value of the weld element, reaching the tensile strength of the E55 welding material, serves as a numerical criterion, indicating the occurrence of weld yielding. The stress cloud map of the weld, where von Mises stress represents the true stress, reveals that with increasing weld length, the stress distribution exhibits higher values at both ends and lower values in the middle, signifying a progressively more severe degree of unevenness. According to the finite element calculation results, the main conclusions are summarized as follows: (1) When the weld length does not exceed 60 times the weld foot size, the average shear strength remains unchanged. When the weld length exceeds 60 times the weld foot size, the average shear strength decreases gradually with the increase of the weld length. (2) Even if the steel and welding material of the same strength grade (for example: 24 mmm thick Q460 steel matching E55-D2 type welding material and 10 m thick Q460 steel matching E55-G type welding material), the average shear strength coefficient of the side fillet weld will be greatly different. (3) With the increase of steel strength grade, the average shear strength coefficient gradually decreases.
5 Conclusion
The oil tank of the distribution transformer is welded with a steel plate, and the welds in its structure, especially fillet welds, often become weak points of fatigue damage, which mainly stems from the defects that may exist inside the welds. To solve this problem, an innovative calculation method is put forward, that is, the bearing capacity formula of a cold-rolled steel plate is used to analyze the force of the steel plate. Through numerical simulation, the behavior of steel plates under stress is studied in depth, and the fatigue life of welds is analyzed. Specific conclusions are as follows.
1. The resulting error of the formula of ultimate bending bearing capacity of steel plate proposed in this paper is mostly within 10%, and the rest is basically within 20%. The ratio of the test value to the calculated value is similar to the calculated value when the material parameters of the cold-formed component materials are used to calculate the flexural capacity of the component. Therefore, the bearing capacity formula in this paper is in good agreement with the experimental data, which significantly improves the calculation accuracy.
2. The finite element simulation results show that the stress distribution curve of the connector has a maximum value of stress at x 80 mm and x 210 mm, that is, there is an obvious stress concentration between the top of the steel plate of the connector at 80 mm and 210 mm. A deflection load is applied to the steel plate of the transformer tank so that a stress maximum occurs at the right angle formed by the welded steel plate. At the same time, due to the symmetry of the connector itself, the maximum stress value at 80 mm and 210 mm is the same, and the stress distribution curve is completely symmetric with X 145 mm as the symmetry axis.
3. When the weld length does not exceed 60 times the weld foot size, the average shear strength remains unchanged. When the weld length exceeds 60 times the weld foot size, the average shear strength decreases gradually with the increase of the weld length. With the increase of steel strength grade, the average shear strength coefficient decreases gradually.
In this paper, the effect of external load superposition on residual stress is not considered in the welding process of transformer box structures. To ensure the stable operation of the transformer box structure, it is necessary to further study the stress and deformation distribution law after external load and welding residual stress superimposed.
References
[1] Liu Wenze, Zhang Jun, Deng Yan. Transformer fault diagnosis method based on deep confidence network and multidimensional information fusion [J]. Electric Power Engineering Technology, 2019, 38(6): 16–23. (in Chinese)
[2] Ahola A, Björk T, Barsoum Z. Fatigue strength capacity of load-carrying fillet welds on ultra-high-strength steel plates subjected to out-of-plane bending[J]. Engineering structures, 2019, 196: 109282.
[3] Liu Jun, Huang Chen, Chen Shaowei, et al. Comprehensive Safety Evaluation Method based on Defect Quantification of Pressure Vessel [J]. Journal of Mechanical Strength, 2015, 37(4): 706–711.
[4] Su Wenxue, Zhou Feige, Fan Bin. Research on fatigue life of flat seal angular welds based on European and American pressure vessel codes [J]. Journal of University of Shanghai for Science and Technology, 2015, 37(4): 350–354.
[5] Saju T, Velu M. Finite element and experimental analysis of residual stresses in electron beam welded nickel-based superalloys[J]. European Journal of Computational Mechanics, 2021: 255–274.
[6] Saju T, Velu M. Finite Element Simulation of Friction Stir Welding of Inconel 718 to Nimonic 80A[J]. European Journal of Computational Mechanics, 2020: 417–436.
[7] Jiang Gongfeng, Sun Liang, Chen Gang. Experimental Study on strain-strengthened fatigue life of 304 Stainless Steel [J]. Mechanical Strength, 2014, 36(6): 850–855.
[8] Hugaas E, Echtermeyer A T. Estimating SN curves for local fiber dominated fatigue failure in ring specimens representing filament wound pressure vessels with damage[J]. Composites Part C: Open Access, 2021, 5: 100135.
[9] Kabiri Ataabadi A, Ahmadi Jeyed G. Strength analysis and fatigue life estimation of composite pressure vessel (CPV) based on the residual strain energy (RSE) approach[J]. International Journal for Computational Methods in Engineering Science and Mechanics, 2020, 22(2): 81–102.
[10] Gupta S, Dwivedi D K, Tripathy M. Creep failure analysis of crimp joints in aluminium and copper windings of distribution transformers[J]. Engineering Failure Analysis, 2024, 156: 107845.
[11] Sun Y, He A, Liang Y, et al. In-plane bending behaviour and capacities of S690 high strength steel welded I-section beams[J]. Journal of Constructional Steel Research, 2019, 162: 105741.
[12] Liu X, Wang Y, Ban H, et al. Flexural strength and rotation capacity of welded I-section steel beams with longitudinally profiled flanges[J]. Journal of Constructional Steel Research, 2020, 173: 106255.
[13] Tong J Z, Yu C Q, Zhang L. Sectional strength and design of double-skin composite walls withre-entrant profiled faceplates[J]. Thin-Walled Structures, 2021, 158: 107196.
[14] Zhao Q, Li Y, Tian Y, et al. Cyclic behavior of corrugated double-skin composite walls with different aspect ratios[J]. Journal of Structural Engineering, 2020, 146(10): 04020214.
[15] Negrin I, Kripka M, Yepes V. Design optimization of welded steel plate girders configured as a hybrid structure[J]. Journal of Constructional Steel Research, 2023, 211: 108131.
[16] Zhao Z, Liu H, Liang B. Bending capacity of corroded welded hollow spherical joints[J]. Thin-Walled Structures, 2018, 127: 523–539.
[17] Zhu L, Wang P, Gao S, et al. Research on mechanical properties of winding axial bending under unbalance of transformer pad[C]//Journal of Physics: Conference Series. IOP Publishing, 2023, 2465(1): 012001.
[18] Sayadi A, Mahi D, Fofana I, et al. Modeling and predicting the mechanical behavior of standard insulating kraft paper used in power transformers under thermal aging[J]. Energies, 2023, 16(18): 6455.
[19] Chen B Q, Hashemzadeh M, Guedes Soares C. Numerical analysis of the effects of weld parameters on distortions and residual stresses in butt welded steel plates[J]. Developments in maritime transportation and exploitation of sea resources, C Guedes Soares & F Lopes Peña (Eds.) UK: Taylor & Francis Group, 2014: 309–320.
[20] CAI J P, Jiang X H, Zhang Y J, et al. Effect of Groove Form on Residual Stress and Deformation of SUS304 Austenitic Stainless Steel Butt Joint [J]. Journal of Welding Technology, 2016, 37(2): 63–66. (in Chinese).
[21] Chen B Q, Soares C G. Experimental and numerical investigation on welding simulation of long stiffened steel plate specimen[J]. Marine Structures, 2021, 75: 102824.
[22] Tarimoradi H, Askari M. A new method for analyzing the impact of winding mechanical defects on the equivalent circuit parameters of power transformers[J]. IET Generation, Transmission & Distribution, 2023, 17(18): 4072–4085.
[23] Venkatkumar D, Ravindran D, Selvakumar G. Finite element analysis of heat input effect on temperature, residual stresses and distortion in butt welded plates[J]. Materials Today: Proceedings, 2018, 5(2): 8328–8337.
[24] Bhaumik S, Kumaraswamy A, Guruprasad S, et al. Study of effect of seal profile on tribological characteristics of reciprocating hydraulic seals[J]. Tribology in Industry, 2015, 37(2): 264.
[25] Li Z, Feng G, Deng D, et al. Investigating welding distortion of thin-plate stiffened panel steel structures by means of thermal elastic plastic finite element method[J]. Journal of Materials Engineering and Performance, 2021, 30: 3677–3690.
Biographies

Jia Hailong received the bachelor’s degree in engineering from Central South University Institute in 2015, the master’s degree in engineering from Kunming Institute of Precious Metals in 2018. He is currently working at State Grid Qinghai Electric Power Research Institute. His research areas and directions include Metal Material, Non destructive testing technology.

Wang Zhihui received the bachelor’s degree in engineering from Shenyang University of Technology. He is currently working at State Grid Qinghai Electric Power Research Institute. His research areas and directions include Metal Material, Non destructive testing technology.

Wang Shengjie received the bachelor’s degree in engineering from Xi’an Jiaotong University. He is currently working at State Grid Qinghai Electric Power Research Institute. His research areas and directions include High voltage technology.

Chen Wenqiang received the bachelor’s degree in engineering from Xi’an Jiaotong University. He is currently working at State Grid Qinghai Electric Power company. His research areas and directions include Metal Material, Non destructive testing technology.

Liu Gaofei received the bachelor’s degree in engineering from Zhengzhou University. He is currently working at State Grid Qinghai Electric Power Research Institute. His research areas and directions include Metal Material, Non destructive testing technology.

Liu Jingzhi received the bachelor’s degree in engineering from Three Gorges University. He is currently working at State Grid Qinghai Electric Power Research Institute. His research areas and directions include Distribution equipment detection technology.
European Journal of Computational Mechanics, Vol. 33_5, 435–460.
doi: 10.13052/ejcm2642-2085.3351
© 2024 River Publishers