Mechanical Performance of Reinforced Sleeve Connection of Prefabricated Concrete Structure and Optimization Design of Its Joints
Yan Wang1, Yapeng Zhang2,* and Xuan Ji3
1School of Architectural Construction, Jiangsu Vocational Institute of Architectural Technology, Xuzhou Jiangsu 221116, China
2PowerChina Huadong Engineering Corporation Limited, Hangzhou Zhejiang 311100, China
3School of Architecture and Engineering, Jinling Institute of Technology, Nanjing Jiangsu 211199, China
E-mail: zhang_yp6@hdec.com
*Corresponding Author
Received 27 June 2024; Accepted 21 August 2024
As a new type of building structure, prefabricated concrete structure has the advantages of fast construction speed, easy quality control, environmental protection and energy saving, and this building structure form has been widely used in many countries and regions. As one of the important connection methods, the steel sleeve connection is often used in prefabricated concrete structures because of its simple, fast and convenient construction characteristics. However, at present, there are still relatively few studies on the mechanical performance of steel sleeve connections and the optimal design of their joints. The purpose of this paper is to conduct an in-depth study and analysis of the mechanical performance of the reinforcement sleeve connection and the optimal design of its joints in prefabricated concrete structures.
Existing studies have shown that the mechanical properties of rebar sleeve connections are affected by a variety of factors, including the diameter of the rebar, the material of the sleeve, the connection method and the loading conditions. Under different loading conditions, the load-bearing capacity of the reinforcing bar sleeve connection exhibits obvious changes. It was found that in the tests, the load-strain curves of the specimens showed a monotonically increasing trend before the yielding load. Specifically, the yield load of specimen 1 was 183.0 kN, and the strain distribution in the reinforcement sleeve showed different characteristics after reaching this load. The test data showed that the maximum strains in the longitudinal direction of specimen A4, in the circumferential direction of A4, in the longitudinal direction of B4 and in the longitudinal direction of C4 were 1832 10, 512 10, 1780 10 and 1795 10, respectively. The results showed that the maximum position in the central part of the socket had already begun to yield when the specimen reached the ultimate load. This indicates that the reinforcing sleeve connection exhibits some plastic deformation capacity under high loading conditions. It is shown that the ductility coefficient of the node decreases instead with the increase of reinforcement rate at the beam end. This is mainly due to the fact that the increase in reinforcement rate leads to an increase in yield displacement at the beam end, which in turn affects the ductility performance of the node. These conclusions provide an important reference and guidance for the practical application of assembled concrete structures, which helps to optimize the design and improve the overall performance and safety of the structure.
Keywords: Prefabricated concrete structure, Rebar sleeve connection, mechanical performance, node optimization.
With the advancement of building industrialization and the rapid increase in the demand for modern buildings, prefabricated concrete structures have been widely used as a new form of building structure [1]. Compared with traditional cast-in-place concrete structures, prefabricated concrete structures have the advantages of fast construction speed, easy quality control, environmental protection and energy saving, and have been applied in many countries and regions [2]. However, the connection mode and joint design of prefabricated concrete structures are still important research areas. As one of the important connection methods, the steel sleeve connection is often used in prefabricated concrete structures because of its simple, fast, and convenient construction characteristics [3]. However, at present, there are relatively few studies on the mechanical performance of steel sleeve connection and the optimal design of its joints.
Prefabricated concrete structures refer to building structures that are prefabricated in factories and assembled on site [4]. It can improve construction efficiency and reduce environmental pollution, while also having good seismic performance and structural reliability [5]. Therefore, it has been widely used in residential, commercial buildings, public facilities, and other fields. Rebar sleeve connection involves embedding the rebar sleeve into the concrete component and then connecting the components together by anchoring material. This connection method not only improves the strength of the structure, but also effectively transfers the load and improves the overall stability. With the continuous development and promotion of prefabricated concrete structures, its application fields are also expanding. At present, it has been widely used in various fields such as residential buildings, commercial office buildings, industrial plants, bridges and tunnels [6]. With the advancement and innovation of technology, the design and construction of prefabricated concrete structures are also constantly improving. For example, by introducing new materials and processes, the performance and durability of the structure can be improved, and the construction efficiency and quality control level can be improved [7].
With the advancement of technology, prefabricated concrete structures and their rebar sleeve connections will continue to develop to a higher level. For example, information technology and robotics are used to realize the digital design and automated production of structures to improve the accuracy and consistency of structures [8]. Secondly, the prefabricated concrete structure will pay more attention to sustainable development and environmental protection. With the increasing concern about environmental issues, people have higher and higher requirements for energy efficiency and environmental protection of building structures [9]. Prefabricated concrete structures can effectively reduce their impact on the environment by reducing waste and pollutant emissions during construction and utilizing renewable resources. At the same time, as market demands continue to change, building structures need to be more adaptable. Through the flexible use of modular design and combination, the prefabricated concrete structure can meet the needs of different projects and provide more diversified building forms and functions.
As a commonly used connection method, the mechanical performance and joint optimization design of reinforced sleeve connection are important research contents in prefabricated concrete structures [10]. The mechanical performance of the rebar sleeve connection is an important index to evaluate the connection quality and stability, and the bearing capacity and seismic performance of the connection can be evaluated through the study of the strength, stiffness, deformation and other properties of the connection [11]. Specifically, the mechanical performance of the reinforcement sleeve connection is closely related to the length and diameter of the connection, the arrangement of the reinforcement, the nature of the anchoring material and other factors. For example, increasing the length and diameter of the connection can improve the load-bearing capacity and stiffness of the connection, while reasonable reinforcement arrangement and the selection of high-performance anchoring materials can improve the seismic performance of the connection. Moreover, the joint optimization design is an important part of the application of steel sleeve connection in prefabricated concrete structures [12]. By optimizing the joint design, the overall performance and reliability of the node can be improved, and the safety and stability of the structure can be ensured. The joint optimization design needs to consider the mechanical characteristics, load conditions, connection methods and materials of the structure. For example, in terms of strength design, the appropriate reinforcement arrangement and size should be selected according to the type and size of the load on the node; In terms of stiffness design, the appropriate connection length and diameter should be selected according to the position and structural form of the joint to improve the stiffness and stability of the joint [13]. Finally, there are some solutions and technical means to solve the problem of mechanical performance and node optimization design of steel sleeve connection in prefabricated concrete structure. For example, through numerical simulation and experimental verification, the mechanical performance of the connection and the rationality of the node design can be evaluated. By introducing new materials and processes, the performance and durability of the structure can be improved, and the overall performance and reliability of the node can be improved. By strengthening quality management and construction supervision, the quality and stability of the connection can be ensured, and the safety and reliability of the structure can be improved [14].
Prefabricated concrete structures are an important method for realizing the industrialization of housing, and they are prefabricated in factories and transported to the construction site for assembly, which has many advantages over traditional cast-in-place concrete structures [15]. The connection between the vertical prefabricated components of the prefabricated concrete structure is usually connected by a grouting sleeve, so the quality of the grouting sleeve connection joint plays a decisive role in the reliability of the connection. In this paper, we will focus on the joint optimization design method of reinforcement sleeve connection in prefabricated concrete structure. According to the results of force performance analysis, the principles and objectives of joint optimization design are proposed, and the commonly used joint optimization design methods are introduced in detail, such as shape design and material selection. Through case analysis and discussion, we will evaluate the improvement effect of node optimization design on structural performance, and provide reference and guidance for the practical application of prefabricated concrete structures.
With the rapid development of China’s economy, science and technology, and the large demand for housing by residents, various types of reinforced concrete buildings are increasing, and the connection forms used in the construction process of steel bars are becoming more and more widely used [16]. The forms of steel connection commonly used in construction projects include lashing lap joint, welding connection and mechanical connection. In order to ensure the quality of steel bar connection, China has announced and implemented a number of industry standards. This is of great significance for improving the quality of the project and creating economic benefits.
Rebar extrusion sleeve connection is a common rebar connection method, which can connect two ribbed steel bars together through the sleeve to achieve the purpose of transmitting force and rebar connection. As a sleeve material, cold-drawn seamless steel pipe has the characteristics of large bearing capacity, so it can enhance the mechanical performance of steel bar. Ribbed steel bars are one of the commonly used deformed steel bars, and their transverse ribs can increase the friction between the steel bar and the concrete, thereby improving the tensile strength of the steel bar [17]. Reinforcing bars of different diameters need to be connected with different types of sleeves to ensure the firmness of the connection. Extrusion joints can be divided into radial extrusion and axial extrusion according to different extrusion methods [18]. Radial extrusion refers to the extrusion of the sleeve along the radial line of the sleeve by the extruder, so that it is plastically deformed, so as to bite the transverse rib of the ribbed steel bar and realize the connection of the two steel bars. Axial extrusion is to extrude the steel sleeve and the two butt steel bars inserted in the axial direction through an extruder and a stamper, so that the sleeve is bitten into the intercostal space of the ribbed steel bar and combined into one [19]. During operation, it is necessary to pay attention to the diameter difference of the connected steel bars should not be greater than 5 mm to ensure the rationality and firmness of the connection. In addition, the construction quality of the extrusion joint also has an important impact on the firmness and durability of the connection, and attention should be paid to the construction technology and quality control [20].
It is suitable for 20 mm 32 mm grade II. and III. hot-rolled ribbed steel bar connection. Figure 1 shows a schematic diagram of the axial extrusion connection of the reinforcement sleeve.
Figure 1 Schematic diagram of the axial extrusion connection of the rebar sleeve.
Figure 2 Flowchart of the shock-echo method.
The base surface of the sleeve connection is the key part of the connection between the component and the laminated plate, which determines the connection performance of the component and the laminated plate, and if it is not handled properly, it will affect the effect of the grouting connection [21]. Due to the complexity and diversity of the construction environment, floating grout and debris often appear on the connecting base surface, which will have a negative impact on the subsequent grouting effect if not cleaned up in time [22]. At present, the commonly used detection methods for grouting defects include shock echo method, embedded sensor method, embedded wire drawing method, X-ray imaging method, etc., and each method has its own advantages and disadvantages [23]. In order to improve the detection efficiency and obtain the location and type of defects, the shock echo method is mainly used to detect the samples on the construction site. The detection process of the shock echo method is shown in Figure 2, firstly, a stress wave is generated by the excitation hammer impacting the surface of the component, the reflected signal is received and amplified by the signal receiver, and the collected signal is converted into a waveform and spectrogram through the data acquisition and analysis system to determine whether there is a grouting defect inside the component [24]. The cleaning method of the grouting sleeve connection base surface under different construction environments will also have an impact on the grouting effect, so the surface attachments should be removed during construction to improve the bond strength.
Figure 3 Reinforcement strain time history curve.
In order to measure the strain change of the steel bar in the impact tensile test, the strain gauges RB-1 and RB-8 were pasted on the steel bars of the sleeve grouting section and the grouting section respectively. Figure 3 shows the strain time history curves of the steel bars on some of the specimens in four of the tests. Figure 3(a) shows that the GS16-5d-1 specimen rb-8 quickly changes to tensile strain and reaches a peak of 2875 , when the rebar is rapidly stretched and the strain gauge is out of range. Figure 3(b) shows that the strain of the rb-8 test point of the GS16-4d-4 specimen quickly reaches 2046 , which is converted into a stress of 409.4 MPa. The GS16-4d-1 curve is shown in Figure 3(c), and the rb-8 measuring point rapidly becomes larger and exceeds the effective range of the strain gauge after a period of fluctuation, and the steel bar is quickly broken. Figure 3(d) shows that the rb-1 measurement point of the GS16-5d-3 specimen rapidly becomes larger than 3500 , and the rebar quickly yields and breaks. At this time, the steel bar at the RB-1 measuring point has been broken.
In order to determine the strain on the steel sleeve in the impact tensile test, a total of 6 strain gauges in 2 groups were pasted, and the longitudinal and transverse strains at both ends and middle of the sleeve were measured respectively. Figure 4 shows the sleeve strain-time history curve of the specimen GS16-8d with a drop weight mass of 262 kg and a drop distance of 3 m.
Figure 4 GS16-8d-4 strain-time curve of specimen sleeve.
Longitudinal strains of the sleeve grouting section, the middle part and the grouting section were measured by the strain gauges GS-1, GS-2 and GS-3 respectively, and the average maximum strains at each measurement point under impact load were more than 20000 , 1400 and 540 respectively. The GS-1 is not used for analysis due to measurement errors. In the process of impact loading, the impact force in the steel bar is first transmitted to the grouting material through the cohesion force between the steel bar and the grouting material, and then the impact force is transmitted to the sleeve through the cohesive force between the grouting material and the sleeve, so the longitudinal strain in the middle of the sleeve is higher than that of the grouting section, as shown in Figure 4(a). The strain-time curves on the sleeve are all trapezoidal and have three stages. The following is illustrated with the strain in the middle of the sleeve (strain gauge GS-2) as an example. The initial strain of loading continued to grow, and the growth duration was about 1.7 ms. Then, the curve entered the plateau segment, which had an average strain of 1400 and lasted about 14.6 ms, and finally, the curve entered the descending segment with a duration of about 4.1 ms. The transverse strains of the sleeve grouting section, middle section and grouting section were measured by the strain gauges GH-1, GH-2 and GH-3 respectively, and the hoop strain-time curve is shown in Figure 4(b). The GH-1 violently oscillating waveform is quite different from the other two strain gauges, which can be judged as invalid data and excluded. In the early stage of impact load loading, the longitudinal strain in the middle of the sleeve and the grouting section changes to tensile strain, which causes the hoop contraction and thus produces compressive strain, so the compressive strain occurs first in GH-2 and GH-3, and the compressive strain gradually increases, and the time to reach the peak is consistent with the longitudinal strain. After that, the hoop strain at GH-2 enters the platform end; However, the hoop strain at GH-3 may be affected by the cork effect, and the grouting material squeezes the sleeve, causing the sleeve to appear tensile strain.
Under the action of impact load, the longitudinal strain rate of the sleeve loading can be reacted by its longitudinal strain rate. The longitudinal strain rate of the sleeve can be determined by the longitudinal strain-time curve on the sleeve under impact loading, which is defined by the slope of the rising section of the curve. By this method, the strain rate in the middle of the sleeve can be determined to be 1.5 s and 0.8 s near the outlet. It can be seen that the strain rate on the sleeve varies along the longitudinal direction, and it is also manifested as a large middle and small ends.
As a commonly used connection method in prefabricated concrete structures, the joint design of steel sleeve connection is very important to ensure the safety and stability of the structure [25]. The joint optimization design can improve the strength, stiffness, and seismic performance of the connection by rationally selecting the connection length and diameter, optimizing the reinforcement arrangement, and selecting high-performance anchoring materials [26].
In order to further study the mechanical performance of the connecting joints of the reinforcement sleeve, it is necessary to use a combination of numerical simulation and experiments to study [27]. The test sleeve is a full grouting sleeve, the sleeve is made of ductile iron, No. 45 steel and Q345, which are currently the most frequently used, and the diameter of the connecting steel bar in the sleeve is 16 mm. Among them, the material properties of ductile iron grouting sleeve, No. 45 steel grouting sleeve and Q345 grouting sleeve are shown in Table 1. The ductile iron grouting sleeve is completed by integrated pouring, the surface of the sleeve is smooth, and the surface of the No. 45 steel grouting sleeve and the Q345 grouting sleeve are uneven.
Table 1 Material properties of grouting sleeves
| Material | Tensile Strength /MPa | Elongation After Break /% | Yield Strength /MPa |
| QT600 | 600 | 3 | 600 |
| 45# Bar | 600 | 600 | 600 |
| Q345 | 600 | 600 | 600 |
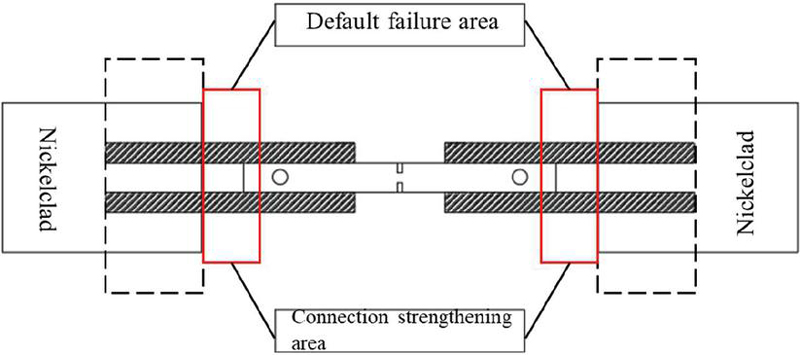
Figure 5 Welding diagram of post-connecting steel bar and sleeve.
Combined with the actual engineering situation, because only the concrete on the side of the sleeve close to the surface of the prefabricated shear wall needs to be removed when the structure is reinforced at the construction site, the double-sided lap welding of the steel bar and the sleeve cannot be achieved [28]. As shown in Figure 5, the specimen is axially symmetrically arranged, and two post-supplementary connecting rebars are welded on both sides of the outer wall of the sleeve grouting port end, and if the fixture of the universal testing machine is directly used to clamp two post-connecting reinforcing bars at the same time, because the clamp clamping two reinforcing bars at the same time cannot ensure that the force is completely symmetrical, it is likely that the force will be uneven during the tensile test, which will affect the test results [29]. Therefore, two post-connecting steel bars were welded with the force-transmitting steel plate, and an external extension steel bar was welded on the force-transmitting steel plate, so that the upper and lower ends of the specimen were single-point clamped during the tensile test, and the tensile force was evenly transmitted to the two post-connecting steel bars through the external extension steel bar and the force-transmission steel plate, so as to ensure the reliability of the test results [30].
The most difficult and important part of this test is the measurement of steel strain, through the method of pasting the strain gauge in the groove of the slotted steel bar, the change of the steel bar strain in the anchor section of the sleeve can be accurately measured [31], and the measurement of the longitudinal strain of the sleeve is to polish the strain gauge paste position and paste it after smoothing, and the measurement of the circumferential strain of the sleeve is to polish the strain gauge paste position along the hoop direction and paste it [32]. During the test, the anchored bars deformed significantly after reaching the yield load and gradually decreased from the end of the sleeve to the middle. With the increase of load, the excessive deformation of the reinforcement led to the damage of the strain gauges, and therefore the strain after yielding could not be measured. Therefore, only the strain data before yielding were analyzed. The longitudinal and circumferential strains in the sleeve were small in the tests, so the strain data prior to the ultimate loading of the sleeve were analyzed in detail. Although multiple strain gauges were installed on the bars and sleeves, very few strain gauges were damaged during the tests and these damaged strain gauges were excluded from the data processing. Overall, the test data focused on the strain performance of the reinforcement before yielding, providing an important reference for the performance of assembled concrete structures under actual loading.
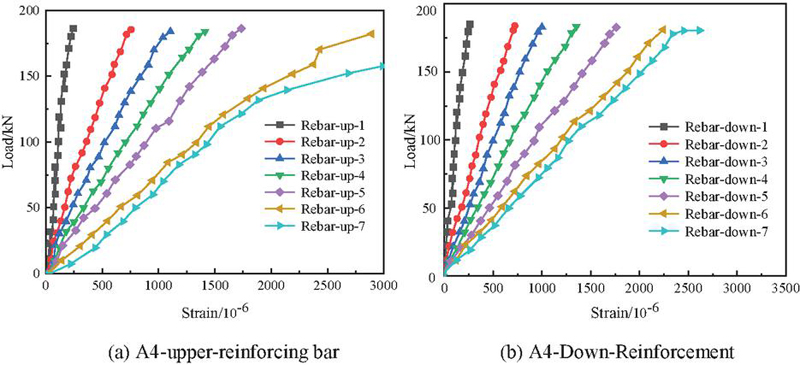
Figure 6 Specimen 1 load-strain curve.
From Figure 6 that the load-strain curves of all the measuring points distributed on the steel bar are monotonically increasing before the specimen 1 is continuously loaded from 0 kN to 183.0 kN, and the strain changes faster at the measuring points close to the end of the sleeve, while the strain changes more slowly at the measuring points close to the end of the sleeve, such as the steel bar-up-1,2 and the rebar-bottom-1,2 and the rebar-bottom-1,2 near the middle of the sleeve.
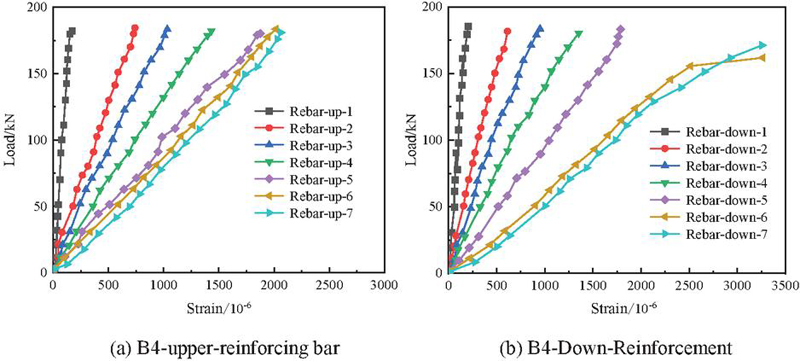
Figure 7 Specimen 2 load-strain curve.
According to Figure 7, the specimen 2 is continuously loaded from 0 kN to 182.4 kN, and before the load is loaded to the yield load of 182.4 kN, the load-strain curves of all the measuring points distributed on the reinforcement bar are monotonically increasing, and the strain changes faster at the measuring points close to the end of the sleeve, such as the reinforcement-up-6, 7 and the reinforcement-lower-6, 7, which are closer to the end of the sleeve, but the strain changes slowly at the measuring points near the middle of the sleeve, such as the reinforcement-up-1, 2 and rebar-down-1, 2.
The strain gauge in the middle of the sleeve is used as the position base point, that is, the position of 0 point, the relative distance of the loading end on the left side of the base point is negative, and the relative distance of the clamping end on the right side of the base point is positive.
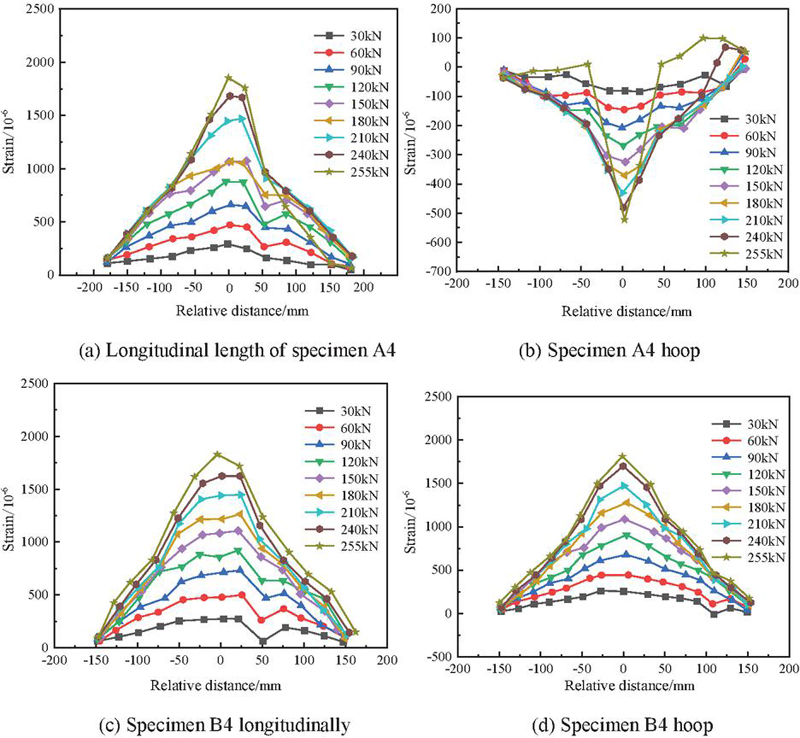
Figure 8 Strain-position distribution curves of the sleeve surface under different loads.
The load classification of specimens A4, B4 and C4 is 9 grades, and the load classification of the specimen is 2 grades when the specimen is pulled out and failed before yielding. From the point of view of position, the strain on the sleeve in both longitudinal and circumferential directions increases with the increase of load, and from the overall point of view of the sleeve, the strain on the sleeve gradually decreases from the middle position of the sleeve to the end of the sleeve, and is symmetrically distributed from the middle of the sleeve. From the test data, it is found that the maximum strains of the specimen A4 longitudinal, A4 hoop, B4 longitudinal and C4 longitudinal are 1832 10, 512 10, 1780 10 and 1795 10, the sleeve with an outer diameter of 54 mm should not be used, and there is not enough strength reserve. None of the other specimens reached the yield strain, indicating that the specimens were within the elastic range and had a certain strength reserve.
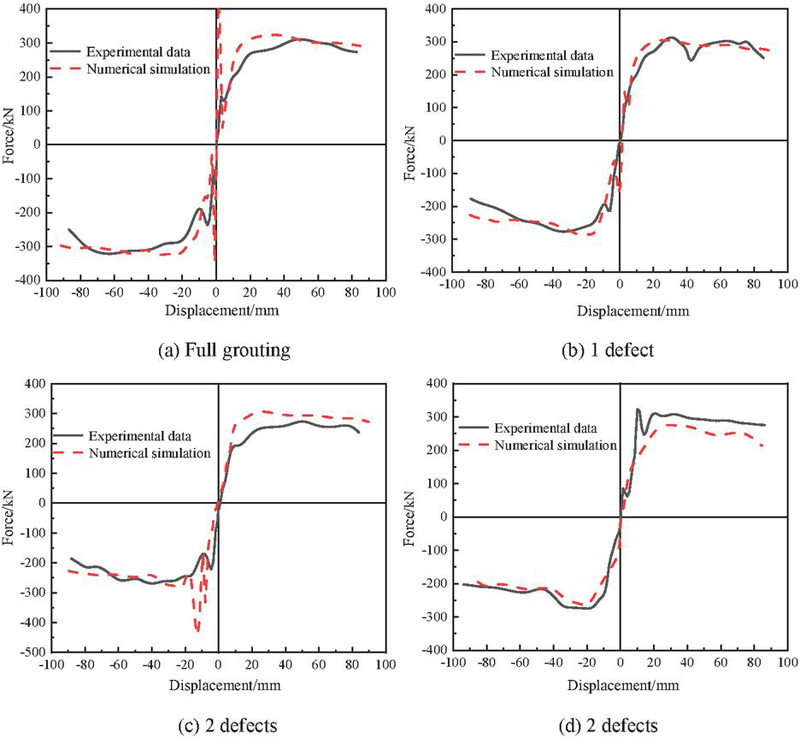
Figure 9 Comparison of the frame curve of the numerical simulation and the field test.
The skeleton curve of the prefabricated concrete column under different working conditions is compared with the field test data of Zheng Qinglin, and the numerical simulation is compared with the field test skeleton curve as shown in Figure 9. As can be seen from Figure 9, the overall change trend of the skeleton curve of the prefabricated concrete column is consistent with that of the numerical simulation and the field test, when the displacement is 2020 mm, the displacement of the prefabricated concrete column is positively correlated with its bearing capacity, and its bearing capacity gradually increases with the increase of the displacement of the concrete column. When the displacement of the prefabricated concrete column is less than 20 mm or greater than 20 mm, the change trend of the skeleton curve is relatively flat. The change trend of the skeleton curve obtained by numerical simulation is relatively smooth, while the skeleton curve obtained by field test has a certain fluctuation, indicating that there is a certain difference between the working conditions of numerical simulation and the field test, and the results obtained by numerical simulation cannot completely restore the working conditions of field experiments, but the difference between the two is small and negligible. The analysis of the numerical simulation results of the assembled concrete columns showed that when the columns were fully grouted or had only 1 defect, the difference between the skeleton curves of the numerical simulation and those of the field tests was small, and the simulation results were better. However, when there were 2 or 3 defects, the difference between the simulation results and the test results increased significantly, especially when the displacement was greater than 0 mm, and the bearing capacity of the numerical simulation was higher than that of the field test. This is due to the fact that the spring unit and rod system unit used in the numerical model cannot fully reflect the actual situation, resulting in a large stiffness and ductility in the forward loading section and a small one in the reverse loading section, which makes the simulated energy dissipation capacity lower than the actual results. Therefore, improving the accuracy of the model and taking more practical factors into consideration are essential to increase the accuracy of the simulation.
When the prefabricated concrete column is in a full grouting state, the simulation effect of the yield load and peak load is better in numerical simulation, and the difference between the bearing capacity obtained by numerical simulation and the bearing capacity obtained by field test is within 3%, and the difference between the ultimate load obtained by numerical simulation and the ultimate load obtained by field test is more than 10%, indicating that the results of yield load and peak load calculated are more accurate when the prefabricated concrete column in the full grouting state is simulated by numerical simulation. When the prefabricated concrete column has 2 defects and 3 defects, the test data is more than 10%, and the accuracy of the analysis of the bearing capacity of the prefabricated concrete pile is low compared with the prefabricated concrete column in the full grouting state. This is due to the fact that when the specimen is subjected to cyclic load, there are holes in the prefabricated concrete column with grouting defects, which causes the sliding phenomenon between the steel bar and the concrete, and its bearing capacity is reduced.
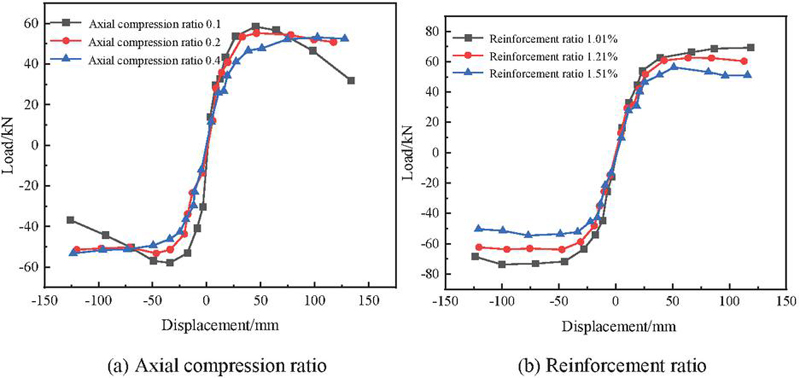
Figure 10 Skeleton curves under different axial compression ratios and reinforcement ratios.
In the concrete structure, the size of the axial compression ratio will directly affect the failure mode of the joint, and successively affect the overall mechanical properties of the joint, the prefabricated concrete beam-column joint designed in this paper is designed to improve the mechanical performance of the core area of the precast column, under the action of different axial compression ratios, the multi-directional “extrusion” force of the concrete in the core area will be more complex, which directly affects the bearing capacity of the core area, so it is necessary to analyze the mechanical performance of the prefabricated concrete beam-column joints under different axial compression ratios. In this paper, the axial compression ratio is set to 0.1, 0.2, and 0.4 respectively, and other parameters of the node remain unchanged. The skeleton curve of the model is shown in Figure 10, Table 2 is the node feature points and ductility coefficients under the action of different axial compression ratios, in the early stage of loading, the trend of the skeleton curves of the three nodes is about the same, and the slope is not much different, indicating that the axial compression ratio has little influence on the initial stiffness of the joint, with the increase of the axial compression ratio, the bearing capacity of the node is gradually increased.
Table 2 Node feature points and ductility coefficients under different axial compression ratios
| Yield Point | Ductility Coefficient | ||||
| Specimen Number | Loader Toward | Py/kN | y/mm | Average | |
| Axial compression | Positive | 44.67 | 30.43 | 4.08 | 4.11 |
| ratio 0.1 | Negative | 44.53 | 29.60 | 4.14 | |
| Axial compression | Positive | 48.68 | 26.93 | 4.19 | 4.52 |
| ratio 0.2 | Negative | 46.98 | 24.90 | 4.86 | |
| Axial compression | Positive | 48.34 | 24.68 | 3.20 | 3.11 |
| ratio 0.4 | Negative | 44.67 | 23.63 | 3.01 | |
In order to improve the bearing capacity of the joints and explore the influencing factors of the reinforcement ratio of the beam ends, three groups of different beam-end reinforcement ratios were set up, and the reinforcement ratios were 1.01%, 1.24% and 1.51%, respectively, and the diameters of the corresponding tensile reinforcement bars were 18 mm, 20 mm and 22 mm. It can be seen from the skeleton curves under the action of different beam end reinforcement ratios in Figure 10 that the initial stiffness of the joints is not much different at the initial loading stage, and with the increase of displacement, the stiffness of the joints with a reinforcement ratio of 1.51% is greater than that of the other two nodes. At the same time, it can be seen that the peak load and yield load of the node with 1.21% reinforcement ratio are increased by 20.19% and 23.1%, respectively, the peak load and yield load are 63.48 kN and 55 kN, and the peak load and yield load of the node with 1.51% reinforcement ratio are 73.94 kN and 60.83 kN, respectively, which are 16.4% and 10.6% higher than that of the reinforcement ratio of 1.24%, indicating that the increase of the reinforcement ratio at the beam end has a great impact on the bearing capacity of the joint. For the ductility coefficient of the joint, with the increase of the reinforcement ratio of the beam end, the ductility of the joint decreases, mainly because the yield displacement of the beam end increases with the increase of the reinforcement ratio.
The ultimate load of the sleeve grouting joint depends on the lesser of the tensile strength of the reinforcement and the bond strength of the reinforcement grout. When the failure mode of the sleeve joint is the tensile break of the rebar, the ultimate load of the joint depends on the breaking load of the connecting rebar, and the difference is not large. When the joint is damaged by the reinforcement pull-out, the ultimate load is significantly reduced. Figure 11 shows the variation of the ultimate tensile load of the sleeve joint with different connection steel diameters with temperature and grouting defect rate. Under normal temperature conditions, the ultimate load of 14 and 18 mm sleeve joints is significantly reduced only under 30% defects, which is 10.7% and 14.2% lower than that of non-defect joints, respectively. The ultimate load of the 20 mm sleeve joint is significantly reduced after 20% defects, which is 7.8% and 21.7% lower than that of the non-defective specimens, respectively. Under the same grouting defect rate, the larger the diameter of the reinforcement, the greater the reduction of the ultimate load. After the 14 mm diameter sleeve joint specimen undergoes high temperature, there is a significant difference in the reduction of the ultimate load of the specimen after high temperature under different grouting defect rates. For the 0% grouting defect specimen, the ultimate load is significantly reduced after only 600C, which is 7.7% lower than that of the normal temperature specimen. Although the steel bar pulls out and fails after the sleeve joint specimen is applied at 400C, there is no significant difference between the ultimate load and the ultimate load at room temperature. For the 10% grouting defect specimen, the sleeve joint was pulled out and damaged after 400C and 600C, and the ultimate load was reduced by 2.1% and 18.9% respectively compared with that at room temperature. For the 20% grouting defect specimen, the sleeve joint was pulled out and failed after 400C and 600C, and the ultimate load was reduced by 7.1% and 19.3% respectively compared with that at room temperature. It shows that in the 20% grouting defect, only after 600C, the ultimate load of the sleeve joint will be significantly affected, and the load will be significantly reduced. For the 30% grouting defect specimens, the ultimate load of the sleeve joint was reduced by 1.2%, 6.7% and 18.3% respectively compared with the normal temperature after the action of high temperatures of 200, 400 and 600C, and 11.8%, 16.7% and 27.1% lower than that of the specimens without grouting defects at room temperature, respectively. It can also be seen from Figure 11(a) that under the dual influence of grouting defect rate and temperature, the connecting reinforcement has passed the yield state when the sleeve joint is damaged. After the 18 mm diameter sleeve joint specimen undergoes high temperature action, there is a significant difference in the reduction of the ultimate load of the joint specimen at high temperature under different grouting defect rates. For the 0% grouting defect specimen, the bonding performance of the sleeve joint deteriorates significantly after the high temperature of 600C, and the connecting steel bar is pulled out, and the ultimate load of the sleeve joint is reduced by 8.3% compared with that at room temperature. For the joint specimen with a grouting defect rate of 10%, the ultimate load of the specimen is significantly reduced after the high temperature of 600C, which is 11.3% lower than that of the normal temperature specimen. In 10% of the defects, only 600C high temperature has a significant effect on the ultimate load of the specimen. For the 20% grouting defect specimens, the ultimate load was reduced by 5.5%, 8.0% and 26.0% respectively after high temperature at 200, 400 and 600C. For the 30% grouting defect specimens, the ultimate load of the joint specimen was reduced by 3.4%, 9.5% and 35.5% respectively compared with the normal temperature after the action of high temperature at 200, 400 and 600C, and 23.49%, 22.3% and 44.7% lower than that of the joint specimen without grouting defect at room temperature, respectively. It can also be seen from Figure 11(b) that the ultimate load of the 30% grouting defect joint specimen is significantly lower than the standard value of the yield load of the reinforcement after 600C. Regardless of the size of the grouting defect rate, the ultimate load of the sleeve joint is greatly reduced compared with the normal temperature condition after the high temperature action of 600C.
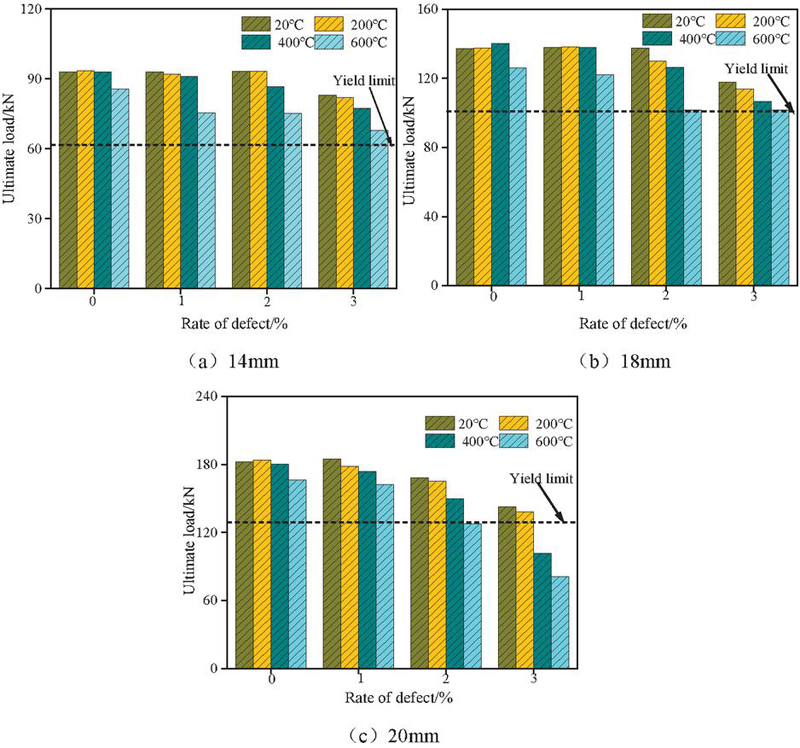
Figure 11 Ultimate tensile load of sleeve grouting joints with different steel bar diameters.
After the 20 mm diameter sleeve joint specimen undergoes high temperature, there is a significant difference in the reduction of the ultimate load of the specimen under different grouting defect rates. For the 0% grouting defect specimen, the sleeve joint was pulled out and damaged after 400 and 600C, and the ultimate load was reduced by 1.2% and 9.0% respectively compared with that at room temperature. For the 10% grouting defect specimen, the steel bar pull-out failure of the sleeve joint after 400 and 600C action was performed, and the ultimate load was reduced by 6.2% and 22.92% respectively compared with that at room temperature. At 200C, the sleeve joint has a tensile breakage of the steel bar, but due to the influence of the steel bar welding treatment, the strength of the steel bar is damaged to a certain extent, and the ultimate load of the specimen is reduced by 3.7%, although the reduction is small, but the influence of steel bar welding on the performance of the specimen should also be considered in the project. Within 10% of the defects, the ultimate load of the specimen decreases significantly after only 600C. For the 20% grouting defective specimens, the ultimate load was reduced by 1.7%, 11.0% and 24.2% respectively compared with the normal temperature after 200, 400 and 600C, and 9.3%, 18.0% and 30.1% lower than that of the non-defective specimens at room temperature, respectively. For the 30% grouting defective specimens, the ultimate load was reduced by 3.4%, 28.8% and 43.3% respectively compared with the normal temperature after 200, 400 and 600C, and 24.3%, 44.3% and 55.6% lower than that of the non-defective specimens at room temperature, respectively. It can also be seen from Figure 11(c) that the ultimate load of the 30% grouting defective sleeve joint specimens after 400 and 600C is significantly lower than the standard value of the yield load of the reinforcement. Under the condition of 0% grouting defect, the ultimate load of 14, 18 and 20 mm diameter sleeve joints is reduced by 7.7%, 8.3% and 9.0% respectively compared with the normal temperature specimens under the action of 600C. Under the condition of 30% grouting defects, the ultimate loads of 14, 18 and 20mm diameter sleeve joints are reduced by 27.1%, 44.7% and 55.6% respectively compared with those without defects at room temperature, respectively, after the action of high temperature at 600C, indicating that the ultimate load reduction of sleeve joints increases gradually with the increase of steel bar diameter. In practical engineering, although large-diameter steel bars are recommended, the influence of temperature and defects on the ultimate load reduction of large-diameter steel sleeve joints should attract our attention.
In this paper, the mechanical performance and joint optimization design of the steel sleeve connection in the prefabricated concrete structure are discussed, and the strength, stiffness, deformation and other properties of the connection are studied, so as to evaluate the bearing capacity and seismic performance of the connection, and optimize the joint design to improve the overall performance and reliability. Through the analysis of relevant literature and research results, we have come to the following conclusions:
(1) Reinforcing sleeve connections exhibit good stress performance in assembled concrete structures. The length and diameter of the connection significantly affect the load carrying capacity and stiffness, and increasing these two parameters can enhance the performance. At the same time, reasonable arrangement of reinforcement and use of high-performance anchoring materials can enhance seismic resistance, and these factors should be considered comprehensively in the node design to meet the actual needs.
(2) The optimal design of joints is an important measure to ensure the safety and stability of prefabricated concrete structures. The joint design needs to comprehensively consider the mechanical characteristics, load conditions, connection methods and materials of the structure. Compared with the reinforcement ratio of 1.01%, the peak load and yield load of the 1.21% node increased by 20.19% and 23.1%, respectively, the peak load and yield load were 63.48 kN and 55 kN, respectively, and the peak load and yield load of the 1.51% node were 73.94 kN and 60.83 kN, respectively, which were 16.4% higher than that of the 1.24% reinforcement ratio and 10.6%, indicating that the improvement of the reinforcement ratio at the beam end has a great impact on the bearing capacity of the joint. For the 20% grouting defect specimens, the ultimate load was reduced by 5.5%, 8.0% and 26.0% respectively after high temperature at 200, 400 and 600C. For the 30% grouting defect specimens, the ultimate load of the joint specimen was reduced by 3.4%, 9.5% and 35.5% respectively compared with the normal temperature after the action of high temperature at 200, 400 and 600C, and 23.49%, 22.3% and 44.7% lower than that of the joint specimen without grouting defect at room temperature, respectively. By optimizing the design, the overall performance and reliability of the node can be improved.
[1] Wang Shunyao, Wang Yilin, Sheng Dapeng, Wang Yu and Wen Jiaqi. (2024). Behavior of semi-prefabricated steel-tube double-layer concrete columns under eccentric compression. Journal of Asian Architecture and Building Engineering (4), 1278–1298.
[2] Hongze Wang, Yunhong Hao, Lida Qin, Hao Sun, Yupeng Zhao and kelehan Cha. (2024). Corrigendum to “Experimental and numerical study on seismic performance of prefabricated new fly ash foam concrete structure” [Soil Dynam. Earthq. Eng. 178 (2024)108462]. Soil Dynamics and Earthquake Engineering 108564–.
[3] Guobiao Lou, Yifan Li, Guilin Jia and Pixu Chen. (2024). Experimental, numerical and analytical investigation of axial compression performance of angle steel lattice concrete composite column used in the prefabricated structures. Journal of Building Engineering 108671–.
[4] Martins Ricardo, Carmo Ricardo do, Costa Hugo and Júlio Eduardo. (2023). A review on precast structural concrete walls and connections. Advances in Structural Engineering (14), 2600–2620.
[5] Zhou Zhijun, Li Ming, Wu Qian, Yuan Shuang and Zhang Li. (2022). Cyclic Performance of Prefabricated Shear Wall Connected to Columns by Rectangular Concrete-Filled Steel Tube Keys. Coatings (10), 1584–1584.
[6] Cao Yan and Yang Zhao. (2022). Seismic Damage Evaluation of Beam-Column Joints in Monolithic Precast Concrete Frame Structures. Materials (17), 6038–6038.
[7] Liu Youquan, Xiong Jingang, Wen Jiancong and Xiong Moqiang. (2022). Research on collapse ultimate load of fabricated reinforced concrete column and steel beam composite frame structure. Scientific Reports (1), 13604–13604.
[8] Wang Shunyao, Wang Yilin, Sheng Dapeng and Wang Yu. (2022). Study on New Prefabricated Reinforced Concrete Structure Technology Based on Fault-Tolerant Design. Buildings (6), 814–814.
[9] Li Chao, Zhu Hao, Liu Xinyu, Xia Chengxin, Wang Peijun, Liu Fangzhou … and Wei Dong. (2022). Mechanical properties of plate type steel bar connectors for prefabricated concrete structures. Advances in Structural Engineering (5), 1027–1041.
[10] Chen Dong, Zhang Zhiyong, Liu Xiaozhen, Wang Qiong, Zhao Baojun, Ren Gang and Wang Changjun. (2022). Experimental Study on Mechanical Properties of Rebar in Steel Half-Grouted Sleeve Connections with Construction Defects. Journal of Environmental and Public Health, 9379135–9379135.
[11] Ni, Wei Bin, Qiao, De Hao, Sun, Hong Wei, Zhang, Xu, Zhang, Zhong Wen and Wang, Shao Jie. (2021). Seismic Performance of a Full-Scale Precast Concrete L-Shaped Column Frame Structure with a Grouted Connection. KSCE Journal of Civil Engineering (2),1–17.
[12] Hu Zhijian, Shah Yasir Ibrahim and Yao Pengfei. (2021). Experimental and Numerical Study on Interface Bond Strength and Anchorage Performance of Steel Bars within Prefabricated Concrete. Materials (13), 3713–3713.
[13] Guo Junying, Gou Yongbao, Li Zhongcheng and Guo Quanquan. (2023). Experimental research on static and cyclic pullout behavior of cast-in-place anchors with steel sleeve. Structures, 1883–1890.
[14] Huang Chunhua, Ding Bo, Ou Zhihua and Feng Ruiping. (2023). Influence of Defoamer on the Properties and Pore Structure of Cementitious Grout for Rebar Sleeve Splicing. Buildings (1), 170–170.
[15] Cao Jun, Jia Haidong, Ma Weifeng, Wang Ke, Yao Tian, Ren Junjie … and Dang Wei. (2022). Repair Reliability Analysis of a Special-Shaped Epoxy Steel Sleeve for Low-Strength Tee Pipes. Metals (12), 2149–2149.
[16] Fu Tao, Wang Kai, Zhu Zhixin, Ren Xiaoqian, Li Yan, Xu Longwei … and Sun Zhonghua. (2023). Seismic performance of prefabricated square hollow section piers strengthened by jacketing using UHPC and high-strength steel. Structures, 449–465.
[17] Liu Yashuang, Ma Hua, Li Zhenbao and Wang Wenjing. (2020). Seismic behaviour of full-scale prefabricated RC beam–CFST column joints connected by reinforcement coupling sleeves. Structures, 2760–2771.
[18] Shufeng Li and Di Zhao. (2024). Research on the mechanical behavior of high-strength bolted joints between prefabricated concrete beams and columns. Mechanics of Advanced Materials and Structures (8), 1832–1846.
[19] Liu Jiliang, Wang Baomin, Chu Mingjin, Zhang Pengfei and Wang Bo. (2023). Influence of the axial load ratio on the mechanical behaviour of prefabricated concrete shear walls with Mortise–Tenon joints. Structures, 83–97.
[20] Kai Qian, Guang-Tao Li, Dong-Qiu Lan and Liu Jin. (2023). Progressive Collapse Response of Reinforced Concrete Assembly with Realistic Boundary Conditions. ACI Structural Journal (4), 43–56.
[21] Liu Youquan, Xiong Jingang, Wen Jiancong and Xiong Moqiang. (2022). Research on collapse ultimate load of fabricated reinforced concrete column and steel beam composite frame structure. Scientific Reports (1), 13604–13604.
[22] Bogdan Hauşi Sorin. (2022). Issues Regarding the Appropriateness of Using Precast Reinforced Concrete Frame Structures Compared to Monolithic Reinforced Concrete Frame Structures, in Office Buildings and Residential Buildings. Bulletin of the Polytechnic Institute of Iaşi. Construction. Architecture Section (3), 35–50.
[23] Wang Shunyao, Wang Yilin, Sheng Dapeng and Wang Yu. (2022). Study on New Prefabricated Reinforced Concrete Structure Technology Based on Fault-Tolerant Design. Buildings (6), 814–814.
[24] M V Ariskin and I N Komrakov. (2020). Investigation of nodal coupling of reinforced concrete column and floor in buildings with monolithic assembly framework by ANSYS. IOP Conference Series Materials Science and Engineering (1), 012139.
[25] Ţere S., Toader N., Hegheş B. and Constantinescu H. (2020). Study on the bracing effect added by the corrugated sheets for a single-storey precast reinforced concrete structure. Bulletin of the Transilvania University of Brasov. Series I – Engineering Sciences (2), 71–78.
[26] Ru-wei Wang, Wan-Lin Cao, Fei Yin and Hong-Ying Dong. (2019). Experimental and numerical study regarding a fabricated CFST frame composite wall structure. Journal of Constructional Steel Research, 105718–105718.
[27] S Tere, N Toader, B Heghes and H Constantinescu. (2019). Study on the bracing effect added by the corrugated sheets for a single-storey precast reinforced concrete structure. Bulletin of the Transilvania University of Brasov. Engineering Sciences. Series I(2), 71–78.
[28] Wang Qiang, Qin Weiyang and Lu Chunling. (2023). Effects of Large-Diameter Rebar Replacement on Seismic Behavior of Precast Concrete Columns with Grouted Sleeve Connections. Buildings (3), 706–706.
[29] Chen Dong, Zhang Zhiyong, Liu Xiaozhen, Wang Qiong, Zhao Baojun, Ren Gang and Wang Changjun. (2022). Experimental Study on Mechanical Properties of Rebar in Steel Half-Grouted Sleeve Connections with Construction Defects. Journal of Environmental and Public Health, 9379135–9379135.
[30] David Abayomi B. and Olalusi Oladimeji B. (2024). Uncertainty modelling and assessment of shear resistance in reinforced concrete beams without shear reinforcement. Australian Journal of Structural Engineering (3), 295–314.
[31] Bao Zhibo, Wang Jun and Jiao Yurong. (2024). Flexural performance tests and machine learning analysis of prestressed high strength steel reinforced concrete beams. Journal of Asian Architecture and Building Engineering (4), 1339–1354.
[32] M. H. Ewees, A. S. A. Gabr and M. Rabie Farrag. (2024). Effect of tension and compression flexural reinforcement on punching shear strength of reinforced concrete flat slab. Alexandria Engineering Journal, 282–302.

Yan Wang received the bachelor’s degree in Engineering from Hebei University of Architecture in 2009, the master’s degree in engineering from Chongqing University in 2013. She is currently working as an lecturer at the School of Architectural Construction, Jiangsu Vocational Institute of Architectural Technology. Her research areas and directions include concrete structures and prefabricated buildings.

Yapeng Zhang received the bachelor’s degree in engineering from Chongqing University in 2011, the master’s degree in engineering from Chongqing University in 2014, and the doctorate degree in engineering from University of Chinese Academy of Sciences in 2021. He is currently working as a civil engineer at PowerChina Huadong Engineering Corporation Limited. His research areas and directions include stability analysis and control technology for deep excavation.

Xuan Ji received the bachelor’s degree in Engineering from Anhui University of Architecture in 2010, and obtained the master’s degree in engineering from Chongqing University in 2013. She is currently working as an experimenter at the School of Architecture and Engineering, Jinling Institute of Technology. Her research areas and directions include prestressed prefabricated building and durability of deep foundation pit.
European Journal of Computational Mechanics, Vol. 34_1, 1–28.
doi: 10.13052/ejcm2642-2085.3411
© 2025 River Publishers